
ABSTRACT
The purpose of this study was to examine the effects of a low-carbohydrate high-protein (LCHP) diet on the expression of glucose transporters and their relationships to glucose metabolism. Male C57BL/6 mice were fed a normal control or LCHP diet for 2 weeks. An oral glucose tolerance test and insulin tolerance test (ITT) were performed, and the expression of glucose transporters was determined in the gastrocnemius muscle, jejunum and pancreas. The increase in plasma insulin concentrations after glucose administration was reduced in the LCHP group. However, LCHP diet had no effects on peripheral insulin sensitivity or glucose transporters expression in the gastrocnemius and pancreas. Soluble glucose transporter (SGLT)-1 protein content in jejunum was lower in the LCHP group. Taken together, these results suggest that the blunted insulin response after glucose administration in LCHP diet-fed mice might be due to decreased SGLT-1 expression, but not to an increase in peripheral insulin sensitivity.
Abbreviations: LCHP: low-carbohydrate high-protein; ITT: insulin tolerance test; GLUT: glucose transporter; SGLT: soluble glucose transporter; OGTT: oral glucose tolerance test; AUC: area under the curve.
Graphical Abstract
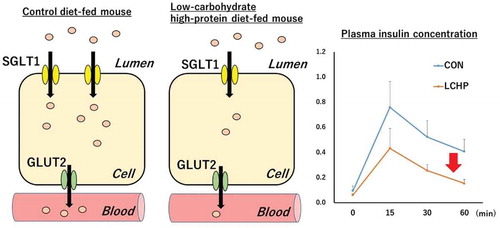
Reduced SGLT-1 expression caused by low-carbohydrate high-protein diet diminished glucose absorption rate and resulted in lower insulin secretion.
Recently, several weight management programs for obese humans have included the option of a low-carbohydrate high-protein (LCHP) diet. Although LCHP diet always reduces body weight effectively compared with other diets [Citation1,Citation2], both human and rodent studies have demonstrated that LCHP diets could also improve insulin resistance and glucose homeostasis [Citation3,Citation4]. However, the mechanisms underlying this LCHP diet-induced improvement in glucose metabolism have not yet been fully elucidated.
Glucose metabolism is regulated by a family of highly related transporters that are the products of distinct genes and are expressed in a highly controlled tissue-specific fashion. For example, glucose transporter (GLUT)-2 and GLUT-4 are responsible for glucose-induced insulin secretion in pancreatic β-cells, and for insulin- or contraction-induced glucose uptake in the skeletal muscle, respectively [Citation5–Citation8]. Furthermore, both GLUT-2 and soluble glucose transporter (SGLT)-1 play important roles in glucose absorption in the small intestine [Citation9,Citation10]. Given these important functions and the apparent favorable effects of the LCHP diet on glucose metabolism, we hypothesized that these effects might be mediated by glucose transporters expression. However, little is known in general about the effects of an LCHP diet on glucose transporters in the small intestine, skeletal muscle or pancreas. Therefore, the purpose of this study was to examine the effects of an LCHP diet in mice on the expression of glucose transporters in the small intestine as well as other tissues, and to elucidate the relationship of these effects on the ultimate glucose tolerance and insulin sensitivity. In this study, we show that mice fed LCHP diet exhibit an impaired insulin response to a glucose load. Since the blunted insulin response occurs without an increase in peripheral insulin sensitivity, we proposed that the reduction of insulin response in mice fed LCHP diet is due to a decrease of SGLT-1 protein content in the small intestine.
Materials and methods
Animals and experimental treatment
Six-week-old male C57BL/6 mice (18–20 g) were obtained from Japan CLEA (Tokyo, Japan). After 7 days of acclimatization, the mice were separated into two groups matched for body weight: the control group (CON) was fed an AIN-93-based control diet (59.2% carbohydrate, 19.2% protein, and 21.6% fat as percentages of calories), and the LCHP group was fed a low-carbohydrate diet (10% carbohydrate, 76.7% protein and 21.6% fat as percentages of calories) (). The mice were provided with water ad libitum. Food intake and body weights were recorded every day. All animals were housed in room light from 6:00 am to 6:00 pm under a constant room temperature of 20–23°C. The committee for Animal Experimentation at the University of Shiga Prefecture approved this study protocol.
Table 1. Composition of experimental diets.
Oral glucose tolerance test (OGTT) and insulin tolerance test (ITT)
After 2 weeks on the respective diets, the OGTT was performed. In brief, the mice were weighed after a 16-h fast, and then a freshly prepared 40% glucose solution was administrated orally (at 2 g/kg body weight) using a stainless-steel gavage needle. Blood samples were collected into capillary tubes from the tail vein immediately before and at 30, 60, 90, and 120 min after glucose administration. For the ITT, the mice were fasted for 6 h and injected (intraperitoneally) with 0.75 U insulin/kg body weight. The capillary tubes were then centrifuged and plasma samples were collected and stored at – 80°C until analysis. The area under the curve (AUC) values for plasma glucose and insulin were calculated using the trapezoidal rule.
Tissue collection
At the end of the feeding period, the mice were fasted overnight and sacrificed under anesthesia with isoflurane. Blood samples were collected from the axillary artery, and the gastrocnemius muscle, epididymal fat pads, kidney, liver, and pancreas were dissected out and weighed. The jejunum was dissected and washed in ice-cold phosphate buffered saline. The mucosa of the jejunum was scraped with a blade on ice. All tissue samples were frozen in liquid N2 and stored at – 80°C until analysis.
Western blot analysis
The sample for western blot were prepared as previously described [Citation11]. Briefly, the gastrocnemius muscle, pancreas, and jejunum were homogenized in ice-cold radioimmunoprecipitation assay buffer (Upstate, Lake Placid, NY, USA) containing 50 mM Tris-HCl, pH 7.4, 150 mM NaCl, 0.25% deoxycholic acid, 1% NP-40, 1 mM EDTA, and protease inhibitor cocktail (Nacalai Tesque, Tokyo, Japan). The homogenates were centrifuged at 15,000 × g for 10 min at 4°C. The supernatants were collected and protein concentrations were determined with a bicinchoninic acid assay kit. Samples were prepared in Laemmli sample buffer. Equal amounts of sample protein were loaded onto 10% sodium dodecyl sulfate-polyacrylamide gel electrophoresis gels and transferred to polyvinylidene fluoride membranes at 200 mA for 90 min (Bio-Rad, Hercules, CA, USA). After transfer, the membranes were blocked for 1 h at room temperature in Tris-buffered saline supplemented with 0.1% Tween 20 and 5% bovine serum albumin. The membranes were incubated overnight with the following primary antibodies at 4°C: polyclonal SGLT-1 and GLUT-2 antibody (Calbiochem, San Diego, CA, USA), monoclonal COX5 antibody (Invitrogen, Camarillo, CA, USA); polyclonal antiserum specific for GLUT-4 was a generous gift from Mike Mueckler (Washington University, St. Louis, MO, USA). The membranes were then incubated with horseradish peroxidase-conjugated secondary antibody (goat anti-rabbit IgG or anti-mouse IgG; Jackson ImmunoResearch Laboratories, West Grove, PA, USA) at a concentration of 1:10,000. Bands were visualized by enhanced chemiluminescence (GE Healthcare Life Sciences, Buckinghamshire, UK) and quantified using densitometry. An equal loading control was performed by staining the blot with Coomassie Brilliant Blue [Citation12].
Insulin and glycogen measurements
The pancreas and plasma insulin concentration were measured by an enzyme-linked immunosorbent assay kit according to the manufacturer’s instructions (Shibayagi, Japan). For determination of the glycogen concentration, the gastrocnemius muscle samples were homogenized with 0.3 M perchloric acid, and the glycogen concentration was measured by enzymatic methods according to Lowry and Passoneau [Citation13] after acid hydrolysis.
Statistical analysis
Data are expressed as means ± standard errors of the mean. Statistical analyses were carried out using BellCurve for Excel (Social Survey Research Information). The OGTT and ITT data were evaluated by two-way analysis of variance (ANOVA) to examine the effects of time and dietary conditions. For the other experiments, statistical significance was assessed by Student unpaired t-test; p < 0.05 was considered statistically significant.
Results
Effect of LCHP on body weight, food intake, and epididymal fat, kidney, skeletal muscle, and liver weights
There were no significant differences in food intake and final body weight between the control and LCHP groups (). However, the epididymal fat weight in the LCHP group was significantly lower than that of the control group (p < 0.001). The kidney and liver weights were significantly higher in the LCHP group compared to those of the control group (, p < 0.001). Gastrocnemius muscle and pancreas weights did not differ between groups.
Table 2. Body weight, food intake and organ weight in mice.
OGTT
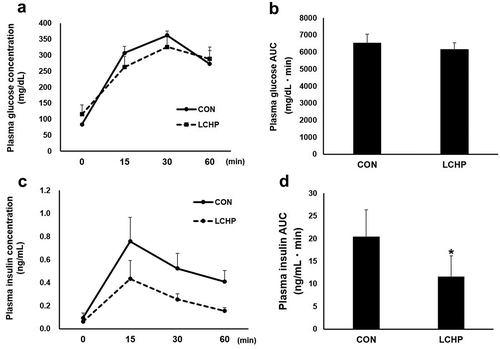
The plasma glucose and insulin concentrations before glucose administration (after 16-h fasting) did not significantly differ between the control and LCHP groups (). Moreover, there were no significant differences in plasma glucose levels detected during the OGTT or in the AUC for plasma glucose between the two groups (). The plasma insulin AUC in the LCHP group was significantly smaller than that observed for the control group (p < 0.01, ).
Figure 1. Effects of low-carbohydrate high-protein (LCHP) diet on plasma glucose (a) and insulin (c) levels in mice.
The area under the curve (AUC) values were calculated in accordance with the trapezoidal rule (b, d). Values are means ± SEM, n = 7–8. *p < 0.05 compared to the control (CON) group.
ITT, glucose transporter protein content, and glycogen concentration in the gastrocnemius muscle
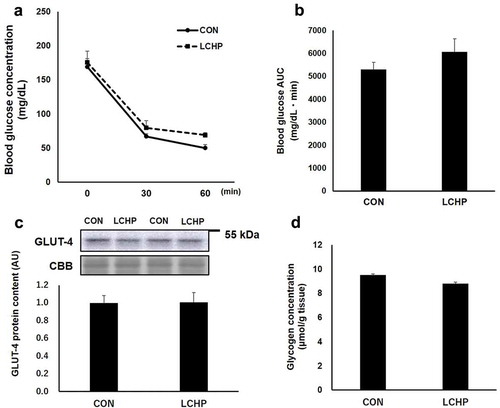
To further evaluate the effects of the LCHP diet on whole-body glucose metabolism, we additionally performed the ITT. As shown in , there was no difference in blood glucose levels after 6-h fasting or in the response to insulin administration. Moreover, there was no difference in the GLUT-4 protein content or glycogen concentration in the gastrocnemius muscles between groups ().
Figure 2. Effects of low-carbohydrate high-protein (LCHP) diet on blood glucose levels (a) in response to insulin administration in mice, and on the GLUT-4 protein concentration (c) and glycogen concentration (d) in the gastrocnemius muscle.
Values are means ± SEM, n = 7–8. A.U., arbitrary unit.
Glucose transporter protein content in the small intestine
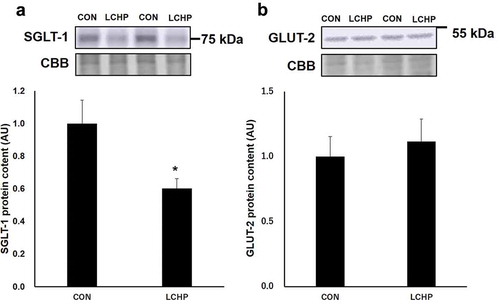
The SGLT-1 protein content in the jejunum was significantly lower in the LCHP group compared to that of the control group (, p < 0.05); however, there was no difference in the GLUT-2 protein content of the jejunum between groups ().
Figure 3. Effects of low-carbohydrate high-protein (LCHP) diet on SGLT-1 (a) and GLUT-2 (b) protein contents in the jejunum of mice.
Values are means ± SEM, n = 7–8. *p < 0.05 compared to the control (CON) group. A.U., arbitrary unit.
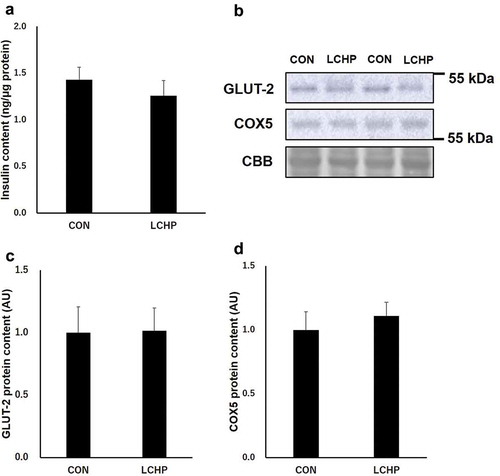
Insulin concentration and insulin secretion-related proteins in the pancreas
Since GLUT-2 and mitochondrial function play an essential role in glucose sensing and insulin secretion in the pancreas, we further analyzed the protein contents involved in pancreatic function [Citation5,Citation14]. There were no significant differences in the insulin and GLUT-2 protein contents in the pancreas between groups (). In addition, two-week LCHP diet did not affect the protein content of COX5, a subunit of mitochondrial ATP synthase ().
Figure 4. Effects of low-carbohydrate high-protein (LCHP) diet on insulin content (a), representative blots of GLUT-2 and COX5 (b), GLUT-2 (c), and COX5 (d) protein contents in the pancreas of mice.
Values are means ± SEM, n = 7–8. A.U., arbitrary unit.
Discussion
We demonstrated that the LCHP diet resulted in a markedly blunted insulin response to a glucose load in mice, suggesting that dietary intake of the LCHP diet increases insulin sensitivity. The skeletal muscle plays an important role in glucose disposal. Since the glucose transport capacity is linearly related to the GLUT-4 protein content in insulin-responsive tissues [Citation15], GLUT-4 is an important determinant of the whole-body glucose disposal. However, we did not detect an effect of the LCHP diet on the GLUT-4 protein content in the gastrocnemius muscle. Furthermore, the ITT revealed that 2-week LCHP feeding does not enhance insulin-stimulated glucose uptake in the peripheral tissues. Taken together, these results suggest that factors other than an increase in insulin sensitivity contribute to the observed blunted insulin response to a glucose load.
Previous studies reported that that low carbohydrate diet feeding results in decrease in Sglt-1 mRNA and protein content compared to those fed control or high carbohydrate diet [Citation16–Citation18]. Consistently, we found that the 2-week feeding of the LCHP diet induced substantial decrease in the SGLT-1 protein content in the mouse jejunum. SGLT-1 is expressed in the apical membrane and is responsible for the transport of glucose from the lumen into the epithelial cells [Citation19,Citation20], whereas GLUT-2 subsequently mediates glucose transport across the basolateral membrane into the interstitium and circulation [Citation9,Citation16]. Therefore, the blunted insulin response to a glucose load during the OGTT in the LCHP diet-fed mice seems to be due to a slower glucose absorption rate resulting from the diminished SGLT-1 content, rather than improvement in insulin sensitivity in the peripheral tissues. Although the SGLT-1 protein content of small intestine decreased in LCHP groups, there were no differences in plasma glucose levels during OGTT or in the AUC for plasma glucose between the groups (). Since the insulin secretion is higher in the CON group than that of LCHP group (), it is assumed that the glucose uptake by peripheral tissue is greater in the CON group during the OGTT. Therefore, it is plausible that similar glucose levels between two groups results from the high glucose disposal rate in the CON group due to higher secretion of insulin in response to glucose. Further studies using a tracer or everted gut sac technique are required to analyze the contribution of reduced SGLT-1 protein to the LCHP diet-induced blunted insulin response after a glucose load.
GLUT-2 plays an essential role in glucose sensing by pancreatic islets [Citation5]. In addition, intracellular ATP is required for insulin secretion [Citation14]. Thus, another possible explanation for the blunted insulin response to a glucose load is impairment of pancreas function due to the low carbohydrate intake. However, this seems unlikely since there was no effect of the LCHP diet on the protein contents of GLUT-2 and the ATP synthase subunit, nor were there differences in pancreas weight and insulin content in the pancreas.
Although we did not detect significant differences in the gastrocnemius muscle weight and its GLUT-4 protein content between the two diet groups, Kalyani et al. [Citation21] demonstrated that in humans, the blood glucose and insulin AUC values during an OGTT were inversely associated with the mid-thigh muscle cross-sectional area, suggesting that the muscle mass as well as the GLUT-4 protein content in the skeletal muscle are important determinants of human glucose homeostasis. However, feeding an LCHP diet to rodent for a few weeks also did not result in an increase in skeletal muscle mass in previous studies [Citation22,Citation23]. Although we only measured the skeletal muscle weight based on the gastrocnemius muscle, our results do not support that the LCHP diet improved glucose metabolism by inducing hypertrophy in the major muscles.
Although LCHP diets do appear to have beneficial effects on glucose homeostasis, their overall safety remains a subject of considerable debate. Impairments of hepatic and renal functions have been proposed as some of the suspected adverse effects of high-protein diets [Citation24,Citation25]. Indeed, we found that after only 2 weeks of feeding the LCHP diet, liver and kidney hypertrophy were induced in the mice. Lacroix et al [Citation26]. reported that rats fed a high-protein, moderate carbohydrate-restricted diet (50% from protein and 36% from carbohydrate [wt/wt]) showed no major alterations of liver or kidney functions. However, the functional consequences of the long-term intake of a diet containing more protein and less carbohydrate have not been fully explored. Thus, further research is required to examine the effects of LCHP diets on a broad range of parameters.
In conclusion, our findings show that the LCHP diet blunted the insulin response to a glucose load despite no improvement in peripheral insulin sensitivity. The reduction of SGLT-1 expression in the small intestine partially contributed to the effect of the LCHP on the insulin response.
Author contribution
KH, ST, NN designed and performed the experiments, analyzed the data, wrote the manuscript. XL, SI, NI, SK performed the experiments and analyzed data. KH, ST, NN, KH, ST and NN discussed the results, commented on the manuscript, and approved the manuscript submission.
Acknowledgments
We thank Seika Okimura for excellent technical assistance.
Disclosure statement
No potential conflict of interest was reported by the authors.
Additional information
Funding
References
- Gardner CD, Trepanowski JF, Del Gobbo LC, et al. Effect of low-fat vs low-carbohydrate diet on 12-month weight loss in overweight adults and the association with genotype pattern or insulin secretion: the DIETFITS randomized clinical trial. Jama. 2018 Feb 20;319(7):667–679.
- Naude CE, Schoonees A, Senekal M, et al. Low carbohydrate versus isoenergetic balanced diets for reducing weight and cardiovascular risk: a systematic review and meta-analysis. PLoS One. 2014;9(7):e100652.
- Gardner CD, Offringa LC, Hartle JC, et al. Weight loss on low-fat vs. low-carbohydrate diets by insulin resistance status among overweight adults and adults with obesity: A randomized pilot trial. Obesity (Silver Spring). 2016 Jan;24(1):79–86.
- Lobley GE, Bremner DM, Holtrop G, et al. Impact of high-protein diets with either moderate or low carbohydrate on weight loss, body composition, blood pressure and glucose tolerance in rats. Br J Nutr. 2007 Jun;97(6):1099–1108.
- Guillam MT, Dupraz P, Thorens B. Glucose uptake, utilization, and signaling in GLUT2-null islets. Diabetes. 2000 Sep;49(9):1485–1491.
- Holloszy JO. Exercise-induced increase in muscle insulin sensitivity. J Appl Physiol (1985). 2005 Jul;99(1):338–343.
- Krook A, Wallberg-Henriksson H, Zierath JR. Sending the signal: molecular mechanisms regulating glucose uptake. Med Sci Sports Exerc. 2004 Jul;36(7):1212–1217.
- Thorens B. GLUT2, glucose sensing and glucose homeostasis. Diabetologia. 2015 Feb;58(2):221–232.
- Gorboulev V, Schurmann A, Vallon V, et al. Na(+)-D-glucose cotransporter SGLT1 is pivotal for intestinal glucose absorption and glucose-dependent incretin secretion. Diabetes. 2012 Jan;61(1):187–196.
- Roder PV, Geillinger KE, Zietek TS, et al. The role of SGLT1 and GLUT2 in intestinal glucose transport and sensing. PLoS One. 2014;9(2):e89977.
- Li X, Higashida K, Kawamura T, et al. Time course of decrease in skeletal muscle mitochondrial biogenesis after discontinuation of high-fat diet. J Nutr Sci Vitaminol (Tokyo). 2018;64(3):233–238.
- Welinder C, Ekblad L. Coomassie staining as loading control in Western blot analysis. J Proteome Res. 2011 Mar 4;10(3):1416–1419.
- Lowry OH, Passonneau JV. A flexible system of enzymatic analysis. Vol. 25 (9). New York: Academic Press; 1973. p. 322.
- Vallar L, Biden TJ, Wollheim CB. Guanine nucleotides induce Ca2+-independent insulin secretion from permeabilized RINm5F cells. J Biol Chem. 1987 Apr 15;262(11):5049–5056.
- Henriksen EJ, Bourey RE, Rodnick KJ, et al. Glucose transporter protein content and glucose transport capacity in rat skeletal muscles. Am J Physiol. 1990 Oct;259(4 Pt 1):E593–8.
- Gouyon F, Caillaud L, Carriere V, et al. Simple-sugar meals target GLUT2 at enterocyte apical membranes to improve sugar absorption: a study in GLUT2-null mice. J Physiol. 2003 Nov 1;552(Pt 3):823–832.
- Inoue S, Mochizuki K, Goda T. Jejunal induction of SI and SGLT1 genes in rats by high-starch/low-fat diet is associated with histone acetylation and binding of GCN5 on the genes. J Nutr Sci Vitaminol (Tokyo). 2011;57(2):162–169.
- Moran AW, Al-Rammahi MA, Arora DK, et al. Expression of Na+/glucose co-transporter 1 (SGLT1) in the intestine of piglets weaned to different concentrations of dietary carbohydrate. Br J Nutr. 2010 Sep;104(5):647–655.
- Lee WS, Kanai Y, Wells RG, et al. The high affinity Na+/glucose cotransporter. Re-evaluation of function and distribution of expression. J Biol Chem. 1994 Apr 22;269(16):12032–12039.
- Vrhovac I, Balen Eror D, Klessen D, et al. Localizations of Na(+)-D-glucose cotransporters SGLT1 and SGLT2 in human kidney and of SGLT1 in human small intestine, liver, lung, and heart. Pflugers Arch. 2015 Sep;467(9):1881–1898.
- Kalyani RR, Metter EJ, Ramachandran R, et al. Glucose and insulin measurements from the oral glucose tolerance test and relationship to muscle mass. J Gerontol A Biol Sci Med Sci. 2012 Jan;67(1):74–81.
- Nakazato K, Hirose T, Song H. Increased myostatin synthesis in rat gastrocnemius muscles under high-protein diet. Int J Sport Nutr Exerc Metab. 2006 Apr;16(2):153–165.
- Tirapegui J, Ribeiro SM, Pires IS, et al. Effects of two different levels of dietary protein on body composition and protein nutritional status of growing rats. Nutrients. 2012 Sep;4(9):1328–1337.
- Kostogrys RB, Franczyk-Zarow M, Maslak E, et al. Effect of low carbohydrate high protein (LCHP) diet on lipid metabolism, liver and kidney function in rats. Environ Toxicol Pharmacol. 2015 Mar;39(2):713–719.
- Monteiro ME, Xavier AR, Oliveira FL, et al. Apoptosis induced by a low-carbohydrate and high-protein diet in rat livers. World J Gastroenterol. 2016 Jun 14;22(22):5165–5172.
- Lacroix M, Gaudichon C, Martin A, et al. A long-term high-protein diet markedly reduces adipose tissue without major side effects in Wistar male rats. Am J Physiol Regul Integr Comp Physiol. 2004 Oct;287(4):R934–42.