
ABSTRACT
Plasmalogen (Pls) is a glycerophospholipid derived from alkyl phospholipid (Alk) with antioxidant functions in vivo. The present study investigated the effects of ether phospholipids, such as Pls and Alk, on intercellular lipid barriers in the skin of NC/Nga mice, a model of atopic dermatitis (AD). NC/Nga mice fed Alk showed increased plasma levels of Alk and Pls. The AD-related changes in ceramide composition in the skin were abrogated by oral administration of Alk. Moreover, Alk suppressed skin inflammation in AD mice. These results indicate that Alk partially fortifies the stratum corneum lipid barrier and may be an effective treatment for AD.
Abbreviations: Pls: plasmalogen; PlsCho: choline plasmalogen; PlsEtn: ethanolamine plasmalogen; Alk: alkyl phospholipid; TJ: tight junction; FA: fatty acid; AD: atopic dermatitis; SO: soybean oil; FO: fish oil; DHA: docosahexaenoic acid; EPA: eicosapentaenoic acid; TG: triglyceride; PL: phospholipid; RF: retention factor; AlkCho: choline-type alkyl phospholipid; AlkEtn: ethanolamine-type alkyl phospholipid; LC-MS/MS: liquid chromatography-tandem mass spectrometry; FAR1: fatty acyl-coenzyme (Co)A reductase 1
Graphical Abstract
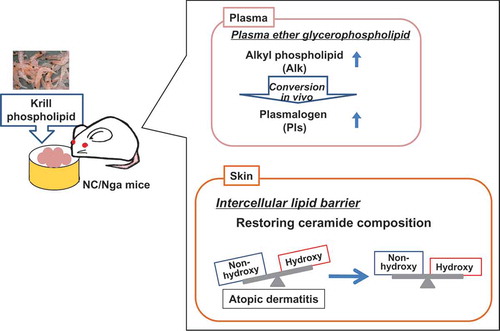
Feeding of phospholipid-enriched alkyl phospholipid from krill increases plasma ether phospholipid, and strengthens intercellular lipid barriers in NC/Nga mice.
Plasmalogen (Pls; 1-O-alk-1ʹ-enyl-2-acyl glycerophospholipids) is a subclass of glycerophospholipids that are characterized by a vinyl-ether bond at the sn-1 position of the glycerol backbone. Pls are mainly classified into either choline Pls (PlsCho) or ethanolamine Pls (PlsEtn) based on the polar head group at the sn-3 position [Citation1] and are synthesized via alkyl phospholipid (Alk; 1-O-alkyl-2-acyl-glycerophospholipid), which has an ether bond at the sn-1 position. Alk and Pls are collectively referred to as ether glycerophospholipids. Pls is thought to protect cells from oxidative stress as a result of the sensitivity of the vinyl-ether bond to reactive oxygen species [Citation2]. Increased levels of Pls in the serum have been suggested to be effective for preventing diseases such as arteriosclerosis [Citation3,Citation4] and Alzheimer’s disease [Citation5,Citation6].
The skin is a tissue that covers the outer surface of the body, protects organisms from the external environment, and prevents excessive moisture loss. The epidermis is the outermost layer of skin that consists of three layers of superficial stratum (corneum, granulosum, and spinosum), and the deeper stratum basal. Tight junction (TJ) protein complexes within the stratum granulosum and the intercellular lipid barrier in the stratum corneum build up the functional barrier of the skin [Citation7–Citation9]. The lipids in the intercellular lipid barrier are constituted mainly by ceramides (~50%), cholesterol (~25%), and free fatty acids (free FA; ~15%) [Citation10].
Atopic dermatitis (AD), a chronic inflammatory skin disease and type of allergy caused by dysfunction of the skin’s barrier function, affects over 15% of children in developed countries [Citation11,Citation12], although the precise cause of AD is not well understood. AD patients exhibit abnormalities in the skin intercellular lipid composition, including reduced FA chain length [Citation13] and changes in the composition and amount of ceramide subclasses [Citation14] as well as in the distribution of chain length in ceramides [Citation7,Citation13], suggesting that maintenance of the correct intercellular lipid balance is essential for the barrier function of the skin. A recent study showed that dietary supplementation of FA alleviated AD-like skin lesions in a mouse model of AD by increasing claudin-1 mRNA and protein expression [Citation15].
Exposure to ultraviolet light (UV) radiation can cause oxidative stress and inflammation in the skin. The skin has high concentrations of Pls; we previously demonstrated that these levels were increased by UV irradiation in rats, which suggests that Pls is an endogenous defense factor that protects the skin against oxidative stress (data not shown). In this study, we speculated that dietary Pls supplementation could inhibit inflammation associated with AD by strengthening the skin’s barrier function, particularly the intercellular lipid barriers. We tested this hypothesis using NC/Nga mice, a widely used model of AD. However, since Pls is easily oxidized and therefore unsuitable for ingestion, we attempted to increase Pls intake by supplementing the mouse diet with Alk – the precursor of Pls – from krill, which has relatively high concentrations of the precursor.
Methods
Preparation of phospholipid-enriched alkyl phospholipid from krill
Frozen boiled krill product (krill CPM-MD) derived from Antarctic krill (Euphausia superba) was purchased from ADEKA Fine Foods Co., Ltd. (Tottori, Japan). A hexane/ethanol solvent mixture (60:40, 108 L) was added to the frozen boiled krill (approximately 30 kg). After stirring for 10 min, the upper layer (hexane layer) containing the lipid was collected as an extract. Further, hexane was added to the lower layer and the filtration residue, and the same operation was repeated to recover the extract. The obtained extracts were mixed, and the solvent was allowed to evaporate. As a 1-alkyl ether-type phospholipid-containing lipid, 1.1 kg of krill oil was obtained.
We used Phospholipase A1 (Mitsubishi Chemical Foods Co., Ltd., Tokyo, Japan) to increase the yield of alkyl phospholipids. Phospholipase A1 hydrolyzes the ester-bond in sn-1 position to yield FA and lyso-phospholipid, but does not hydrolyze the ether-bond in the sn-1 position. During the reaction, the diacyl type phospholipid is decomposed while the 1-alkyl ether type phospholipid is preserved. Phospholipase A1 (50 kU) was dissolved in 100 mL of 0.2 M acetate buffer (pH 5.0). The enzyme solution of phospholipase A1 was added to 1 kg of the krill oil, and the mixture was reacted by stirring at 40 °C for 1 h. A mixture of hexane, ethanol, and water (9 L; 80: 14: 6) was added. The mixture was stirred for 10 min, and the upper layer was recovered. Hexane (7 L) was added to the residual lower layer and stirred for 10 min; the upper layer was subsequently collected. The same operation was repeated and the upper layer was collected. The obtained extracts were combined, and the mixed solvent was allowed to evaporate. 975 g of residue was obtained.
In a mixture of hexane/ethanol (300 mL; 80:20), 200 g of the obtained residue was dissolved. The solution was added to a glass column (100 cm × 3 cm) packed with 400 g of silica gel (Wakosil C-200, Wako Pure Chemical Industries, Osaka, Japan) suspended in a mixed solvent of hexane/ethanol (80:20). A solvent mixture of hexane/ethanol (4 L; 80: 20) was passed through to elute neutral lipids. Thereafter, ethanolamine phospholipid was eluted by passing 8 L of ethanol. Next, 11 L of an ethanol/water (80:20) solvent mixture was passed through to elute choline phospholipid. The eluate was concentrated with an evaporator to obtain 7.2 g of a lipid fraction containing 1-alkyl ether type phospholipid (alkyl PL). The alkyl PL concentration and fatty acid composition were analyzed by high-performance liquid chromatography (HPLC) using an evaporative light scattering detector (ELSD) and gas chromatography, respectively, as described previously [Citation16]. Distribution of molecular species in the sn-2 positions of choline Alk in alkyl PL was determined by liquid chromatography-tandem mass spectrometry (LC-MS/MS) as described below. The distributions are shown in .
Table 1. Composition of test lipids (a) and molecular species at the sn-2 position of krill alkylphospholipid (b).
Animals and diet
Male NC/Nga (Clean) mice infected with Myobia musculi (Experiment 1 and 2) and NC/NgaSlc (SPF, Experiment 2) mice (7 weeks old) were purchased from Japan SLC (Hamamatsu, Japan). Mice were individually housed in cages under controlled temperature (20–24 °C), relative humidity (40–60%), and lighting (light: 08:00–20:00) during the study, and had free access to water and a standard diet (AIN-93G formula; ) during the 1-week acclimation period. Body weight and food consumption were measured every second day, always at the same time of the day. All animal studies were pre-approved by the Animal Committee of Iwate University, and the mice were maintained in accordance with the Iwate University guidelines for the care and use of laboratory animals (approval no. A201427).
Table 2. Composition of test diets.
In Experiment 1 (analysis of TJ proteins), NC/Nga (Clean) mice in which AD was induced by M. musculi infection (AD group) were divided into three groups (n = 7 each). The control group was fed a standard diet containing 7 % soybean oil (SO); the Alk and fish oil (FO) groups were fed diets in which the SO was partially replaced with alkyl phospholipid or FO, respectively. The composition of each diet is shown in . Mice were fed with the test diet for 3 weeks. At the end of the experiment, plasma, dorsal skin, and spleen samples were collected under pentobarbital anesthesia and stored at −80 °C until analysis.
In Experiment 2 (analysis of lipids), NC/Nga (Clean) mice in which AD was induced by M. musculi infection (AD group) were divided into three groups. The control group (n = 8) was fed a standard diet containing 7 % SO, and the Alk (n= 8) and FO (n = 7) groups were fed diets in which the SO was partially replaced with alkyl phospholipid or FO, respectively. The composition of each diet is shown in . Mice in the normal group (NC/NgaSlc, non-onset AD) (n= 6) were given a standard diet. At appropriate time points, inflammation was evaluated. The mice were fed the test diets for 5 weeks. At the end of the experiment, plasma, dorsal skin, and spleen samples were collected under pentobarbital anesthesia and stored at −80 °C until analysis.
For the Alk, we used krill phospholipid extracted from Antarctic krill (Euphausia superba) and purified with silica columns as described above. The choline-type Alk concentration was 28.8% after purification and concentration; the FA composition was as follows: 24.6%, docosahexaenoic acid (DHA); 42.0%, eicosapentaenoic acid (EPA); 8.9%, others. The diets of the Alk and FO groups contained the same amounts of DHA and EPA ( and ). The molar ratios of fatty acids in the injected lipids, which were derived from sn-2 in the Alk, were as follows: 39.9%, DHA; 51.2%, EPA; 8.9%, others.
Immunoblot analysis
Expression of claudin-1, occludin, and junctional adhesion molecule (JAM)-A proteins in the dorsal skin of mice was determined by immunoblotting as described previously [Citation15]. Protein levels were quantified by densitometric analysis using ImageJ software (National Institutes of Health, Bethesda, MD, USA).
Inflammatory scores
Ear thickness was measured once a week using digital calipers (Niigata Seiki Co., Sanjo, Japan). Scratching behavior was monitored daily at 10:00–12:00 over the 28-day experimental period by counting the scratching frequency for 10 min for each mouse. The observations were made by researchers who were blinded to the experimental groups. Each mouse was observed three times by different researchers, and the data represent the average of the three counts. Transepidermal water loss (TEWL) was measured in the dorsal skin using an MPA 580 cutometer (Courage & Khazaka Electronic GmbH, Cologne, Germany) according to the manufacturer’s protocol. Measurements were made when the readings stabilized 20 s after the probe was placed on the skin. TEWL was automatically calculated and is expressed in g/m2/h. Plasma immunoglobulin (IgE) levels were measured by sandwich enzyme-linked immunosorbent assay (Yamasa Soy Sauce Co., Choshi, Japan).
Lipid extraction
Total lipid in the skin was extracted from the skin using chloroform/methanol (1:2 v/v) after freeze-drying. Total lipid in the plasma was extracted by the Bligh & Dyer method [Citation17]. All reagents were from Wako Pure Chemical Industries (Osaka, Japan).
Lipid analysis
Total cholesterol and free FA in the skin lipid extract were measured using a commercial enzyme kit (Wako Pure Chemical Industries). Plasma cholesterol, free FA, and triglyceride (TG) levels were measured in the same manner.
Total phospholipid (PL) concentration in the lipid extract was measured using a modified version of the Bartlett method [Citation18] as previously described [Citation19].
Ceramide levels in the skin were measured by thin layer chromatography on chromarods with flame ionization detection (FID) using an Iatroscan MK-6 instrument (Mitsubishi Chemical Yatron, Tokyo, Japan). The skin lipid extract was spotted on a silica gel-coated Chromarod-SIII (Mitsubishi Chemical Yatron, Tokyo, Japan) using a microsyringe. The rods were developed twice consecutively: (i) with chloroform up to 13 cm; and (ii) with chloroform-methanol-acetic acid 190:9:1 (v/v/v) up to 5 cm. After drying, the rods were processed by FID with a hydrogen flow of 150–160 mL/min, air flow of 2.0 L/min, and scanning speed 30 s/scan. Calibration curves were generated with commercial lipids including non-hydroxyceramide (retention factor [RF] = 0.37) and hydroxyceramide (RF = 0.29) (Matreya LLC, State College, PA, USA). Chromatographic data were processed with SIC 4480 II v.1.3 software (System Instruments Corp., Tokyo, Japan).
Pls and Alk levels in plasma and skin were determined by liquid chromatography-tandem mass spectrometry (LC-MS/MS) as previously described [Citation3,Citation19]. Briefly, LC separation was performed using an Accela UPLC system (Thermo Fisher Scientific, Waltham, MA, USA) with a BEH C8 column (1.7 μm, 2.1 mm × 100 mm; Waters Corp., Milford, MA, USA), MS was performed using a TSQ Quantum Access Max instrument (Thermo Fisher Scientific) equipped with a heated electrospray ionization probe in positive ion mode. Data were acquired with Xcalibur v.1.3 software (Thermo Fisher Scientific). Synthetic 18:0–18:1 and 18:0–20:4 of PlsCho and PlsEtn, as well as 16:0–18:1 and 16:0–20:4 choline-type alkyl phospholipids (AlkCho) (Avanti Polar Lipids, Alabaster, AL, USA) were used to generate a standard curve to quantify individual species of ether glycerophospholipids. Synthetic 16:0–18:1 ethanolamine-type alkyl phospholipids (AlkEtn), synthesized enzymatically from the corresponding AlkCho by exchanging choline with ethanolamine, were used to generate a standard curve to quantify AlkEtn species. The concentrations of individual ether glycerophospholipid species were determined using corresponding internal standards (dimyristoyl L-α-phosphatidylcholine for PlsCho and AlkCho and dimyristoyl L-α-phosphatidylethanolamine for PlsEtn and AlkEtn; Avanti Polar Lipids). The numbers of molecular species recorded were 24 and 30 for each class of Alk and Pls, respectively.
Statistical analysis
Data are expressed as means with their standard errors. Differences between groups were evaluated by one-way analysis of variance followed by comparisons of all pairs using Tukey-Kramer HSD (honestly significant difference). Correlations were assessed using the Pearson’s product-moment correlation coefficient. A P value < 0.05 was considered significant. Statistical analyses were performed using JMP13.2 software.
Results
Growth parameters and plasma lipid levels (Experiment 1 and 2)
In Experiment 1, NC/Nga mice with AD were fed the test diets for 3 weeks. There were no significant differences in average daily food intake, final body weight, and spleen weight among groups (data not shown).
In Experiment 2, the induction of AD decreased body weight and increased spleen weight in mice. There were no differences in average daily food intake or final body weight among mice with AD (). Although plasma cholesterol concentration was lower in the AD than in the normal group, there were no differences in the concentrations of other plasma lipids. In AD mice, plasma concentrations of cholesterol, TG, and free FA were unaffected by diet.
Table 3. Growth parameters and plasma lipids (cholesterol, triglyceride, free fatty acid) in NC/Nga mice fed test diets for 5 weeks (Experiment 2).a
Inflammation score (Experiment 1)
There were no significant differences between groups in plasma IgE levels and frequency of scratches (,)). However, Alk intake decreased skin TEWL significantly and tended to decrease ear thickness (P = 0.052) relative to the control group (,)).
Figure 1. Inflammation scores for NC/Nga mice fed test diets for 3 weeks in Experiment 1. Test diets were standard (for control), Alk, and FO. Values are means (n = 7 mice per group), with their standard errors represented by vertical bars. Different superscript letters indicate significant differences at P < 0.05. (a) Plasma IgE; (b) scratch frequency; (c) TEWL; (d) ear thickness.
TJ protein expression (Experiment 1)
There were no significant differences between groups in TJ protein levels ().
Figure 2. Immunoblot analysis of TJ proteins in the dorsal skin in NC/Nga mice fed test diets for 3 weeks in Experiment 1. Test diets were standard (for control), Alk, and FO. Values are means (n = 7 mice per group), with their standard errors represented by vertical bars. Different superscript letters indicate significant differences at P < 0.05.
Inflammation score (Experiment 2)
Plasma IgE level, scratching behavior, and TEWL were increased in AD mice. However, there were no significant differences between AD groups by diet (–c)). Ear thickness was measured weekly; the thickness increased with AD development each week except at week 5, but was unaffected by diet among AD groups (data not shown). At week 5 (final week of the experiment), there were no significant differences between mice on the Alk and FO diets and those on the control diet.
Figure 3. Inflammation scores for NC/Nga mice fed test diets for 5 weeks in Experiment 2. Test diets were standard diet (for normal and control), Alk, and FO. Normal is non-onset AD, and others are AD induced by infection with M. musculi. Values are means (n = 6–8 mice per group), with their standard errors represented by vertical bars. Different superscript letters indicate significant differences at P < 0.05. (a) Plasma IgE; (b) scratch frequency; (c) TEWL; (d) ear thickness.
Ether glycerophospholipids in plasma (Experiment 2)
Data are presented in the graph following the order of the metabolic pathway – i.e., AlkCho, AlkEtn, PlsEtn, and PlsCho. Plasma concentrations of each class of Alk and Pls are shown in . Plasma concentrations of total Pls (PlsCho+PlsEtn) and phospholipids and their fractions (mole percent) of total phospholipids (PlsCho/phospholipid, PlsEtn/phospholipid, total Pls/phospholipid) are summarized in . Concentrations of plasma AlkCho, AlkEtn, and PlsEtn were increased in the Alk diet group compared with the control and FO groups. However, PlsCho level was not influenced by ingestion of Alk. PlsEtn, PlsCho, and total Pls concentrations were lower in the control than in the normal group. The total amount of phospholipid decreased with AD development but was unaffected by diet (). The proportion of total Pls in total plasma phospholipids was reduced in the control as compared to the normal group. On the other hand, the proportions of PlsCho, PlsEtn, and total Pls in total phospholipids were increased in the Alk as compared to the control group.
Table 4. Plasma plasmalogen-related parameters and total phospholipid concentration in NC/Nga mice fed test diets for 5 weeks (Experiment 2).a
Figure 4. Plasmalogen and alkyl phospholipid concentration in plasma of NC/Nga mice fed test diets for 5 weeks in Experiment 2. Test diets were standard diet (for normal and control), Alk, and FO. Normal is non-onset AD, and others are AD induced by infection with M. musculi. Values are means (n = 6–8 mice per group), with their standard errors represented by vertical bars. Different superscript letters indicate significant differences at P < 0.05. AlkCho: choline alkylphospholipids; AlkEtn: ethanolamine alkylphospholipids; PlsEtn: ethanolamine plasmalogen; PlsCho: choline plasmalogen.
Ether glycerophospholipids in the skin (Experiment 2)
The distribution of molecular species in the sn-2 position of ether glycerophospholipids and the amount of total phospholipids in the skin are shown in . Levels of all of the ether glycerophospholipids examined (AlkCho, AkEtn, PlsEtn, and PlsCho) were increased in the skin with the development of AD. In these mice, ingestion of Alk significantly increased the amount of AlkEtn ()). Total phospholipid level in the skin was increased in the AD as compared to the normal group (). The fraction of AlkCho species with 20:5 and 22:6 at sn-2 was higher in the Alk than in the control group ()). On the other hand, the concentration of AlkCho at 20:4 at sn-2 was tendency lower in the Alk than in the control group (P= 0.066). Similar changes in these AlkCho species were observed in the FO group. However, AlkCho containing 20:5 was higher in the Alk than in the FO group. The fractions of AlkEtn species with 20:5 and 22:6 at sn-2 were increased in the Alk group, whereas that of species with 20:4 was unchanged ()). For both Cho and Etn-type Pls, molecular species with 20:5 and 22:6 at sn-2 were increased in the Alk and FO groups as compared to the control group. Thus, although similar changes in nearly all Pls species were observed in the Alk and FO groups, the amount of Pls containing 20:4 at sn-2 was lower in the former than in the latter. The number of species containing 22:4 at sn-2 in all ether glycerophospholipids was decreased in the Alk and FO groups relative to the controls. In addition, the number of molecular species containing 18:1 and 18:2 in AlkCho, AlkEtn, and PlsCho was increased in the control as compared to the normal group (,,)). However, PlsEtn containing 18:1 was unchanged with the development of AD ()).
Figure 5. Distribution of molecular species at the sn-2 position of (a) choline alkylphospholipid (AlkCho), (b) ethanolamine alkylphospholipid (AlkEtn), (c) ethanolamine plasmalogen (PlsEtn), and (d) choline plasmalogen (PlsCho) in the dorsal skin of NC/Nga mice fed test diets for 5 weeks in Experiment 2. Test diets were standard diet (for normal and control), Alk, and FO. Normal is non-onset AD, and others are AD induced by infection with M. musculi. Values represent skin concentrations of FAs at the sn-2 position of individual ether glycerophospholipids and are means (n = 6–8 mice per group), with their standard errors represented by vertical bars. Different superscript letters indicate significant differences at P < 0.05.
Figure 6. Total phospholipid concentration in the dorsal skin of NC/Nga mice fed test diets for 5 weeks in Experiment 2. Test diets were standard diet (for normal and control), Alk, and FO. Normal is non-onset AD, and others are AD induced by infection with M. musculi. Values are means (n = 6–8 mice per group), with their standard errors represented by vertical bars. Different superscript letters indicate significant differences at P < 0.05.
Intercellular lipid barrier (Experiment 2)
The intercellular lipid barrier of the stratum corneum consists mainly of cholesterol, free FA, and ceramide. Free FA levels in the skin changed with AD development but were unaffected by diet (,)). Ceramides in the skin were classified into two types. Both levels of non-hydroxyceramides and hydroxyceramides showed no significant difference between the control and normal groups (,)); however, the relative changes occurred in opposite directions. In mice with AD, levels of non-hydroxyceramides were decreased in the Alk group compared with the control group. Levels of both non-hydroxyceramides and hydroxyceramides in the Alk group were similar to those in the normal group. No such changes were observed in the FO group.
Figure 7. Levels of intercellular lipid in the dorsal skin of NC/Nga mice fed test diets for 5 weeks in Experiment 2. Test diets were standard diet (for normal and control), Alk, and FO. Normal is non-onset AD, and others are AD induced by infection with M. musculi. Values are means (n = 6–8 mice per group), with their standard errors represented by vertical bars. Different superscript letters indicate significant differences at P< 0.05. (a) Total cholesterol; (b) FFA; (c) non-hydroxyceramide; (d) hydroxyceramide.
Correlation between plasma ether glycerophospholipid and skin ceramide levels (Experiment 2)
There was a significant positive correlation between total plasma Pls and skin hydroxyceramide concentrations in AD mice ()). The same result was obtained even when data for the normal group were included in the analysis (data not shown, P = 0.002, r = 0.543, n = 29). In addition, total plasma Alk concentration was positively correlated with skin hydroxyceramide content in AD groups ()) as well as in all the group including the normal group (data not shown, P = 0.021, r = 0.425, n = 29). However, there was no correlation between total plasma phospholipid and skin hydroxyceramide concentrations between the AD groups (r = 0.367; )). The molecular species containing 22:6 at sn-2 position in both Alk and Pls in the plasma positively correlated with skin hydroxyceramide content in AD groups. Moreover, for Alk, those containing 18:1, 18:2, 20:4 and 20:5 at sn-2 position in Alk in the plasma positively correlated with skin hydroxyceramide content in AD groups (Figures S1 and S2).
Figure 8. The relationship between levels of skin hydroxyceramide and total plasmalogens (a), total alkyl phospholipid (b), and total phospholipid (c) in the plasma of NC/Nga mice fed test diets for 5 weeks in Experiment 2. Values (r) represent Pearson’s product–moment correlation coefficient.
Discussion
The prevalence of allergic disease including AD has drastically increased in recent decades. This study is the first to demonstrate that dietary supplementation with Alk – the precursor of Pls – alleviates AD in a mouse model. Although the molecular basis for the anti-allergic effects of ether phospholipids is unclear, it may involve the modulation of skin intercellular lipids such as ceramide.
Final body weight was lower in mice with AD than in the normal group, despite no obvious differences in food intake (). Reduced food intake and body weight has been reported in NC/Nga mice with AD by picryl chloride-induced AD [Citation20], which may be explained by changes in energy metabolism caused by impaired hepatic lipid and glucose metabolism. Meanwhile, among AD groups fed different diets, there were no differences in food intake, final body weight, and plasma lipid content, except for ether phospholipids.
We expected that Alk or FO diet would decrease ear weight and suppress inflammation. Protectins and resolvins synthesized from DHA and EPA play an essential role in the resolution of inflammation [Citation21,Citation22]. However, in this study, there were no apparent differences in the markers of inflammation, such as ear thickness, scratch number, and plasma IgE levels. In addition, in the present study, the amounts of DHA and EPA were the same in the FO and Alk diets. In the former, DHA and EPA are bound to the triglyceride, whereas in the latter they are bound to phospholipids derived from krill Alk. In this study, the ω3 FA source played no role with regard to the degree of inflammation in AD mice.
TEWL was reduced by ingestion of Alk in Experiment 1 ()), but this was not observed in Experiment 2 ()). Moreover, this decrease was only detected in mice fed Alk and not in those fed FO. The reason for these conflicting results could be the different lengths of the feeding period (3 and 5 weeks in Experiments 1 and 2, respectively), since the pathogenesis of AD is complex and involves a variety of immunological factors including an imbalance in T cell subsets such as helper T (Th)1, Th2, and Th17 cells and regulatory T cells [Citation23].
Plasma AlkCho level was increased in mice fed the Alk diet (); this was likely caused by absorption of AlkCho in the small intestine. In addition, plasma Pls level was higher in the Alk as compared to other groups, suggesting that ingested AlkCho was converted to Pls in the small intestine, liver, or other organs. It is generally acknowledged that ether phospholipid is synthesized and metabolized in the following order in vivo: AlkCho, AlkEtn, PlsEtn, and PlsCho. In this study, an increase in plasma PlsEtn but not PlsCho was observed in the Alk as compared to the control group, suggesting that the conversion of PlsEtn to PlsCho is a rate-limiting step that is tightly regulated in vivo.
Pls concentration and the proportion of Pls in total phospholipid (PlsCho + PlsEtn/phospholipid) in plasma decreased with AD development (). However, this was abrogated by Alk intake. We previously reported that patients with metabolic syndrome had lower PlsCho and higher phospholipid levels than healthy subjects, resulting in a reduction in PlsCho/phospholipid and PlsEtn/phospholipid ratios [Citation4]. The proportion of Pls in total phospholipid is associated with atherogenic status and aging [Citation3]. Thus, improvement of Pls to phospholipid ratio by ingestion of Alk might be able to alleviate the symptoms and progression of oxidative stress-related diseases.
Pls and Alk concentrations in skin increased with AD development, while no increase in Pls was observed as a result of Alk intake (). Pls content in tissue is controlled by various enzymes including fatty acyl-coenzyme (Co)A reductase (FAR)1; the rate-limiting step of ether lipid synthesis is the generation of fatty alcohol by FAR1, which preferentially reduces C16 and C18 fatty acyl-CoAs. FAR1 activity is regulated by cellular Pls levels, which induce FAR1 protein degradation [Citation24]. Our observation that Pls level in the skin was elevated in AD mice may be explained by the impairment of Far1 feedback due to inflammation. Moreover, the levels of total phospholipids in skin increased. These results suggest that not only Pls metabolism but also other phospholipid metabolism paths in the skin are enhanced by AD. In our previous study, Pls level in the skin was increased by UV irradiation, which causes oxidative stress. Skin is subjected to endogenous (e.g., cytokine) and exogenic (e.g., pruritus) stressors; additional studies are required to determine whether different types of stress affect skin Pls and phospholipid metabolism.
Various polyunsaturated FAs occupy the sn-2 position of Pls [Citation1], which is thought to act as a storage molecule for these FAs. The ω3 FAs such as DHA and EPA inhibit inflammation by competing with arachidonic acid [Citation25]. In this study, the amounts of 20:5 (EPA) and 22:6 (DHA) at the sn-2 position of Pls were increased in Alk and FO groups, whereas the amount of 20:4 (arachidonic acid) at this position was decreased in the Alk group. This implies that Alk alleviates inflammation as compared to FO by reducing the amount of Pls bound by arachidonic acid.
We investigated the effect of Alk ingestion on these skin TJ barriers in AD model mice by evaluating the expression of TJ proteins (). Some studies have shown that impaired epidermal TJ function caused by a reduction in claudin-1 underlies barrier defects in AD patients [Citation26,Citation27]. However, there were no differences in TJ protein levels in the dorsal skin of mice fed Alk or FO diets.
Ceramides are the most crucial sphingolipids in the epidermis, accounting for about 50% of the intercellular stratum corneum lipids; they are composed of a sphingoid base and an FA chain [Citation10]. About 342 ceramide species divided into 11 classes have been identified to date [Citation28]. Due to the difficulty in measuring all the different ceramide species, we measured those bound to non-hydroxy and hydroxy FAs. Alk intake set a balance between non-hydroxyceramides and hydroxyceramides close to the normal value (,d)). This result implies that the skin ceramide composition was altered by AD, but this effect could be reversed by Alk. Interestingly, this was not observed in the FO group, indicating that changes in ceramide composition are influenced by ether glycerophospholipids but not ω3-type FAs. The level of N-lignocerylsphingosine ceramide – a non-hydroxyceramide containing sphingosine with 34 carbon atoms – was found to be elevated in the skin of AD patients [Citation29]. Hydroxyceramide can be classified as α and ω types, which are present at different levels in the skin of AD patients [Citation14]. Future studies should investigate the skin composition of ceramide subclasses.
A significant positive correlation was observed between plasma concentrations of ether glycerophospholipids and hydroxyceramide levels in the skin (, S1 and S2). This result suggests that the increase in plasma ether glycerophospholipids induced by Alk intake affected hydroxyceramide metabolism in the skin. Ceramides synthesized in keratinocytes are stored as precursors such as sphingomyelin or glucosylceramide in lamellar bodies [Citation30,Citation31]. Upon release into the stratum corneum, sphingomyelin and glucosylceramide are converted into ceramide by sphingomyelinase or β-glucocerebrosidase, respectively [Citation7]. Moreover, it was reported that the activation of sphingomyelin and glucosylceramide deacylase, which deacylates glucosylceramide or sphingomyelin, generates glucosylsphingosine and sphingosylphosphorylcholine, respectively, thereby shifting the balance of ceramide in the skin [Citation32]. Instead, it leads to a decrease in ceramide level that compromises the skin’s barrier function in AD [Citation33]. Also, pro-inflammatory cytokines may alter the activity of ceramide-metabolizing enzymes and consequently, the ceramide composition of skin [Citation34]. Our findings suggest that these enzymes and cytokines in the skin and plasma of AD mice were affected by ether glycerophospholipids.
The results of this study demonstrate that Alk intake can alleviate inflammation in mice with AD by restoring ceramide composition (and thus, the intercellular lipid barrier) in the skin. These findings indicate that dietary supplementation with Alk can be an effective strategy for ameliorating the symptoms of AD.
Author contributions
M. N. designed the research; N.W., M. N., and T.S. conducted the research and analyzed the data; Y.Y. and K.S. prepared Alk from krill for diet. S.K. supervised the study design. M.N. and N.W. wrote the paper; M.N. was primarily responsible for the final content. All authors read and approved the final manuscript.
20181206_Supplemental_Fig__Megumi_Nishimukai__for_BBB-h.pptx
Download MS Power Point (179.6 KB)Disclosure statement
No potential conflict of interest was reported by the authors.
Supplementary material
Supplemental data for this article can be accessed here.
Additional information
Funding
Related Research Data
References
- Braverman NE, Moser AB. Functions of plasmalogen lipids in health and disease. Biochim Biophys Acta. 2012;1822:1442–1452.
- Morand OH, Zoeller RA, Raetz CRH. Disappearance of plasmalogens from membranes of animal cells subjected to photosensitized oxidation. J Biol Chem. 1988;263:11597–11606.
- Nishimukai M, Maeba R, Yamazaki Y, et al. Serum choline plasmalogens, particularly those with oleic acid in sn-2, are associated with proatherogenic state. J Lipid Res. 2014;55:956–965.
- Yamazaki Y, Kondo K, Maeba R, et al. The proportion of nervonic acid in serum lipids is associated with serum plasmalogen levels and metabolic syndrome. J Oleo Sci. 2014;63:527–537.
- Han X, Holtzman DM, McKeel DW. Plasmalogen deficiency in early Alzheimer’s disease subjects and in animal models: molecular characterization using electrospray ionization mass spectrometry. J Neurochem. 2001;77:1168–1180.
- Goodenowe DB, Cook LL, Liu J, et al. Peripheral ethanolamine plasmalogen deficiency: a logical causative factor in Alzheimer’s disease and dementia. J Lipid Res. 2007;48:2485–2498.
- Van Smeden J, Janssens M, Gooris GS, et al. The important role of stratum corneum lipids for the cutaneous barrier function. Biochim Biophys Acta. 2014;1841:295–313.
- Brandner JM. Importance of tight junctions in relation to skin barrier function. Curr Probl Dermatol. 2016;49:27–37.
- Bäsler K, Bergmann S, Heisig M, et al. The role of tight junctions in skin barrier function and dermal absorption. J Control Release. 2016;242:105–118.
- Breiden B, Sandhoff K. The role of sphingolipid metabolism in cutaneous permeabilitybarrier formation. Biochim Biophys Acta. 2014;1841:441–452.
- Cork MJ, Robinson DA, Vasilopoulos Y, et al. New perspectives on epidermal barrier dysfunction in atopic dermatitis: gene-environment interactions. J Allergy Clin Immunol. 2006;118:3–21.
- Leung DYM. Bieber T. Atopic Dermatitis Lancet. 2003;361:151–160.
- van Smeden J, Janssens M, Kaye ECJ, et al. The importance of free fatty acid chain length for the skin barrier function in atopic eczema patients. Exp Dermatol. 2014;23:45–52.
- Ishikawa J, Narita H, Kondo N, et al. Changes in the ceramide profile of atopic dermatitis patients. J Invest Dermatol. 2010;130:2511–2514.
- Kaikiri H, Miyamoto J, Kawakami T, et al. Supplemental feeding of a gut microbial metabolite of linoleic acid, 10-hydroxy-cis-12-octadecenoic acid, alleviates spontaneous atopic dermatitis and modulates intestinal microbiota in NC/nga mice. Int J Food Sci Nutr. 2017;68:941–951.
- Nishimukai M, Wakisaka T, Hara H. Ingestion of plasmalogen markedly increased plasmalogen levels of blood plasma in rats. Lipids. 2003;38:1227–1235.
- Bligh EG, Dyer WJ. A rapid method of total lipid extraction and purification. Can J Biochem Physiol. 1959;37:911–917.
- Bartlett GR. Colorimetric assay phosphorylated for free glyceric acids. J Biol Chem. 1958;234:469–471.
- Nishimukai M, Yamashita M, Watanabe Y, et al. Lymphatic absorption of choline plasmalogen is much higher than that of ethanolamine plasmalogen in rats. Eur J Nutr. 2011;50:427–436.
- Seino S, Tanaka Y, Honma T, et al. Atopic dermatitis causes lipid accumulation in the liver of NC/Nga mouse. J Clin Biochem Nutr. 2011;49:174–181.
- Ariel A, Serhan CN. Resolvins and protectins in the termination program of acute inflammation. Trends Immunol. 2007;28:176–183.
- Serhan CN. Resolution phase of inflammation: novel endogenous anti-inflammatory and proresolving lipid mediators and pathways. Annu Rev Immunol. 2007;25:101–137.
- Nagashio Y, Matsuura Y, Miyamoto J, et al. Hesperidin inhibits development of atopic dermatitis-like skin lesions in NC/Nga mice by suppressing Th17 activity. J Funct Foods. 2013;5:1633–1641.
- Honsho M, Asaoku S, Fujiki Y. Posttranslational regulation of fatty acyl-CoA reductase 1, Far1, controls ether glycerophospholipid synthesis. J Biol Chem. 2010;285:8537–8542.
- Schmitz G, Ecker J. The opposing effects of n-3 and n-6 fatty acids. Prog Lipid Res. 2008;47:147–155.
- Tokumasu R, Yamaga K, Yamazaki Y, et al. Dose-dependent role of claudin-1 in vivo in orchestrating features of atopic dermatitis. Proc Natl Acad Sci USA. 2016;113:E4061–E4068.
- De Benedetto A, Rafaels NM, McGirt LY, et al. Tight junction defects in patients with atopic dermatitis. J Allergy Clin Immunol. 2011;127:773–786.
- Masukawa Y, Narita H, Shimizu E, et al. Characterization of overall ceramide species in human stratum corneum. J Lipid Res. 2008;49:1466–1476.
- Janssens M, van Smeden J, Gooris GS, et al. Increase in short-chain ceramides correlates with an altered lipid organization and decreased barrier function in atopic eczema patients. J Lipid Res. 2012;53:2755–2766.
- Uchida Y, Hara M, Nishio H, et al. Epidermal sphingomyelins are precursors for selected stratum corneum ceramides. J Lipid Res. 2000;41:2071–2082.
- Hamanaka S, Hara M, Nishio H, et al. Human epidermal glucosylceramides are major precursors of stratum corneum ceramides. J Invest Dermatol. 2002;119:416–423.
- Jensen JM, Fölster-Holst R, Baranowsky A, et al. Impaired sphingomyelinase activity and epidermal differentiation in atopic dermatitis. J Invest Dermatol. 2004;122:1423–1431.
- Imokawa G. A possible mechanism underlying the ceramide deficiency in atopic dermatitis: expression of a deacylase enzyme that cleaves the N-acyl linkage of sphingomyelin and glucosylceramide. J Dermatol Sci. 2009;55:1–9.
- Tawada C, Kanoh H, Nakamura M, et al. Interferon-γ decreases ceramides with long-chain fatty acids: possible involvement in atopic dermatitis and psoriasis. J Invest Dermatol. 2014;134:712–718.