
ABSTRACT
To investigate a comprehensive transcriptome information of adipogenesis, we assessed global changes in the transcriptional events during 3T3-L1 adipogenesis by RNA-Seq. Compared to the preadipocyte stage (day 0), gene expression profiling demonstrated that 2013 genes were up-regulated, and 2430 genes were down-regulated at the differentiated adipocyte stage (day 13). Among these differentially expressed genes, we found the expression of MSMO1 was down-regulated at day 13, but whether it impacts adipogenesis has not been characterized. Thus, we investigated its role in adipogenesis. Results showed that overexpression of MSMO1 inhibited the differentiation of 3T3-L1, and led to the down-regulated expression of adipogenic marker genes, while knockdown of MSMO1 had totally opposite effects. Furthermore, interaction network model allowed us to validate an unexpected role between MSMO1 and its partner, NSDHL, in regulating adipogenesis, which plays a synergized expression pattern with MSMO1. Our findings indicate that MSMO1 and NSDHL are novel modulators of adipogenesis.
Graphical Abstract
RNA-Seq analysis reveals a negative role of MSMO1 with a synergized NSDHL expression during adipogenesis of 3T3-L1.
Transcriptome is total of the RNA products of a specific tissue or cell under particular spatial and temporal or physiological conditions. And transcriptome is also the link between the genome and proteome information [Citation1]. Under different spatial and temporal or physiological conditions, differentially expressed genes (DEGs) and their related functional genes could be discovered by transcriptomic analysis, which serves as a point of penetration for the study of gene function [Citation2]. As next-generation sequencing technology, RNA sequencing (RNA-Seq) has become a more effective method for large-scale transcriptomic studies [Citation3]. RNA-Seq could detect global transcriptome expressions with higher resolution and lower cost compared with microarrays [Citation4]. RNA-Seq can obtain the sequences of almost all complementary transcripts (cDNA) from the RNA of a specific tissue or cell under certain conditions [Citation5]. Previous results showed that RNA-Seq has attracted increasing attention in relevant gene signatures in recent years [Citation6,Citation7]. Given that the annotation of transcripts in the existing databases is incomprehensive, new transcripts and genes can be discovered by aligning the reads to known genes in the sequence databases and analyzing the annotation of the existing genes.
White adipose tissue plays a role in maintenance of energy homeostasis by storing lipids and releasing free fatty acids [Citation8]. Therefore, enhancing the differentiation and function of white adipocytes may be rapidly useful for treating obesity and its associated metabolic disorders. During differentiation, the action of adipogenic genes, including CCAAT/enhancer-binding proteins (C/EBPs) and peroxisome proliferator-activated receptor-γ (PPARγ), induces adipogenesis. PPARγ is a master regulator of preadipocytes adipogenesis, and induces expression of mature adipocyte phenotype-genes including fatty acid binding protein (FABP4) and CD36 [Citation9]. C/EBPα maintains PPARγ expression, and is required for differentiation of white preadipocytes [Citation10]. Other transcription factors such as C/EBPδ, glucocorticoid (GR), cAMP response element binding protein (CREB), and sterol regulatory element-binding protein-1 (SREBP-1c) positively regulate adipogenesis [Citation8,Citation11]. In addition, the Wnt/β-catenin pathway negatively regulates adipocyte differentiation [Citation12]. It is clear that establishing the molecular mechanisms in regulating adipogenesis may provide ideal insights into adipose tissue biology. However, the factors involved in adipogenesis have not been completely defined yet.
Therefore, in the present study, in order to determine the factors and mechanisms in regulating adipogenesis, RNA-Seq technology was used to investigate the global gene expression patterns in preadipocytes and differentiated adipocytes of 3T3-L1. We determined that Methylsterol monooxygenase 1 (MSMO1) was down-regulated in differentiated adipocytes. MSMO1 encodes the enzyme methylsterol monooxygenase 1, which locates on the endoplasmic reticulum (ER) membranes and catalyzes demethylation of C4-methylsterols in the cholesterol synthesis pathway. Studies have shown that MSMO1 operates function in the regulation of energy metabolism, obesity and dyslipidemia [Citation13]. However, the role of MSMO1 remains unknown in adipogenesis. Therefore, we investigated whether MSMO1 regulates adipogenesis. In this study, we demonstrated that NADP-dependent steroid dehydrogenase–like (NSDHL) was down-regulated by the attenuation of MSMO1 in 3T3-L1, leading to adipogenic changes. And overexpression of MSMO1 had opposite effects.
Materials and methods
Cell culture and adipocyte differentiation
The 3T3-L1 were cultured in Dulbecco’s Modified Eagle medium (DMEM) supplemented with 10% new born calf serum (Gibco, Oklahoma, USA). Two days after 3T3-L1 preadipocytes reaching confluence, cells were induced to differentiate (designated as day 0, D0) by adding 100 ng/μL dexamethasone, 100 ng/μL insulin, and 0.5 mM 3-isobutyl-1-methylxanthine, for 2 days, and then treated with differentiation medium supplemented with 20 nM insulin for another 2 days (Sigma-Aldrich, St.Louis, MO, USA). Cells were maintained after induction in DMEM containing 10% fetal calf serum (Gibco, Oklahoma, USA) with media changes every day.
Oil red o staining
Adipocyte differentiation was monitored by measurement of lipid accumulation using an Oil Red O (Sigma-Aldrich, St.Louis, MO, USA) assay on samples, according to the manufacturer’s protocol. Then, the plates were photographed by OLYMPUS DP Controller program, and the quantitative analysis of Oil red O staining was performed using the ImageJ program.
mRNA sequencing by illumina HiSeq
Total RNA of each sample was extracted using RNeasy Mini Kit (Qiagen, Duesseldorf, GER). The RNA was quantified and qualified by Agilent 2100 Bioanalyzer (Agilent Technologies, Palo Alto, CA, USA), NanoDrop (Thermo Fisher Scientific, Waltham, MA, USA) and 1% agarose gel. 1 μg total RNA with RNA integrity number (RIN) greater than 9.0 was used for following library preparation. Next generation sequencing library preparations were constructed according to the manufacturer’s protocol (NEBNext® Ultra™ RNA Library Prep Kit for Illumina®, NEB, USA).
Ribo-Zero™ rRNA removal Kit (Illumine, San Diego, CA, USA) was used for preparation of rRNA-deprived total RNAs. Then, the poly(A) mRNA isolation was performed using NEBNext Poly(A) mRNA Magnetic Isolation Module (NEB, USA). The mRNA fragmentation and priming were performed using NEBNext First Strand Synthesis Reaction Buffer and NEBNext Random Primers. First strand cDNA was synthesized using ProtoScript II Reverse Transcriptase and the second-strand cDNA was synthesized using Second Strand Synthesis Enzyme Mix. The purified double-stranded cDNA by AxyPrep Mag PCR Clean-up (Axygen, California, USA) was then treated with End Prep Enzyme Mix to repair both ends and was added a dA-tailing in one reaction, followed by a T-A ligation to add adaptors to both ends. Size selection of Adaptor-ligated DNA was then performed using AxyPrep Mag PCR Clean-up (Axygen, California, USA), and fragments of ~360 bp (with the approximate insert size of 300 bp) were recovered. Each sample was then amplified by PCR for 11 cycles using P5 and P7 primers, with both primers carrying sequences which could anneal with flow cell to perform bridge PCR and P7 primer carrying a six-base index allowing for multiplexing. The PCR products were cleaned up using AxyPrep Mag PCR Clean-up (Axygen, California, USA), validated using an Agilent 2100 Bioanalyzer (Agilent Technologies, Palo Alto, CA, USA), and quantified by Qubit 2.0 Fluorometer (Invitrogen, Carlsbad, CA, USA). Then libraries with different indices were multiplexed and loaded on an Illumina HiSeq instrument according to manufacturer’s instructions (Illumina, San Diego, CA, USA). Sequencing was carried out using a 2 × 150 bp paired-end (PE) configuration; image analysis and base calling were conducted by the HiSeq Control Software (HCS) + OLB + GAPipeline-1.6 (Illumina, San Diego, CA, USA) on the HiSeq instrument. The sequences were processed and analyzed by GENEWIZ.
In order to remove technical sequences, including adapters, PCR primers, fragments thereof, and quality of bases lower than 20, pass filter data of FASTQ format were processed by Trimmomatic (v0.30) to be high quality clean data. Several steps were performed for mapping: Firstly, reference genome sequences and gene model annotation files of elative species were downloaded from genome website, such as UCSC, NCBI, ENSEMBL. Secondly, Hisat2 (v2.0.1) was used to index reference genome sequence. Finally, clean data were aligned to reference genome via software Hisat2 (v2.0.1).
In the beginning, transcripts in FASTA format are converted from known GTF annotation file and indexed properly. Then, with the file as a reference gene file, HTSeq (v0.6.1) estimated gene and isoform expression levels from the pair-end clean data. Differential expression analysis was operated by the DESeq Bioconductor package, a model based on the negative binomial distribution. After adjusted by Benjamini and Hochberg’s approach for controlling the false discovery rate, P-value of genes were sated <0.05 to detect differential expressed ones. GO-Term Finder was used identifying Gene Ontology (GO) terms that annotate a list of enriched genes with a significant p-value less than 0.05. KEGG (Kyoto Encyclopedia of Genes and Genomes) is a collection of databases dealing with genomes, biological pathways, diseases, drugs, and chemical substances (http://en.wikipedia.org/wiki/KEGG). We used scripts in house to enrich significant differential expression gene in KEGG pathways.
Real-time quantitative PCR
Total RNA was extracted by RNAiso (Takara, Dalian, China). RNA was reversely transcribed to cDNA using the PrimeScript™ RT reagent Kit with gDNA Eraser (Takara, Dalian, China) following the manufacturer’s instructions. The quantitative reverse transcription polymerase chain reaction (qRT-PCR) reaction contained 10 μL of Luna universal qPCR Mix (NEB, USA), 20 ng of diluted cDNA, and 5 μM of each primer (Table S1) contributing a total volume of 20 μL. After completion of the reaction, the data analyses were based on the obtained sample Cycle threshold (Ct) value. Relative quantification was calculated by the 2−ΔΔCt method and normalized by β-actin. qRT-PCR validation was performed in triplicates and repeated at least three times.
Construction of expression vectors
The MSMO1 and NSDHL cDNA were amplified from 3T3-L1 preadipocytes by PCR and ligated into the pCMV expression vector (with an N-terminal FLAG epitope tag). After being confirmed by sequencing, all mammalian expression plasmids were extracted for transfection using the TIANprep Maxi Plasmid Kit (Tiangen, Beijing, China).
Small interfering RNAs (siRNAs) and transfection
All siRNAs oligo for MSMO1 genes used in this experiment were purchased from GenePharma (Shanghai, China). Sequences of these oligonucleotides are listed in Table S2.
3T3-L1 preadipocytes were electroporated with pCMV-MSMO1 (MSMO1 expression vector), siRNA or siRNA+pCMV-NSDHL (NSDHL expression vector) using the GenePulser Xcell (BIO-RAD, California, USA) according to the manufacturer’s protocols. Transfection efficiency was assessed by qRT-PCR (after transfected 24 h) and western blot analysis (after transfected 48 h).
Protein isolation and western blot analysis
Cultured cells were washed twice with PBS, and lysed using Lysis Buffer. Briefly, perform 12% SDS-PAGE gel electrophoresis on the protein samples and transfer the protein to Immun-Blot PVDF membranes using the Trans-Blot SD Semi-Dry Electrophoretic Transfer Cell according to the instruction manual (BIO-RAD, California, USA). Block the membrane with 5% nonfat milk in PBST for 1 h with shaking at room temperature. The membranes were immunoblotted with primary antibodies against FLAG (ZSGB-BIO, Beijing, China) or β-actin (MBL, Tokyo, Japan) with shaking over night at 4℃. The blots were washed three times with PBST, incubated with goat anti-mouse IgG conjugated with horseradish peroxidase (Abbkine, California, USA) in PBST for 1 h at room temperature, and then washed three times with PBST for 30 min. The immunoreactive bands were visualized using the BeyoECL Moon (Beyotime, Shanghai, China) and exposed using the Amersham Imager 600 (GE Healthcare Bio-Sciences Crop, Piscataway, USA) according to the manufacturer’s protocols. Each western blot was performed at least three times.
Protein-protein interaction
Based on GeneMANIA database (http://genemania.org/), we analyzed the protein-protein interaction network for DEGs, and further investigated the interaction between MSMO1 and eligible molecules in a given network by random chance to identify the extent of gene connectivity. Cytoscape was used to visualize the protein-protein interaction network for DEGs, and find the key genes.
Statistical analysis
The results are presented as the mean±SEM. Statistically significant differences were determined by the two-tailed Student’s t-test. For all statistical analyses, P values <0.05 were considered significant and *P < 0.05, **P < 0.01 and ***P < 0.001.
Results
Authenticate the quality of adipogenesis of 3T3-L1
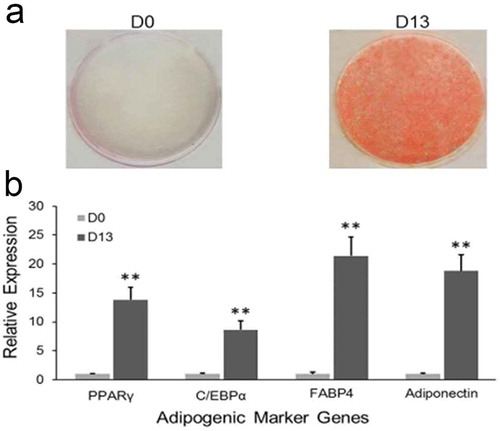
To get a systematically view of gene expression during 3T3-L1 adipogenesis, RNA-Seq was performed to identify the involved genes and their function. RNA was isolated from cultured 3T3-L1 of preadipocytes (D0) and differentiated adipocytes (D13). After inducing with adipogenic agents for 13 days, the production and accumulation of lipid was authenticated by Oil Red O staining (), and the expression levels of several well-known adipogenic marker genes were measured by qRT-PCR, such as PPARγ, C/EBPα, FABP4 and adiponectin (). Complete lipid accumulation and elevated expression of adipogenic marker genes were observed (). These results indicate that 3T3-L1 cells were fully differentiated at D13 and could be fulfilled the functional criteria of adipocyte differentiation.
Figure 1. Adipogenesis of 3T3-L1 in vitro.
(a) Oil red O staining. After inducing differentiation of 3T3-L1 preadipocytes, cells were stained with Oil Red O at D0 and D13, respectively. (b) Relative expression level of adipogenic marker genes were detected at D0 and D13 by qRT-PCR. (**p < 0.01. β-actin mRNA was used as control).
Analysis of transcriptome sequencing
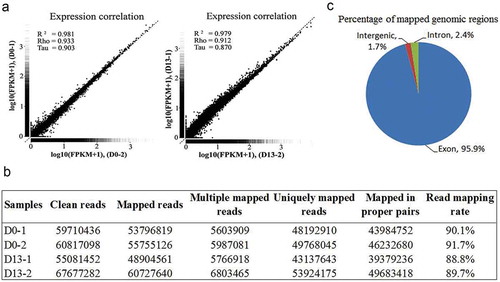
The mRNA fractions were isolated from total RNA obtained from 3T3-L1 preadipocytes at D0 and adipocytes at D13. An RNA-Seq library was generated using these mRNA fractions by RNA fragmentation, random hexamer-primed cDNA synthesis, linker ligation and PCR amplification. Each library was sequenced using an Illumina HiSeq instrument according to manufacturer’s instructions (Illumina, San Diego, CA, USA). To evaluate whether the RNA-Seq data was of sufficient quality for further analysis, we first assessed the global quality of the obtained reads. The gene expression correlation was analyzed between preadipocytes (D0-1 and D0-2) or differentiated adipocytes (D13-1 and D13-2), respectively. As illustrated in , the global profiles of gene expression were generally highly correlated with pairwise Pearson correlation coefficient (D0-1 vs. D0-2, Spearman’s rho = 0.933, and D13-1 vs. D13-2, Spearman’s rho = 0.912). Our transcriptome data exhibited a good linear correlation between the independent samples of preadipocytes (D0-1 and D0-2) or differentiated adipocytes (D13-1 and D13-2). In total, we obtained 120.5 million and 122.8 million reads after trimming from the 3T3-L1 preadipocytes at D0 and adipocytes at D13, respectively. The uniquely mapped reads ranged from 43.1 million to 53.9 million reads for the four samples. The proportion of reads that mapped to the NCBI reference genome ranged from 88.8 to 91.7% (). A large fraction (95.9%) of all mapped sequence reads were located in exon regions (), indicating an impressive number of transcripts. This demonstrates the high quality of our sequencing datasets.
Figure 2. RNA-Seq analysis.
(a) Validation of the transcriptome data. The performance of RNA-Seq was evaluated by determining the correlation of genes expression between two independent samples from preadipocytes (D0-1 and D0-2) or differentiated adipocytes (D13-1 and D13-2). (b) Mapping result statistics at D0 and D13. (c) Pie charts representing the percentage of nucleotide bases mapping to indicated genomic regions.
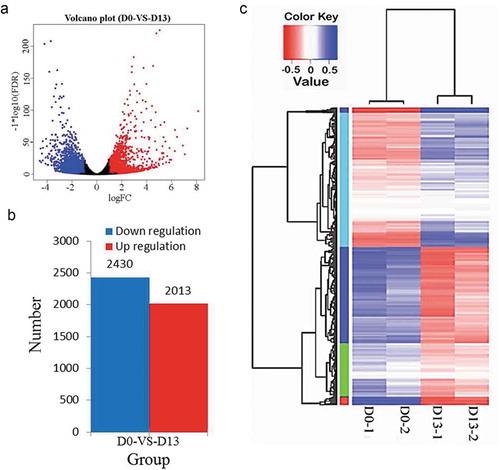
As was shown in volcano plot of the gene expression profiles (), DEGs were defined as those with a fold change of ≥ 2.0 on D0 compared to D13. A total of 4443 genes were differentially expressed between D0 and D13 including 2013 up-regulated and 2430 down-regulated genes (). For these DEGs that were commonly identified in comparison of D0 vs D13, a boots trap-hierarchical clustering was performed between D0 and D13. As illustrated in , the gene expression signature of D0 was distinctly different from corresponding D13.
Figure 3. DEGs by RNA-Seq.
(a) Clustering DEGs at D0 and D13. (b) Number of DEGs for D0 vs. D13. (c) Hierarchical clustering of gene expression data shows distinguishable gene expression profiles between preadipocytes (D0-1 and D0-2) and differentiated adipocytes (D13-1 and D13-2).
Functional enrichment analysis of DEGs
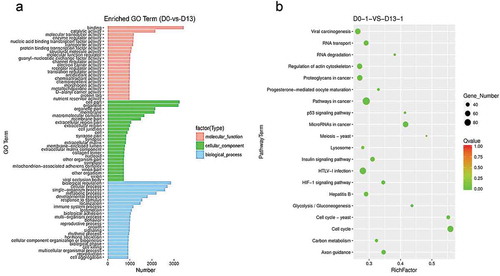
To examine the potential functions of the genes which showed differential expression, we performed an enrichment analysis for DEGs between D0 and D13. The GO categories that DEGs significantly enriched in from the comparison of D0 and D13 were selected. In total, the DEGs between D0 and D13 were categorized into 71 GO categories under three ontologies and 20 KEGG pathways (). To further analysis differentiation involved in lipid metabolic or fat cell differentiation between D0 and D13, some common target genes were enriched both GO and KEGG ( and Table S3). Interestingly, more genes are enriched in GO terms of lipid metabolic process (GO: 0006629), fatty acid metabolic process (GO:0006631) and fatty acid biosynthetic process (GO:0006633) for DEGs between D0 and D13. And also found that the altered expression affected some KEGG pathways, such as biosynthesis of unsaturated fatty acids (ko01040), insulin signaling pathway (ko04910), steroid biosynthesis (ko00100), Pyruvate metabolism (ko00620), and so on ( and Table S3). In total, these results indicate the potential roles of enriched genes in a biogenesis and differentiation fat cell.
Table 1. Gene ontology analysis of DEGs involved in adipogenesis-associated categories.
Figure 4. Functional enrichment analysis of DEGs.
(a) GO analysis of DEGs. The figure is composed of three parts: molecular functions, cellular components and biological process. The significance level of enrichment was set at corrected p-value (p-value < 0.05). (b) KEGG pathway analysis of differentially expressed genes. Advanced bubble chart shows enrichment of DEGs in signaling pathways. Y-axis label represents pathway, and X-axis label represents rich factor (rich factor = amount of DEGs enriched in the pathway/amount of all genes in background gene set). Size and color of the bubble represent amount of DEGs enriched in pathway and enrichment significance, respectively.
Real-time quantitative PCR validation
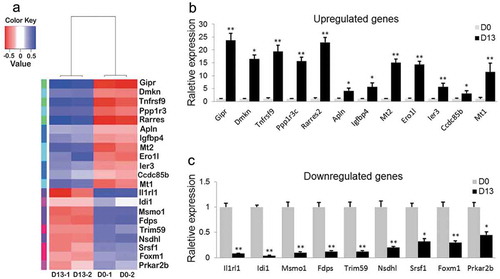
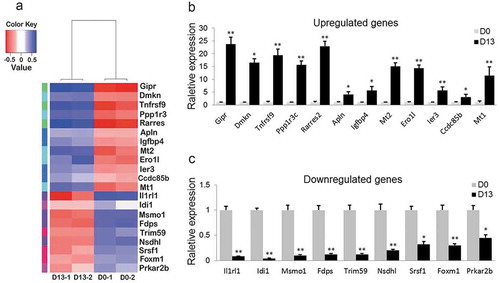
We selected a total of 21 DEGs according to log2 ratio of fold change (|log2FC|≥ 2.0), related GO categories, bigger raw reads and fragments per kilobase of exon per million fragments mapped (FPKM) between D0 and D13 based on the specific RNA-Seq datasets, including 12 upregulated and 9 downregulated genes (). To validate these DEGs form data of RNA-Seq, we assessed the expression patterns of the 21 DEGs by qRT-PCR between D0 and D13 (). This analysis detected the same expression patterns as those determined by RNA-Seq analysis (). The concordance between qRT-PCR and RNA-Seq results confirmed that the findings from RNA-Seq were credible.
Figure 5. Relative expression levels of 21 DEGs.
(a) Heatmap of 21 DEGs during adipogenesis (p < 0.05). (b) 12 DEGs were validated as significantly upregulated. (c) 9 DEGs were confirmed as significantly downregulated. (*p < 0.05; **p < 0.01. β-actin mRNA was used as control).
The role of MSMO1 in the regulation of adipogenesis
MSMO1 is one of the most important cholesterol biosynthetic enzymes, and genome-wide association studies have suggested that MSMO1 may serve as a promising candidate for the modulation of type 2 diabetes [Citation13]. We verified the MSMO1 expressed differentially in RNA-seq data. Therefore, we investigated the role of MSMO1 in adipogenesis. We first confirmed the expression of MSMO1 during adipogenesis of 3T3-L1 by qRT-PCR. Data showed that MSMO1 was highly expressed in preadipocytes, but dramatically decreased after adipogenic induction, similar expression patterns with RNA-Seq (, ).
Figure 6. Overexpression of MSMO1 inhibits adipogenesis of 3T3-L1.
3T3-L1 preadipocytes were transfected with pCMV-MSMO1 and were differentiated in differentiation medium for 12 days. (a) Expression of MSMO1 during differentiation of 3T3-L1 at the indicated times by qRT-PCR. (**P < 0.01 vs. D0. β-actin mRNA was used as control). (b) MSMO1 expression was determined in MSMO1-transfected 3T3-L1 preadipocytes by qRT-PCR (after transfected 24 h) and western blot (after transfected 48 h). (**P < 0.01 vs. control vector. β-actin mRNA and tubulin were used as control). (c) Adipocyte differentiation was assessed by Oil Red O staining and expression of PPARγ, FABP4 and C/EBPα on D12. Scale bar indicates 100 µm. (*P < 0.05 vs. control vector. β-actin mRNA was used as control).
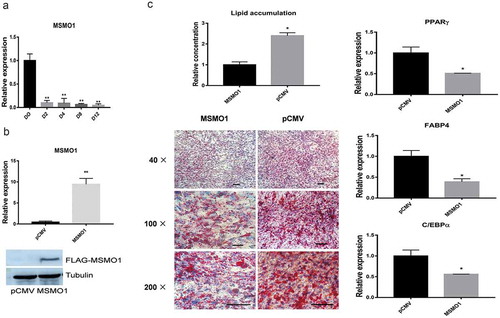
To address whether MSMO1 plays a role in the adipogenesis of 3T3-L1, we examined adipogenesis in MSMO1 overexpressed 3T3-L1, and both qRT-PCR and western blot showed that MSMO1 was overexpressed in 3T3-L1 preadipocytes (). However, overexpression of MSMO1 inhibited adipogenesis of 3T3-L1, which was determined by Oil Red O staining and expression of adipogenic marker genes, such as PPARγ, FABP4 and C/EBPα ().
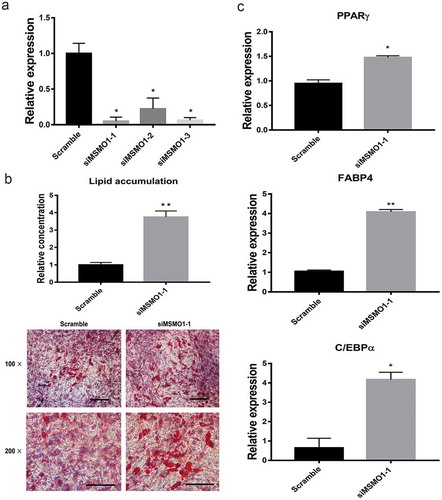
Furthermore, to confirm the effect of MSMO1 on adipogenesis, we evaluated adipogenesis in MSMO1 knockdown 3T3-L1. Knockdown of MSMO1 using siRNA was confirmed by qRT-PCR (). Knockdown of MSMO1 greatly increased the adipogenesis of 3T3-L1 compared with scramble (). In addition to lipid accumulation, the expression of adipogenic marker genes also increased in MSMO1 knockdown cells (). Taken together, these results imply that MSMO1 is a key regulator of adipogenesis in 3T3-L1.
Figure 7. Knockdown of MSMO1 stimulates adipogenesis of 3T3-L1. 3T3-L1 preadipocytes were transfected with MSMO1 siRNA and were differentiated in differentiation medium for 12 days.
(a) MSMO1 knockdown was confirmed in MSMO1 siRNA-transfected 3T3-L1 preadipocytes by qRT-PCR after transfected 24 h. (*P < 0.05 vs. scramble. β-actin mRNA was used as control). (b) Adipogenesis was assessed by Oil Red O staining. Scale bar indicates 100 µm. (**P < 0.01 vs. scramble). (c) The expression of PPARγ, FABP4 and C/EBPα on D12. (*P < 0.05, **P < 0.01 vs. scramble. β-actin mRNA was used as control).
Protein-protein interaction analysis
We integrated expression level of DEGs with protein-protein interaction network. As shown in , PPARγ, C/EBPα and FABP4 that play crucial roles in adipogenesis existed in interaction network. FABP4 is associated with so many genes that it is at the core position of the interaction network. In addition, some genes with significant variation are also identified, such as up-regulated genes, dermokine (Dmkn), apelin (Apln), metallothionein 2 (Mt2) and metallothionein 1 (Mt1) and down-regulated genes, MSMO1, NSDHL, interleukin 1 receptor-like 1 (Il1rl1), isopentenyl-diphosphate delta isomerase (Idi1), tripartite motif-containing 59 (Trim59), serine/arginine-rich splicing factor 1 (Srsf1). These genes are at key positions of the interaction network.
Figure 8. Protein-protein interaction analysis.
Node represents protein; edge represents interaction between proteins; size of the node is proportional to degree of this node (degree of the node is defined as amount of proteins that interact with this node). For interpretation of the references to color in this figure legend. (a) Protein-protein interaction network of differentially expressed genes. Showing 20 related genes, with 38 total genes, and 542 total links. (b) Protein-protein interaction network between MSMO1 and eligible molecules. Showing 20 related genes, with 21 total genes, and 875 total links.
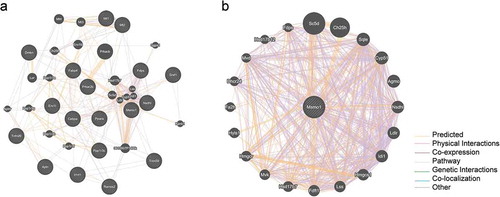
In order to identify the candidate key genes that potentially regulate adipogenesis of 3T3-L1 with MSMO1, we also constructed protein-protein interaction networks using GeneMANIA. 875 total links were identified, interestingly, the network was associated with cholesterol metabolism, monooxygenase activity, and fat cell differentiation, this network comprised NSDHL, squalene epoxidase (SQLE), lanosterol synthase (LSS), and other lipid metabolism related genes ().
Network modeling suggests a role for MSMO1 and NSDHL
No previous studies have suggested a mechanism for how the MSMO1 might influence adipogenesis of 3T3-L1. NSDHL is a downstream gene of MSMO1 and plays vital roles in the cholesterol biosynthesis process. Protein-protein interactions involved in cholesterol biosynthesis have noted a close physical and functional interaction between MSMO1 and NSDHL [Citation14], suggesting that MSMO1 might be acting through NSDHL to influence adipogenesis processes. As a source of insight, we systematically analyzed the cholesterol biosynthesis pathway. As expected, many interactions reflecting their participation in the linear cholesterol biosynthesis pathway as well as additional interactions with genes annotated for roles in lipid synthesis and metabolism (). We therefore tested the inference that MSMO1 and associated proteins may regulate adipogenesis of 3T3-L1.
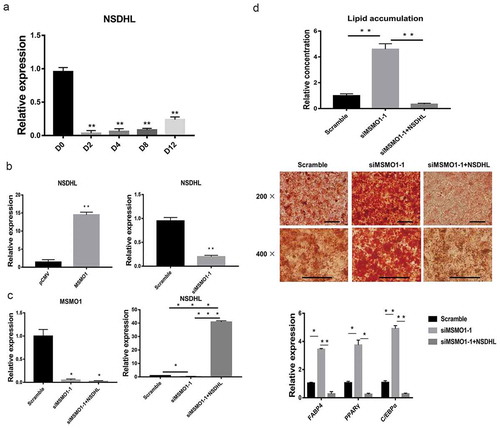
We first confirmed the expression of NSDHL during adipogenesis of 3T3-L1. NSDHL was also down-regulated gene in RNA-Seq data (). qRT-PCR showed that similar expression patterns between MSMO1 and NSDHL (, ). Furthermore, we demonstrated that overexpression of MSMO1 increased the expression of NSDHL (); in contrast, the suppression of MSMO1 led to a decline in NSDHL (). Meanwhile, overexpression of NSDHL not only rescued the situation that caused by suppression of MSMO1, but also decreased the adipogenesis of 3T3-L1 (). Taken together, those results suggest that MSMO1 and NSDHL might interact directly with multiple components to regulate adipogenesis of 3T3-L1.
Figure 9. Interaction between MSMO1 and NSDHL.
(a) 3T3-L1 preadipocytes were differentiated in differentiation medium for 12 days and the expression of NSDHL was determined at the indicated times by qRT-PCR. (**P < 0.01 vs. D0. β-actin mRNA was used as control). (b) NSDHL expression was determined in pCMV-MSMO1 or MSMO1 siRNA transfected 3T3-L1 preadipocytes by qRT-PCR after transfected 24 h. (**P < 0.01 vs. control vector or scramble. β-actin mRNA was used as control). (c) 3T3-L1 preadipocytes were differentiated in differentiation medium for 9 days and the expression of MSMO1 and NSDHL was determined in MSMO1 siRNA transfected or MSMO1 siRNA and pCMV-NSDHL co-transfected 3T3-L1 preadipocytes by qRT-PCR after transfected 24 h. (*P < 0.05, ***P < 0.001 vs. siMSMO1-1 or scramble. β-actin mRNA was used as control). (d) Adipogenesis was assessed by Oil Red O staining and expression of PPARγ, FABP4 and C/EBPα on D9. Scale bar indicates 100 µm. (*P < 0.05, **P < 0.01 vs. scramble or siMSMO1-1+ NSDHL. β-actin mRNA was used as control).
Discussion
Adipose tissue is not only a large energy storage organ but also an important cholesterol storage organ [Citation15]. Most of the intracellular cholesterol is positively correlated with lipid droplets, Cholesterol homeostasis may play a key role in the regulation of adipocytes size and function [Citation16]. Based on our RNA-seq data, there were many cholesterogenic genes which differentially expressed during the adipogenesis of 3T3-L1 (Table S4). The compartmentalization of genes involved in the cholesterol biosynthetic pathway may provide a mechanism to understand the regulation adipogenesis. Adipocytes produce and secrete a variety of adipokines, which affect insulin sensitivity, glucose and lipid levels, and satiety of appetite [Citation17,Citation18]. An increased number of adipocytes are primarily caused by the proliferation of preadipocytes and their continuous differentiation [Citation19]. The mechanisms underlying the complications of obesity are related to changes in the proliferation, differentiation, and function of fat cells [Citation20]. Recent evidences have identified substantial overlap between metabolic and oncogenic biochemical pathways, suggesting novel approaches to cancer intervention. For example, cholesterol lowering statins act as chemopreventive agents in prostate, glioma and other cancers [Citation21]. The differentiation of fibroblast like preadipocytes into mature adipocytes involves morphological and biochemical changes [Citation15–Citation20,Citation22]. Thus, dissecting the molecular events regulating adipocyte formation and function can lead to the ideal treatment of obesity and cancers.
The mouse 3T3-L1 is an important in vitro system for investigating the underlying mechanism of adipogenesis [Citation11]. In recent study, to investigate the transcriptional changes during the adipogenesis of 3T3-L1 preadipocytes, we performed RNA-Seq at different stages of 3T3-L1 adipogenesis, specifically D0 and D13. To obtain the sequencing library, an RNA pool was constructed from 3T3-L1 preadipocytes at D0 (D0-1 and D0-2) and adipocytes at D13 (D13-1 and D13-2) samples. In present study, the generated data () were more comprehensive than that in the previous studies [Citation6,Citation7], suggesting that number of genes involved in the adipogenesis of 3T3-L1. In this study, RNA-Seq analysis identified 4443 genes, which were differentially expressed. Among them, 2013 were upregulated at D13, whereas 2430 were downregulated. It should be noticed that several DEGs had great differences in abundance between these two stages ().
In our data, the expression level of MSMO1 gene was lowly expressed in D13 and highly expressed in D0 (). This gene encodes an enzyme involved in cholesterol biosynthesis. Additionally, cholesterol and intermediates in its biosynthetic pathway are required for many developmental processes including membrane biosynthsis, transmembrane receptor signaling, steroid biosynthsis, nuclear receptor activation, and adipogenesis [Citation22]. we identified the adipogenesis of 3T3-L1 which was predicted to be down-regulated following MSMO1 overexpression treatment, suggesting that downregulation of 3T3-L1 adipogenesis caused by MSMO1 overexpression may be one underlying mechanism by which MSMO1 exerts its effect on 3T3-L1. In addition, knock-down of MSMO1 by siRNA stimulated differentiation of 3T3-L1 accompanying increase in the adipogenic markers, such as PPARγ, FABP4 and C/EBPα. Therefore, MSMO1 may be a potential target for the regulation of 3T3-L1 adipogenesis.
To address the mechanism of MSMO1 regulation of adipogenesis, we first considered whether this effect was general to proteins involved in the cholesterol biosynthesis pathway or more specific. Knockdown of MSMO1 and NSDHL by multiple siRNA or short hairpin RNA sensitized the EGFR kinase inhibitor, suggesting a specific block focused at the C4-demethylation step in the pathway [Citation14]. Studies of NSDHL have also suggested that this protein associates more strongly and specifically with ER membranes and lipid droplets [Citation23]. Interestingly, NSDHL was also down-regulated by MSMO1 knockdown and up-regulated with overexpression of MSMO1. Furthermore, the situation caused by attenuation of MSMO1 could be rescued by overexpression of NSDHL.
In human cancer cells, the major transcription regulator of lipid metabolism PPARα incorporates with SREBP in regulating MSMO1 expression. Evidence suggests that the PPARα governs expression of numerous genes involved in lipid metabolism, fatty acid oxidation, gluconeogenesis and cholesterol catabolism [Citation24]. Additionally, PPARα has been shown to suppress gene expression by down-regulating the activity of other transcription factors [Citation25]. Regarding that, the potential impact of the synergized expression patterns of MSMO1 and NSDHL (, ) may translate a SREBP or PPAR response to 3T3-L1 adipogenesis. Taken together, this is the first report linking the role of MSMO1 with NSDHL on adipogenesis process.
In summary, we provided a genome-wide gene expression profile of during 3T3-L1 adipogenesis. Furthermore, we selected twenty-one genes to validate the result of RNA-seq analysis. The DEGs between D0 and D13 were identified and the relationships among significantly expression altered genes with adipogenesis were analyzed. Therefore, this study provided a valuable reference of gene data set for future in identification and validation of biomarkers for adipogenesis and fat deposition. MSMO1 () and NSDHL () expression level are rather dramatically decreased within the first two days and sustained for the following days, suggesting that MSMO1/NSDHL might have a decisive role in the initiation of adipogenesis. However, further validation studies are needed to determine authentic function or discover other underlying molecular mechanisms in future studies. Although 3T3-L1 is widely used as a commercial cell model of adipogenesis, there exists great diversity between different species in cattle and other large livestock, which makes it difficult to determine the adipogenesis and metabolism of actual regulation processes. Numerous studies of different tissues or species have demonstrated several factors would regulate adipogenesis based on RNA-Seq [Citation26–Citation29]. At least to some extent, knowing all sites of genome-wide gene expression during adipogenesis of 3T3-L1 can provide a most useful resource for the further research.
Author Contribution
YZ Xin, CP Li and Y Guo performed most of the research works:designed and carried out experiments, and wrote the manuscript. R Xiao and HY Zhang helped to construct vector. GL Zhou supervised the overall research and wrote the manuscript. All authors read and approved the manuscript.
Supplementary.docx
Download MS Word (27.8 KB)Disclosure statement
No potential conflict of interest was reported by the authors.
supplementary material
Supplemental data for this article can be accessed here.
Additional information
Funding
Related Research Data
References
- Suravajhala P, Kogelman LJ, Kadarmideen HN. Multi-omic data integration and analysis using systems genomics approaches: methods and applications in animal production, health and welfare. Genet Sel Evol. 2016;48(1):38–52.
- Kadarmideen HN, Reverter A. Combined genetic, genomic and transcriptomic methods in the analysis of animal traits. CAB Rev Perspect Agric Vet Sci Nutr Nat Resour. 2007;2(1):16–21.
- Zhang ZH, Jhaveri DJ, Marshall VM, et al. A comparative study of techniques for differential expression analysis on RNA-Seq data. PLoS One. 2014;9:e103207.
- Sora Y, Dougu N. Gene dispersion is the key determinant of the read count bias in differential expression analysis of RNA-seq data. Yoon Nam BMC Genomics. 2017;18(1):408–412.
- Tariq MA, Kim HJ, Jejelowo O, et al. Whole-transcriptome RNA-Seq analysis from minute amount of total RNA. Nucleic Acids Res. 2011;39:e120.
- Ahmed M, Nguyen HQ, Hwang JS, et al. Systematic characterization of autophagy-related genes during the adipocyte differentiation using public-access data. Oncotarget. 2018;9(21):15526–15541.
- Hassan M, El Yazidi C, Malezet-Desmoulins C, et al. Gene expression profiling of 3T3-L1 adipocytes exposed to phloretin. J Nutr Biochem. 2010;21(1):645–652.
- Feige GN, Auwerx J. Transcriptional coregulators in the control of energy homeostasis. Trends Cell Biol. 2007;17(6):292–301.
- Morrison RF, Farmer SR. Insights into the transcriptional control of adipocyte differentiation. J Cell Biochem. 1999;32(33):59–67.
- Salma N, Xiao H, Imbalzano AN. Temporal recruitment of C/EBPs to early and late adipogenic promoters in vivo. J Mol Endocrinol. 2006;36(1):139–151.
- Yang LH, Chen TM, Yu ST, et al. Olanzapine induces SREBP-1-related adipogenesis in 3T3-L1 cells. Pharmacol Res. 2007;56(3):202–208.
- Wang L, Di LJ. Wnt/β-Catenin mediates AICAR effect to increase GATA3 expression and inhibit adipogenesis. J Biol Chem. 2015;290(32):19458–19468.
- Bai W, Zhang C, Chen H. Transcriptomic analysis of Momordica charantia polysaccharide on streptozotocin-induced diabetic rats. Gene. 2018;675(1):208–216.
- Kratz LE, Kelley RI, Weiner LM, et al. Targeting C4-demethylating genes in the cholesterol pathway sensitizes cancer cells to EGF receptor inhibitors via increased EGF receptor degradation. Cancer Discov. 2013;3(1):96–111.
- Corominas J, Ramayo-Caldas Y, Puig-Oliveras A, et al. Analysis of porcine adipose tissue transcriptome reveals differences in de novo fatty acid synthesis in pigs with divergent muscle fatty acid composition. BMC Genomics. 2013;14(1):843–857.
- Le Lay S, Krief S, Farnier C, et al. Cholesterol, a cell size-dependent signal that regulates glucose metabolism and gene expression in adipocytes. J Biol Chem. 2001;276(20):16904–16910.
- Jazet IM, Pij H, Meinders AE. Adipose tissue as an endocrine organ: impact on insulin resistance. Neth J Med. 2003;61(1):194–212.
- McGown C, Birerdinc A, Younossi ZM. Adipose tissue as an endocrine organ. Clin Liver Dis. 2014;18(1):41–58.
- MacDougald OA, Lane MD. Transcriptional regulation of gene expression during adipocyte differentiation. Annu Rev Biochem. 1995;64(1):345–373.
- Musri MM, Gomis R, Párrizas M. Chromatin and chromatin-modifying proteins in adipogenesis. Cell Biol. 2007;85(4):397–410.
- Jacobs EJ, Newton CC, Thun MJ, et al. Long-term use of cholesterol-lowering drugs and cancer incidence in a large United States cohort. Cancer Res. 2011;71(5):1763–1771.
- Simigdala N, Gao Q, Pancholi S, et al. Cholesterol biosynthesis pathway as a novel mechanism of resistance to estrogen deprivation in estrogen receptor-positive breast cancer. Breast Cancer Res. 2016;18(1):58–62.
- Caldas H, Herman GE. NSDHL, an enzyme involved in cholesterol biosynthesis, traffics through the Golgi and accumulates on ER membranes and on the surface of lipid droplets. Hum Mol Genet. 2003;12(22):2981–2991.
- van der Meer DL, Degenhardt T, Vaisanen S, et al. Profiling of promoter occupancy by PPARalpha in human hepatoma cells via ChIP-chip analysis. Nucleic Acids Res. 2010;38(9):2839–2850.
- Bougarne N, Paumelle R, Caron S, et al. PPARalpha blocks glucocorticoid receptor alpha-mediated transactivation but cooperates with the activated glucocorticoid receptor alpha for transrepression on NF-kappaB. Proc Natl Acad Sci U S A. 2009;106(18):7397–7402.
- Li B, Qiao L, An L, et al. Transcriptome analysis of adipose tissues from two fat-tailed sheep breeds reveals key genes involved in fat deposition. BMC Genomics. 2018;19(1):338–350.
- Resnyk CW, Carré W, Wang X, et al. Transcriptional analysis of abdominal fat in chickens divergently selected on bodyweight at two ages reveals novel mechanisms controlling adiposity: validating visceral adipose tissue as a dynamic endocrine and metabolic organ. BMC Genomics. 2017;18(1):626–656.
- Chen FF, Wang YQ, Tang GR, et al. Differences between porcine longissimus thoracis and semitendinosus intramuscular fat content and the regulation of their preadipocytes during adipogenic differentiation. Meat Sci. 2018;147(1):116–126.
- Yun J, Jin H, Cao Y, et al. RNA-Seq analysis reveals a positive role of HTR2A in adipogenesis in yan yellow cattle. Int J Mol Sci. 2018;19(6):e1760.