
ABSTRACT
Considerable evidence suggest that a variety of Long-non-coding RNAs (LncRNAs) are widely implicated in several neurodegenerative disorders. The present study aims to investigate the regulatory effect of LncRNA 17A in an in vitro model of Alzheimer’s disease (AD). AD cell model was established by treating the SH-SY5Y cells with amyloid β peptide 1-42, and then the cells were transfected with 17A shRNA and pcDNA-17A. Apoptosis, migration, invasion and ELISA assays were performed to investigate the effect of differentiated 17A expression level on AD cell line. It was determined that 17A-overexpressing promotes autophagy, induces neurodegenration and deactivates GABAB signaling. In conclusion, our results demonstrated that the dysregulation of LncRNA 17A was involved in cellular functions and biological processes of neuroblastoma cells in an AD cell model, shedding light on the diagnostic value and therapeutic potential of LncRNA 17A for AD intervention.
Graphical Abstract
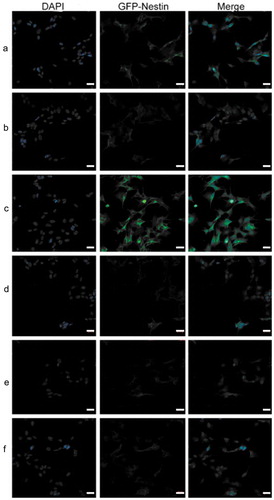
Nestin expression was remarkably enhanced in shRNA‑17A‑transfected cells (group C), compared with that in pcDNA-17A‑transfected cells (group E).
Alzheimer’s disease (AD) is the most common progressive dementia symptom, constituting more than 80% of dementia incidence in people older than 65 [Citation1]. Clinically, AD is characterized by irreversible deterioration of cognitive functions, the presence of amyloid plaques, as well as the accumulation of neurofibrillary tangles in the hippocampal region of the brain [Citation2]. Recent knowledge about the variation in the risk of AD contributing to amyloid-β (Aβ) processing have evolved remarkably, however, its etiology remains obscure and its effective treatment is not yet available [Citation3,Citation4].
Figure 8. Immunofluorescent staining showed that the LC3B secretion was remarkably enhanced in shRNA‑17A‑transfected cells, compared with that in pcDNA-17A‑transfected cells. (a) Normal SH-SY5Y cells; (b) negative control; (c) SH-SY5Y cells transfected with 17A shRNA; (d) scramble control; (e) SH-SY5Y cells transfected with pcDNA-17A; (f) cells transfected with pcDNA-control.
Scale bar, 20 μm. Merged images were shown in each row. In the merged images red indicates the presence of LC3B. Nuclei were counterstained with DAPI and are shown in blue.
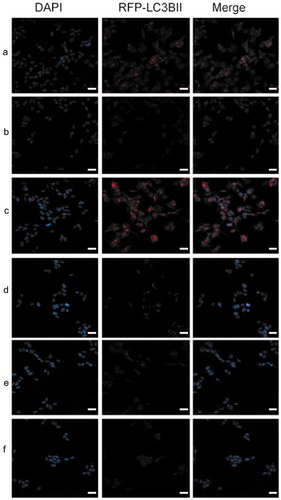
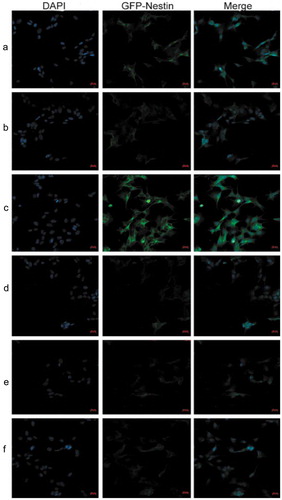
Figure 9. Immunofluorescent staining indicated that Nestin expression was remarkably enhanced in shRNA‑17A‑transfected cells, compared with that in pcDNA-17A‑transfected cells. (a) Normal SH-SY5Y cells; (b) negative control; (c) SH-SY5Y cells transfected with 17A shRNA; (d) scramble control; (e) SH-SY5Y cells transfected with pcDNA-17A; (f) cells transfected with pcDNA-control.
Scale bar, 20 μm. Merged images were shown in each row. Nuclei were counterstained with DAPI (shown in blue).
Characterized as transcripts longer than 200 nucleotides (nt) without apparent indication of protein coding function, Long noncoding RNAs (LncRNAs) were originally regarded as a nonfunctional byproduct of RNA polymerase [Citation5]. However, evidence from the last decade suggested that LncRNAs play an important role in transcription, post-regulation, and epigenetics [Citation6]. LncRNAs are abundantly expressed in mammalian central nervous system, making it possible for swift response to environmental and molecular changes [Citation7]. Moreover, it was reported that LncRNAs are involved in the biological and physiological process of several neurodegenerative disorders, such as Alzheimer’s disease, Parkinson disease, and Huntington disease [Citation8]. Mus E et al., reported that the up-regulation of BC200 RNA in AD brains was specific to brain areas involved in AD and was in parallel with AD progression. Moreover, the mis-localization and over-expression of BC200 RNA may be reactive-compensatory to the deterioration in AD neurons [Citation9].
Evidence suggested that accumulation of β-amyloid peptide (Aβ) in the brain gives rise to the onset of AD [Citation10,Citation11]. Faghihi et al., identified that exposure to Aβ1-42 resulted in elevated expression of BACE1-AS and increased BACE1 mRNA stability, generating additional Aβ 1-42 through post-transcriptional feed-forward mechanism [Citation12]. Modi et al., determined that the exposure of cortical neurons to neurotoxic Aβ1-42 peptide resulted in unscheduled cell cycle re-entry, and consequently excessive apoptosis [Citation13]. Massone et al., revealed that LncRNA 17A expression was enhanced in the cerebral tissues derived from patients afflicted with AD, and modulated the secretion of Aβ [Citation14].
GABA (γ-aminobutyric acid) is an inhibitory neurotransmitter in the mammalian CNS. GABA (γ-aminobutyric acid) is an inhibitory neurotransmitter in the mammalian CNS. GABA exerts its effects through ionotropic receptors, GABAA and GABAC, to produce synaptic inhibition, and metabotropic receptor GABAB, to produce prolonged inhibitory signals. GABAB receptor (GABABR) plays a part in the regulation of microglia function and neuro-inflammation, and GABABR2 is involved in the inhibition of synaptic transmission. The activity of GABABR2 is under the regulation of G-proteins which inhibit adenylyl cyclase activity, stimulates phospholipase A2, activate potassium channels [Citation15]. It was reported that GABABR are implicated in DAT (dementia of the Alzheimer type) pathology, and that the up-regulation of GABABR2 inhibits the release of pro-inflammatory cytokines [Citation16]. Brown et al., indicated that the subtypes of GABA receptors are implicated with oscillatory activity associated with memory and cognitive function [Citation17]. In our study, the protein expression of GABABR2 was compared among the cells with different 17A levels.
Autophagy is a catabolic process for the autophagosomic-lysosomal degradation of bulk cytoplasmic contents. Previous evidence demonstrated that autophagy is a crucial cellular process which helps to avoid the deposition of abnormal proteins in a number of neurodegenerative diseases [Citation18]. Normally, autophagy acts as a protective factor against AD progression associated with intracytoplasmic Aβ and tau aggregates. The up-regulation of autophagy can also be a favorable indication in the treatment of AD. During autophagy, LC3 is cleaved at the carboxy terminus immediately following synthesis to yield a cytosolic form LC3-I. Afterwards, LC3-I is converted to LC3-II that allows for LC3 to be associated with autophagic vesicles [Citation19]. In the current study, we examined the expression levels of LC3BII to evaluate the effect of various 17A expression on autophagy.
Decline of neurogenesis may result in various level of cognitive impairment. Meanwhile, decreased generation of neural stem cells (NSCs) is often observed during the progression of AD [Citation20]. Upon differentiation, nestin expression tends to diminish and will be replaced by tissue-specific intermediate filament (IF) proteins. Moreover, nestin expression can be re-induced in the adult in the event of pathological situations [Citation21]. Given that neurogenesis is closely associated with AD, broadening the knowledge about the alterations in neurogenesis is necessary to contribute to a better understanding of AD pathophysiology.
Based on the findings and reviews mentioned above, we investigated that the impact of down- and up-regulation LncRNA 17A using shRNA technology and overexpression vector in an in vitro AD cell model. We analyzed and compared the invasion, migration, apoptosis, cell cycle, Aβ1-42 production, and autophagy of AD cells. Our data found that the depletion of 17A inhibits cell apoptosis, migration and invasion, promotes autophagy and reverses neuro-degeneration. Here, we report that LncRNA 17A is a potentially useful target for AD therapeutic intervention.
Materials and methods
Cell cultures and Aβ1‑42 treatment
SH-SY5Y cell line was obtained from the American Type Culture Collection (Manassas, VA, USA) and experiment protocol was approved by the ethnic committee of our hospital. The AD cell model was established according to the protocol of Isobe I et al [Citation22]. The SH‑SY5Y cells were seeded in a six‑well plate in DMEM supplemented with 10% fetal calf serum, penicillin (100 U/ml) and glutamine (0.3 mg/ml; Invitrogen, NY, USA) and were then incubated in a 5% CO2 humidified atmosphere at 37℃. The medium was changed twice a week until 80% confluence was achieved. Before adding Aβ1-42 peptide, the cell cultures were incubated overnight in medium containing 1.5% FBS. Synthetic Aβ1-42 (Sigma‑Aldrich, MO, USA) was dissolved and the stock solution (400 µM in 0.5% acetic acid) was then added to the cultures to ensure a predetermined final concentration. After 24 hours, the medium was replaced with fresh normal cell medium for continued culture. When the incubation came to an end, the medium was removed from the cultures. The cells were washed with PBS and then centrifuged at a speed of 500 g for 5 min at 4℃. The sedimented cells were lysed by suspending in hypotonic medium (1 mM NaHCO3, 5 mM MgCl2, 5 µg/ml AEBSF) for 3 min on the ice.
RNA extraction and q-RT PCR analysis
Total RNAs were extracted from 6 groups of cells with Trizol (Invitrogen, CA, USA) and all total Nucleic Acid Isolation Kit was used (Ambion Inc., USA), according to the manufacturer’s instruction. RNAs were reverse transcribed using PrimeScriptTM RT-PCR Kit (Takara) in the presence of 50 units of MultiScribe Reverse Transcriptase (Thermo Fisher, cat#4311235) in a total of 20 uL with the following conditions: denaturing at 95°C for 5 min, prior to 40 cycles of amplification at 95°C for 30s, then 60°C for 30s and 72°C for 30s. Every sample was assayed in triplicate to quantify the mean delta Ct values, and SD (standard deviation). The expression levels of miRNA were normalized to the relative quantities of GAPDH. The sequences of Real-time RT PCR primers were designed by Primer Express 1.5 software. 17A forward 5ʹ-CCACCCTGAACT GACACAT-3ʹ, and backward 5ʹ-GCAAAGGTGCTAATCTTGACTCTTG-3ʹ. GAPDH: forward 5ʹ-ATTGCCCTCAACGACCACTTT-3ʹ and backward 5ʹ- TTGCTGTAGCCAAATTCGTT-3ʹ.
Construction of 17A expression plasmids and transfection
17A shRNA and scrambled shRNA sequence, pcDNA-17A and pcDNA-control (pcDNA 3.1 expression vector) were purchased from GenePharma (Shanghai, China). Lipofectamine 2000 transfection reagent (Invitrogen) was used for transfection of 17A shRNA, scrambled shRNA sequence, pcDNA-17A plasmids, and vehicles into SH-SY5Y cells. 17A knockdown percentage was about 67%.
Western blotting analysis
GABABR2 antibody (1: 1000, cat#ab75838) was purchased from Abcam (Cambridge, U.K.). β-actin antibody (1:1000, #A2066, Sigma Aldrich) was used as internal control. Cells were washed in cold PBS and subjected to lysis at 4℃ in lysis buffer (50 mM Tris-HCl pH 7.4, 150 mM NaCl, 1 mM EDTA, 1% Triton X-100) supplemented with a cocktail of protease inhibitors (Merck Millipore). Cell debris were removed by centrifuging the lysates at 16,000 rpm for 20 min. Protein concentration was quantified using protein quantification kit (Thermo Fisher). 40 ug protein extracts were separated and fractionated using SDS–PAGE gel and were then transferred to PVDF membranes (Merck Millipore, M.A., USA). Afterwards, the membrane was blocked with PBS supplemented with 5% non-fat milk overnight at 4°C, and was incubated with the GABABR2 antibody for 2 h at RT. β-actin level was examined on the same membranes. After washing the membrane with TBST, the membranes were incubated with HRP-conjugated goat anti-rabbit IgG secondary antibody for 1 h at RT. After washing, the bands of interest were revealed with ECL (Merck Millipore).
Cell cycle analysis
SH-SY5Y cells of each group were trypsinized, collected, centrifuged and washed three times. Cell density was adjusted to 1 × 10⁶ cells/ml, and was fixed in 75% ethanol at −20℃ for 12 h. After the fixation, cells were washed with cold PBS and stained with 0.5 ml of PI buffer at 37℃ for 30 min in the dark. Cell Cycle analysis was conducted using Flow Cytometry (BD Biosciences, San Jose, CA, USA), at the laser wavelength of 488 nm. Cell cycle analysis kit was purchased from BD Bioscience. The DNA in the cells was stained using DNA binding dye. The percentage of cells in each cell phases (G0/G1, S and G2/M) was calculated and compared. Each test was conducted in triplicate.
Cell migration and invasion assay
The six treatment groups of SH-SY5Y cells, including normal, negative control, 17A inhibition, scrambled control 1, 17A overexpression and scrambled control 2, were seeded at a density of 6 × 10⁵ cells per well in 6-well culture plates. The cells were trypsinized, and were washed with PBS and resuspended in serum-free RPMI-1640 medium. Cell migration assay was performed in a 24-well Transwell unit (Corning, USA). The lower chambers of the Transwell units were filled with serum-free medium, while the upper chambers were seeded with 1 × 10⁴ cells from each treatment group. After an overnight incubations, SH-SY5Y cells which had passed through the filter were counted, and the number was expressed in the form of the percentage of the sum of the cells in the upper and lower wells. Cell invasion assay was performed in a 24-well Transwell unit coated with Matrigel (cat no. 354578; BD, USA) at a concentration of 1 mg/ml, according to the manufacturer’s instructions. The lower chambers of the Matrigel-coated Transwell units were filled with serum-free medium, while the upper chambers were seeded with 1 × 10⁴ cells from each treatment group in triplicate wells. Cells were incubated in a 5% CO2 atmosphere at 37°C for 24 h. Cells which were able to pass through the Matrigel-coated filter membrane were viewed as invasion. These invading cells from each treatment group were numbered and the percentage of cells in the upper and lower wells were calculated. Experiments were performed in triplicate.
Immunofluorescence
SH-SY5Y cells subject to different treatments were adhered onto the coverslips, and were washed with PBS three times, and were fixed for 5 min using 0.5 ml cold 100% methanol (prestored in −20℃). Cells were incubated with the primary antibody overnight at 4℃. LC3B antibody (#ab48394, 1:200) antibody and Nestin antibody (#ab6320, 1:150) were purchased from Abcam. After incubation, the antibody was washed away by letting TBST flow through the coverslips and the washing solution was removed. Each coverslip were washed 3 times with about 2 ml TBST each time. After that, cells were incubated with fluorochromecon-conjugated secondary antibodies for 2 h at RT. After incubation, the coverslips were washed in the same way mentioned above. IF image were captured using a confocal microscope (Carl Zeiss Axioskop, Germany), under the magnification of 200.
Cell apoptosis analysis
For cellular apoptosis assay, six groups of SH-SY5Y cells were plated on 6-well plates at a density of 2 × 10⁵ cells per well. Cells were trypsinized, collected, centrifuged, and washed three times with PBS. Afterwards, the cells were re-suspended in 250 μL binding buffer at a concentration of 1 × 10⁶ cells/mL. Each group of cells was stained with 5 µL Annexin V (1 mg/mL) (ebioscience, CA, USA) at RT for 15 mins. After that, propidium iodide (1 mg/mL) was used for cell staining for 5 mins before flow cytometry assay. Each test was repeated three times, separately.
ELISA assay
Human Amyloid β40 Brain ELISA Kit (cat no.EZBRAIN40, Merck Millipore) and Human Amyloid β42 Brain ELISA Kit (cat# EZBRAIN42, Merck Millipore) were purchased from Merck Millipore (Billerica, M.A. USA.). SH-SY5Y cells grown in the 12-well plates for 24 h in normal medium, were further cultured in low glucose DMEM without FBS (fetal bovine serum). After that, the medium was collected and was centrifuged at 1,000 g to remove cellular debris. All reagents in the kit and cell supernatant were brought to RT prior to tests.100 μl cell supernatants from each group were collected from the medium, and then were tested using the ELISA kits specific to Aβ40 (EZBRAIN40) and Aβ42 (EZBRAIN42), according to the manufacturer’s instructions.
Statistical analysis
Statistical analysis was performed using SPSS 21.0 (SPSS, Inc., Chicago, IL). Quantitative data were presented in the form of mean values ± standard error of mean (SEM) obtained from at least three independent experiments. Comparisons among the groups were analyzed using one-way
ANOVA with Newman-Keuls post hoc comparison. A p value less than 0.05 was considered statistically significant.
Results
The exploration of 17A expression level in SH-SY5Y cells
To modulate the expression of 17A in SH-SY5Y cells, we constructed a 17A overexpression plasmid (pcDNA-17A) and shRNA-17A plasmid, and transfected the SH-SY5Y cells with the plasmids as well as their corresponding controls. We analyzed the expression patterns of 17A mRNA in the SH-SY5Y cells subjected to different treatment using the quantitative RT-PCR method. As shown in ., our data found that the expression level of 17A was significantly enhanced in negative control (NC) cells which had been treated with Aβ 1-42 peptide, compared with that of the normal cells (P < 0.05). In parallel with that, we determined that 17A mRNA expression level was reduced after 17A shRNA transfection and was enhanced with pcDNA-17A transfection (P < 0.05).
Figure 1. qRT-PCR was used to measure 17A expression in the SH-SY5Y cells.
(Data were presented in the form of mean ± S.E.M, based on three independent experiments. ** and *** indicate a significant level at P < 0.01 and P < 0.001, respectively, in comparison with controls.)
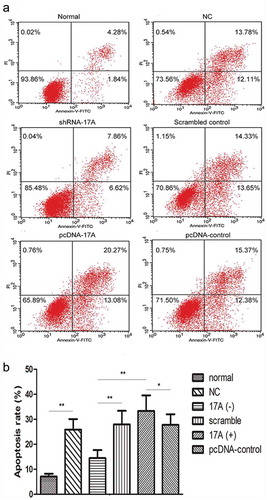
The proportion of apoptotic cells is decreased with 17A inhibition and was increased with 17A over-expression
We performed the Annexin V apoptosis assay to determine the proportion of apoptotic cells, and found that 17A shRNA interference inhibited cell apoptosis, compared with that of scrambled control (*P < 0.01). On the contrary, pcDNA-17A transfection into SH-SY5Y cells exhibited an opposite effect, i.e. the percentage of apoptotic cells was significantly increased, in comparison with pcDNA-control and 17A-shRNA-interfered cells (*P < 0.01). These data demonstrated that 17A depletion inhibited cell apoptosis, whereas the up-regulation of 17A promoted apoptosis, as shown in .
Figure 2. Apoptosis rate of SH-SY5Y cells was measured by Annexin V-FITC staining. (a) The values shown in the lower left, lower right and upper left quadrants represent the proportion of viable, apoptotic and necrotic cells, respectively. (b) The proportion of apoptotic cells was significantly increased with 17A overexpression, and was significantly reduced with 17A depletion. (pcDNA-17A transfection v.s. pcDNA-control, *p < 0.05; normal SH-SY5Y cells v.s. negative control, shRNA-17A transfection v.s. scrambled control; shRNA-17A transfection v.s pcDNA-17A transfection; **p < 0.01).
The graphic results showed the mean ± SEM of three independent experiments. * and ** indicates significant difference at P < 0.05 and P < 0.01 level, respectively.
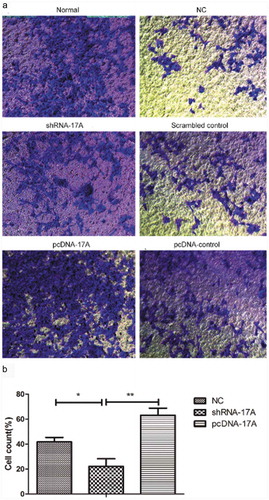
Down-regulated 17A represses the migration and invasion of SH-SY5Y cells
To determine the role of LncRNA 17A in the migration and invasion of SH-SY5Y cells, Transwell assay was conducted among the six groups of cells with different treatment. As shown in and , 17A overexpression promoted the migration and invasion of cells, while the down-regulation of 17A inhibited tumor cell migration and invasion.
Figure 3. 17A knockdown inhibited the migration of SH-SY5Y cells. (a) Representative images of SH-SY5Y cell migration; (b) The percentage of migrated cells was significantly lower in cells transfected with shRNA-17A, in comparison with that of NC (p < 0.05) and that of pcDNA-17A transfection (p < 0.01). (*p < 0.05, **p < 0.01).
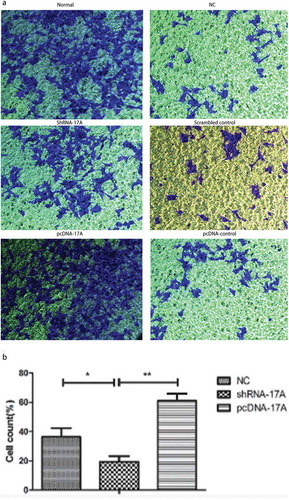
Figure 4. 17A overexpression activated the invasion of SH-SY5Y cells. (a) Representative images of SH-SY5Y cell invasion; (b) The percentage of invasive cells was significantly lower in cells transfected with shRNA-17A, compared with that of NC (p < 0.05) and pcDNA-17A transfection (p < 0.01). (*p < 0.05, **p < 0.01).
17A expression interferes with SH-SY5Y cell cycle, including G1-phase arrest
As seen in , the altered cell cycle distribution is closely associated with the up-regulation and down-regulation of 17A. 17A knockdown led to cell cycle arrest in G1 phase, while the overexpression of 17A notably increased the cells percentages in the S-phase. The results demonstrated that 17A expression was interfered with cell cycle, inducing G1-phase arrest.
Figure 5. 17A depletion contributed to cell cycle arrest. (a) 17A knockout significantly increased the percentage of cells in G1 phase, and decreased the cells percentage in S phase. (b) The percentage of cells in S phase was significantly increased with the overexpression of 17A. (Data were expressed as mean ± S.E.M. from three independent experiments; *P < 0.05).
Down-regulation of 17A reduces Aβ42 abundance
The expression levels of Aβ40 and Aβ42 are indicative of the progression of AD. Among the two peptides, Aβ42 is known as the major constituent of neuritic plaques and is considered to mediate the initial pathogenesis of AD. Here, we measured the levels of Aβ42 and Aβ40 in the supernatant by ELISA. Our data found that Aβ42 level was lower in shRNA-17A-transfected cells, yet was increased in pcDNA-17A-transfected cells. Our results showed that the overexpression of 17A amplified the ratio of Aβ42 to Aβ40, an indication of AD progression.
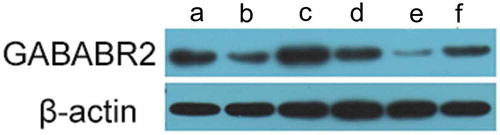
GABABR 2 protein expression is up-regulated with 17A knockdown and down-regulated with 17A overexpression
To examine the possible changes in the splicing activity induced by 17A differentiated expression, we performed western blotting assay to determine the protein expression of GABABR2 in the SH-SY5Y cells. As shown in , GABABR2 protein expression was up-regulated with lower 17A level and was down-regulated with higher 17A level.
Figure 6. The ratio of Aβ42 to Aβ40 was improved with the overexpression of 17A. (a) Aβ42 concentration was notably reduced in 17A-depleted cells and was increased in 17A-overexpressing SH-SY5Y cells, in comparison with negative control cells (**p < 0.01; ***p < 0.001); (b) Aβ40 concentration was markedly enhanced in 17A-depleted cells, and was reduced in 17A-overexpressing SH-SY5Y cells, compared with NC cells (**p < 0.01; ***p < 0.001).
Down-regulation of 17A activates autophagy
Autophagy is a biological process in which dysfunctional organelles and cellular components that are accumulated during growth and differentiation are degraded via the lysosome and recycled [Citation23]. Microtubule associated protein 1A/1B-light chain 3 (LC3) is the key biological marker to identify autophagy in mammalian systems. LC3-I is cytosolic and LC3-II is membrane bound and enriched in the autophagic vacuole fraction. The conversion of LC3-I to LC3-II is a useful indicator of autophagy in mammalian cells. In the work, we measured autophagy in the cells using fluorescence microscopy. As shown in , autophagy was promoted with the down-regulation of 17A, and was suppressed with 17A overexpression.
Figure 7. GABABR2 protein expression was up-regulated in 17A shRNA-transfected cells and down-regulated in pcDNA-17A transfected cells. (a) Normal culture SH-SY5Y cells; (b) SH-SY5Y cells cultured with Aβ 1-42 as negative control 1 42; (c) SH-SY5Y cells transfected with 17A shRNA; (d) Scrambled control; (e) SH-SY5Y cells transfected with pcDNA-17A; (f). SH-SY5Y cells transfected with pcDNA-control.
17A overexpression suppressed neurogenesis
To assess the effect of 17A on neurogenesis, nestin-GFP staining was conducted. It was observed that the number of nestin-positive cells was increased with 17A knockdown but was decreased with 17A overexpression.
Discussion
Alzheimer’s disease (AD) is a progressive brain disorder affecting approximately 40 million people around the globe. The incidence of AD grows with longer life expectancy, posing a grave socio-economic problem [Citation4]. Due to the regulatory role in gene expression patterns, LncRNAs has emerged as a class of regulatory molecules implicated in almost all the physiologic and pathologic process of neurodegenerative diseases over the decade [Citation24]. Previous review summarized that due to the highly cell-, tissue- and sequence-specificity of LncRNAs expressions, the specific regulation by LncRNA-targeting therapeutics is promising [Citation25,Citation26]. Numerous LncRNAs function through epigenetic modulation of chromatin, therefore targeting these LncRNAs can reverse or promote epigenetic modifications with high specificity [Citation27].
In the present study, we focused on exploring the effect of differentiated LncRNA17A expression level on the cellular and physiological processes in a cell model of AD. Accordingly, the human neuroblastoma SH-SY5Y cells were transfected with 17A-shRNA (scrambled shRNA as control) and overexpression plasmids (pcDNA as control) to evaluate the cell apoptosis, migration, invasion, autophagy and neurogenesis. We hope that this study can better illustrate the effect of LncRNA 17A in the physiologic and pathologic processes of AD.
Quantitative real-time PCR results showed that 17A was significantly up-regulated following the exposure to Aβ1-42 peptide. Moreover, the over-expression of 17A induced the apoptotic effect in SH-SY5Y cells, and promoted the migration and invasion capabilities of SH-SY5Y cells, following the transfection with pcDNA-17A. By comparison, cells transfected with shRNA-17A exhibited opposite effect. In other words, the down-regulation of 17A resulted in decreased percentage of apoptotic cells, as well as impaired migration and invasion capabilities.
Cell cycle play a vital part in the loss of neurons in AD. The cell cycle of neurons should be under suppression to maintain the potential of differentiation, and the loss of neurons caused by aberrant cell cycle reentry is a feature for neurodegenerative disorders such as AD [Citation28]. Webber et al., proposed that cell cycle dysregulation occurs in neurons susceptible to degeneration during AD is a potential causative factor which would initiate pathological events [Citation29]. The current study identified that lncRNA17A was involved in the cell cycle of neuroblastoma cells. Cell cycle arrest was found with cells transfected with shRNA-17A, resulting in an augmented percentage of cells in G1 phase. Our results were in agreement with these previous evidence, showing a significantly decreased percentage of apoptotic cells in the SH-SY5Y cells transfected with shRNA-17A, compared with those with 17A overexpression.
A plethora of evidence showed that the accumulation and deposition of Amyloid β peptide in the vulnerable brain provoke the neuronal loss in AD brains [Citation2,Citation7]. Aβ is derived from proteolysis of the β-amyloid precursor proteins (APP) by the β- and γ-secretases. The excessive secretion of hydrophobic Aβ1- 40 and Aβ1-42 induces the formation of amyloid plaques and leads to the progression of AD. Long Aβ tends to form non-soluble fibers and presents more neurotoxic properties, therefore increased Aβ 1-42 concentration is regarded as a hallmark in the pathogenesis of AD [Citation30]. In this study, ELISA assay was performed to determine the concentrations of Aβ 1-40 and Aβ1-42. Our results showed that Aβ1-42/Aβ1-40 ratio was lower in SH-SY5Y cells transfected with shRNA-17A. By comparison, 17A overexpression resulted in increased Aβ1-42/Aβ1-40 ratio.
Previous study reported that aberrant microglia functioning and the loss of GABAB receptors bring detrimental effects to clinical AD patients [Citation31]. Moreover the administration of an agonist of GABAB receptor in a cell culture inhibited the release of pro-inflammatory cytokines [Citation32]. Our analysis showed that GABABR2 expression was notably elevated with 17A-depletion and reduced with 17A-expression. In view of this, the down-regulation of 17A indicates favorable outcome in AD treatment.
The presence of LC3 in autophagosomes and the conversion of LC3 to the lower migrating form LC3-II have been used as indicators of autophagy [Citation33]. Protein degradation by constitutive autophagy is vital to avoid the excessive accumulation of polyubiquitinated protein aggregates, thereby preventing the initiation and progression of neurodegenerative diseases. In this work, we measured autophagy in the neurobalstoma cells using IF (), and determined that the percentage of LC3B-positive vesicles was higher in cells transfected with shRNA-17A, compared with those transfected with 17A-pcDNA. It is therefore postulated that 17 depletion promoted autophagy to alleviate the accumulation and deposition of protein aggregates, which proved effective to inhibit the progression of AD.
Nestin is a member of the intermediate filament (IF) protein family. Widely known as a maker of neural stem cells (NSC), nestin is expressed in proliferating cells during the developmental stages of embryonic and fetal tissues [Citation34]. Zeng Q et al., observed in a mouse model of AD that the expression of nestin were remarkably decreased with increased age compared with that of wild-type controls, indicating that impaired neurogenesis caused by AD leads to a gradual degeneration of neural progenitors (NPCs), and the inhibition of the differentiation and maturation of neurons [Citation35]. Similarly, in our experiment, we observed that the number of Nestin-positive cells was reduced with 17A overexpression, compared with pcDNA-control-transfected cells (). Conversely, Nestin-positive cells became increasingly prevalent with 17A-shRNA-transfected cells, in comparison with those in scrambled control group. Therefore, it can be determined that the up-regulation of 17A inhibit neurogenesis, while 17A depletion induce neurogenesis.
In conclusion, the present study comprehensively explored the effects of LncRNA 17A in AD cell model, demonstrating that the down-regulation of LncRNA 17A suppressed cell apoptosis, cell migration and invasion, interfered with cell cycle, promoted autophagy, reduced the ratio of Aβ 1-42/Aβ 1-40 secretion. Moreover, the up-regulation of 17A exhibited opposite effect of 17A down-regulation, triggering neurogenesis and differentiation. We hereby propose that therapeutic potential of LncRNA 17A could provide basis for the establishment of novel treatments for AD. The limitation of the study is that the experiments and assays were performed in SH-SY5Y cell model of AD, in vivo researches are needed to examine the biological and therapeutic effect of LncRNA 17A.
Author contributions
Xinhua Wang wrote the manuscript and conducted the experiments. Min Zhang designed and helped conduct the experiments. Hengfang Liu designed this experiment and revised the manuscript. All the authors have reviewed the manuscript before submission and have approved the final manuscript.
Acknowledgments
The authors would like to thank Professor Jianping Wang for revising this manuscript and providing the experimental equipment.
Disclosure statement
No potential conflict of interest was reported by the authors.
References
- Anand R, Gill KD, Mahdi AA. Therapeutics of Alzheimer’s disease: past, present and future. Neuropharmacology. 2014;76:27–50.
- Hardy J, Selkoe DJ. The amyloid hypothesis of Alzheimer’s disease: progress and problems on the road to therapeutics. Science. 2002;297(5580):353–356.
- De Strooper B, Annaert W. Novel research horizons for presenilins and γ-secretases in cell biology and disease. Annu Rev Cell Dev Biol. 2010;26:235–260.
- Janssen JC, Beck JA, Campbell TA, et al. Early onset familial Alzheimer’s disease: mutation frequency in 31 families. (ABN Abstracts). J Neurol Neurosurg Psychiatry. 2002;73(2):219–220.
- Gellert P, Ponomareva Y, Braun T, et al. Noncoder: a web interface for exon array-based detection of long non-coding RNAs. Nucleic Acids Res. 2012;41(1):e20–e20.
- Kapranov P, Cheng J, Dike S, et al. RNA maps reveal new RNA classes and a possible function for pervasive transcription. Science. 2007;316(5830):1484–1488.
- Qureshi IA, Mattick JS, Mehler MF. Long non-coding RNAs in nervous system function and disease. Brain Res. 2010;1338:20–35.
- Salta E, Strooper BD. Non-coding RNAs with essential roles in neurodegenerative disorders. Lancet Neurol. 2012;11:189–200.
- Mus E, Hof PR, Tiedge H. Dendritic BC200 RNA in aging and in Alzheimer’s disease. Proc Nat Acad Sci USA. 2007;104(25):10679–10684.
- Karran E, Mercken M, De Strooper B. The amyloid cascade hypothesis for Alzheimer’s disease: an appraisal for the development of therapeutics. Nat Rev Drug Discovery. 2011;10(9):698–712.
- Wirths O, Multhaup G, Bayer TA. A modified β‐amyloid hypothesis: intraneuronal accumulation of the β‐amyloid peptide–the first step of a fatal cascade. J Neurochem. 2004;91(3):513–520.
- Faghihi MA, Modarresi F, Khalil AM, et al. Expression of a noncoding RNA is elevated in Alzheimer’s disease and drives rapid feed-forward regulation of β-secretase. Nat Med. 2008;14(7):723–730.
- Modi PK, Jaiswal S, Sharma P. Regulation of neuronal cell cycle and apoptosis by microRNA 34a. Mol Cell Biol. 2016;36(1):84–94.
- Massone S, Vassallo I, Fiorino G, et al. 17A, a novel non-coding RNA, regulates GABA B alternative splicing and signaling in response to inflammatory stimuli and in Alzheimer disease. Neurobiol Dis. 2011;41(2):308–317.
- Fatemi SH, Folsom TD, Reutiman TJ, et al. Expression of GABA B receptors is altered in brains of subjects with autism. Cerebellum. 2009 Mar 1;8(1):64–69.
- Chu DC, Penney JB Jr, Young AB. Quantitative autoradiography of hippocampal GABAB and GABAA receptor changes in Alzheimer’s disease. Neurosci Lett. 1987;82(3):246–252.
- Brown JT, Davies CH, Randall AD. Synaptic activation of GABAB receptors regulates neuronal network activity and entrainment. Eur J Neurosci. 2007;25(10):2982–2990.
- Haughey NJ, Nath A, Chan SL, et al. Disruption of neurogenesis by amyloid beta-peptide, and perturbed neural progenitor cell homeostasis, in models of Alzheimer’s disease. J Neurochem. 2002;83(6):1509–1524.
- Tanida I, Minematsu-Ikeguchi N, Ueno T, et al. Lysosomal turnover, but not a cellular level, of endogenous LC3 is a marker for autophagy. Autophagy. 2005;1(2):84–91.
- Michalczyk K, Ziman M. Nestin structure and predicted function in cellular cytoskeletal organisation. Histol Histopathol. 2005;20(2):665–671.
- Wiese C, Rolletschek A, Kania G, et al. Nestin expression–a property of multi-lineage progenitor cells? Cell Mol Life Sci. 2004;61(19–20):2510–2522.
- Isobe I, Yanagisawa K, Michikawa M. A possible model of senile plaques using synthetic amyloid β-protein and rat glial culture. Exp Neurol. 2000;162(1):51–60.
- Boland B, Kumar A, Lee S, et al. Autophagy induction and autophagosome clearance in neurons: relationship to autophagic pathology in Alzheimer’s disease. J Neurosci. 2008;28:6926–6937.
- Maoz R, Garfinkel BP, Soreq H. Alzheimer’s disease and ncRNAs. In: Neuroepigenomics in aging and disease. Cham: Springer; 2017. p. 337–361.
- Djebali S, Davis CA, Merkel A, et al. Landscape of transcription in human cells. Nature. 2012;489(7414):101.
- Gutschner T, Diederichs S. The hallmarks of cancer: a long non-coding RNA point of view. RNA Biol. 2012;9(6):703–719.
- Briggs JA, Wolvetang EJ, Mattick JS, et al. Mechanisms of long non-coding RNAs in mammalian nervous system development, plasticity, disease, and evolution. Neuron. 2015;88(5):861–877.
- Busser J, Geldmacher DS, Herrup K. Ectopic cell cycle proteins predict the sites of neuronal cell death in Alzheimer’s disease brain. J Neurosci. 1998;18(8):2801–2807.
- Webber KM, Raina AK, Marlatt MW, et al. The cell cycle in Alzheimer disease: a unique target for neuropharmacology. Mech Ageing Dev. 2005;126(10):1019–1025.
- Klein WL, Krafft GA, Finch CE. Targeting small Aβ oligomers: the solution to an Alzheimer’s disease conundrum? Trends Neurosci. 2001;24(4):219–224.
- Iwakiri M, Mizukami K, Ikonomovic MD, et al. An immunohistochemical study of GABAA receptor gamma subunits in Alzheimer’s disease hippocampus: relationship to neurofibrillary tangle progression. Neuropathology. 2009;29(3):263–269.
- Kuhn SA, van Landeghem FK, Zacharias R, et al. Microglia express GABAB receptors to modulate interleukin release. Mol Cell Neurosci. 2004;25(2):312–322.
- Cuervo AM, Bergamini E, Brunk UT, et al. Autophagy and aging: the importance of maintaining” clean” cells. Autophagy. 2005;1(3):131–140.
- Arnold SE, Hyman BT, Flory J, et al. The topographical and neuroanatomical distribution of neurofibrillary tangles and neuritic plaques in the cerebral cortex of patients with Alzheimer’s disease. Cereb Cortex. 1991;1(1):103–116.
- Zeng Q, Zheng M, Zhang T, et al. Hippocampal neurogenesis in the APP/PS1/nestin-GFP triple transgenic mouse model of Alzheimer’s disease. Neuroscience. 2016;314:64–74.