
ABSTRACT
PercevalHR (Perceval High Resolution) is an artificially designed fluorescent protein, which changes its excitation spectrum based on the ADP/ATP ratio of the environment. Here we demonstrated that PercevalHR can be used for monitoring energy status of Saccharomyces cerevisiae cells, which are affected by diauxic shift and mitochondria inhibition, in a non-invasive and non-destructive manner.
Graphical abstract
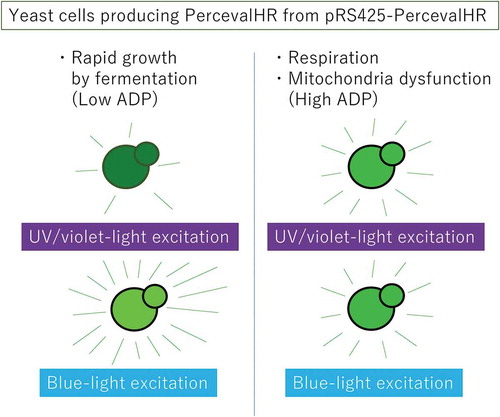
Yeast cells producing PercevalHR emit green fluorescence, excitation spectrum of which varies dependently on cellular ATP/ATP ratio.
To date, a number of genetically encoded fluorescent biosensors have been developed as reviewed in Ref [Citation1]. They are modified versions of fluorescent proteins and change their fluorescence properties depending on specific surrounding conditions, such as pH, redox, temperature and abundance of a specific small molecule or metal ion. When genetically expressed in cells, such biosensors emit fluorescent signals, which can be quantitatively detected using fluorescence microscopic or flowcytometric techniques. This methodology allows researchers to monitor a specific intracellular status in a quick, non-invasive and non-destructive manner.
Perceval is a fluorescent biosensor that has been artificially created through genetic connection of fragments of the GFP variant Venus and the bacterial ATP/ADP-binding protein GlnK1 [Citation2]. While ADP and ATP are competitively captured by Perceval, its excitation spectrum is more affected by ATP than ADP because ATP leads to a drastic conformational change of GlnK1. PercevalHR (High Resolution) is an improved version of Perceval with higher sensitivity for ADP/ATP ratio [Citation3]. The excitation spectrum of PercevalHR has two peaks (500 nm and 420 nm), and the ratio of the heights of these two peaks varies depending on the ADP/ATP ratio of surrounding (longer-wavelength excitation upon ATP binding). In contrast, the emission spectrum (peak at 520 nm) is unchanged. Although PercevalHR was used for imaging energy status in mammalian cells [Citation3], to our knowledge, no report has shown usage of Perceval or PercevalHR in fungal species including yeast cells.
Saccharomyces cerevisiae cells proliferate rapidly during the log phase in glucose-based media through the production of ATP from ADP by glycolysis, namely fermentation, while mitochondrial respiration is induced upon exhaustion of glucose. This switch from fermentation to aerobic respiration is known as diauxic shift and is accompanied by a global change in the cellular status [Citation4]. Possibly because of low performance of the mitochondrial F1/F0-ATP synthase [Citation5], S. cerevisiae cells produce ATP less effectively and grow slowly in the respiratory phase. Thus, for physiological and energetical studies of yeast cells including those on diauxic shift, monitoring intracellular ADP/ATP ratio could provide important information.
Materials and methods
Plasmid and yeast strain
In the present study, the PercevalHR-coding sequence flanked by the S. cerevisiae strong TDH3 promoter and CYC1 transcription terminator was cloned into pRS425, which is an S. cerevisiae YEp-type vector carrying the LEU2 selectable marker [Citation6]. The resulting plasmid, named as pRS425-PercevalHR, together with its sequence information is now available in the National BioResource Project (http://yeast.nig.ac.jp/yeast/top.xhtml; NBRP ID: BYP9646).
Throughout this study, we employed S. cerevisiae strain KMY1005 (MATα ura3 leu2 his3 trp1 lys2; Ref [Citation7].) carrying the indicated plasmids, and cultured it in standard synthetic glucose (dextrose) medium (SD medium) supplemented with auxotrophic requirements at 30°C. Culture optical density (OD600) were monitored by using the SmartSpec3000 spectrophotometer (BioRad).
Microscopy and image analysis
Cells were observed under the Keyence BZ-9000E fluorescence microscope equipped with the objective lens CFI Plan Apo λ100xH (Nikon). As described in Ref [Citation8], florescence images were observed using the filter set OP-79301 (excitation wavelength, 472.5/30; dichroic mirror wavelength, 495; emission, 520/35) for excitation with blue light (1.0-sec exposure) and a custom-made filter set (excitation wavelength, 395/25; dichroic mirror wavelength, 495; emission, 510/20) for excitation with UV/violet light (1.5-sec exposure).
To obtain quantified data from the microscopic analysis, approximately 4 to 10 cells showing bright fluorescence were selected from one view field, in which more than 100 cells existed, and the fluorescent-signal intensity of each cell and background signal intensity were measured using the image processing program ImageJ. Perceval HR fluorescent intensity ratio of a cell was obtained through the following formula, [{(fluorescent intensity of a UV/violet-light excited cell)-(background fluorescent intensity of the UV/violet-light excited field)}/{(fluorescent intensity of the blue-light excited cell)-(background fluorescent intensity of the blue-light excited field)}]. More than 50 cells were analyzed per condition, and their data distribution is expressed as a standard box-and-whisker plot in ).
Biochemical assay for cellular ADP/ATP ratio
After harvest, cells were quickly lysed in 80°C hot buffered ethanol (HEPES 10 mM, 75% ethanol, pH 7.1) with occasional top-speed vortexing (15 sec each with 30 sec interval; 3 times; Ref [Citation9]). The resulting cell extracts were then dried up by evaporation and checked for ADP/ATP ratio using EnzyLight ADP/ATP Ratio Assay Kit (BioAssay Systems), by which ATP amount is measured by D-luciferin and firefly luciferase-based luminescence, while ADP amount is measured through its enzymatic conversion to ATP.
Results and discussion
Probably because of high expression of PercevalHR, cells carrying pRS425-PercevalHR grew slightly slowly (); compare the pRS425-Perceval cells (without antimycin A, gray closed square) to the pRS425 cells (without antimycin A, black closed diamond). It should be noted that the PercevalHR fluorescent signal was sometimes hardly detected quantitatively under our experimental conditions described below when it was expressed at lower levels. We think that the growth retardation approximately 12-hr after culture start represents diauxic shift, because, after this time point, cells accumulated reactive oxygen species, which are byproducts of mitochondrial respiration (data not shown).
Figure 1. Expression of PercevalHR in S. cerevisiae cells.
(a) KMY1005 cells transformed with pRS425-PercevalHR or pRS425 were grown in liquid SD medium, and optical density of the culture was checked as described in the Materials and Methods section. Antimycin A (final concentration of 20 µg/ml) was added into the medium upon culture start. (b) KMY1005 cells transformed with pRS425-PercevalHR or pRS425 were cultured without antimycin A as done in panel A, and observed under the fluorescence microscope.
We then observed cells carrying pRS425-PercevalHR as described in the Materials and Method section. According to the fluorescent images shown in ), PercevalHR was diffusively and uniformly distributed in the cells with dark circles representing vacuoles (compare the fluorescent images with the light-field images). As expected, cells transformed with the empty vector pRS425 did not exhibit any fluorescence ()).
We next quantitated the fluorescence intensity of cells carrying pRS425-PercevalHR as described in the Materials and Methods section. The ratios of the green fluorescence intensity of UV/violet light-illuminated cells against that of blue light-illuminated cells were significantly different between pre and post diauxic shift (); compare box 3 with boxes 1 and 2). The shorter-wavelength shift in the PercevalHR-excitation light along diauxic shift is consistent with our expectation, since, as aforementioned, mitochondrial respiration is known to produce ATP slower than fermentation.
Figure 2. Change in ADP/ATP ratio in S.cerevisiae cells.
(a) Fluorescent images were obtained and quantitated as described in the Materials and Methods section. *** p < 0.001. (b) KMY1005 cells carrying pRS425 or pRS425-PercevalHR were subjected to biochemical analysis for cellular ADP/ATP ratio as described in the Materials and Methods section. Antimycin A (final concentration of 20 µg/ml) was added into the medium upon culture start.
When cells were cultured in the presence of the mitochondrial inhibitor antimycin A, the shorter shift in the excitation wavelength was more drastic in the case of the 15-hr-cultured post-diauxic-shift samples (), compare box 6 with 3). Such an effect of antimycin A was also observed in the case of 9-hr-cultured late log-phase samples (), compare box 5 with 2) but not in the case of 3-hr-cultured early log-phase samples (), compare box 4 with 1). This result may reflect a contribution of mitochondrial respiration for ATP production in late log phase, and is consistent with slight growth retardation by antimycin A at this time point (), compare pRS425-PercevalHR cells cultured with antimycin A (open circle) to those cultured without antimycin A (gray closed square)).
In the experiment shown in ), cells were cultured as done ) and (a) and biochemically checked for the cellular ADP/ATP ratio as shown in the Materials and Methods section. We then noticed that cellular expression of PercevalHR did not considerably affect the cellular ADP/ATP ratio (), see the leftmost two columns). Moreover, it should be noted that changing pattern upon long-time culturing and/or antimycin A treatment shown in ) did not largely differ from that shown in ). This result indicates that PercevalHR actually acts as a probe for the cellular ADP/ATP ratio.
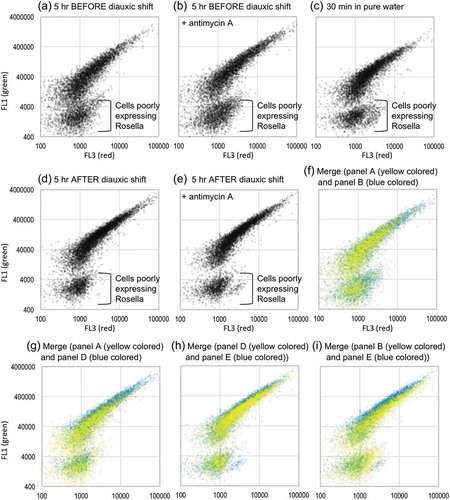
Perceval and Perceval HR have been reported to change their excitation spectra not only depending on the ADP/ATP ratio, but also by the surrounding pH condition (shorter-wavelength shift by acidic conditions). In order to confirm that the changes in the fluorescence-intensity ratio shown in ) are not because of intracellular pH, we monitored it using another cytosolic fluorescent reporter protein Rosella, which is a fusion of a pH-sensitive GFP variant (low fluorescence under low pH condition) and a pH-resistant red fluorescent protein. As shown in , cells transformed with the Rosella-expression plasmid pAS1NB c Rosella I [Citation10] were analyzed by dual-color flowcytometry using the BD Accuri C6 flowcytometer. Consistent with a previous report showing that severe nutrient depletion lowers cytosolic pH in S. cerevisiae cells [Citation11], suspension of Rosella-expressing cells in pure water seemed to decrease the green fluorescence of Rosella (, lower position of the plots in panel (c) in comparison with the other panels). On the other hand, cellular treatment with antimycin A or diauxic shift did not seem to change the fluorescent property of Rosella or did slightly increased its green fluorescence (see the merged data shown in panels (f) to (i)). We thus think that, at least under the experimental conditions employed in this study, diauxic shift and/or antimycin A treatment did not result in acidification of the cytosol.
Figure 3. Change in the fluorescence property of Rosella in S. cerevisiae cells.
KMY1005 cells transformed with pAS1NB c Rosella I were cultured as per or suspended in pure water for 10 min before flowcytometric analysis (threshold setting: FCS 8,000 and FL2 500). The time point of diauxic shift was determined according to cellular growth and ROS production (data not shown). Dead cells with high autofluorescence (the FL4 values of more than 900) are not shown in the plots. Antimycin A (final concentration of 20 µg/ml) was added into the medium upon culture start.
In conclusion, by using the fluorescent reporter protein PercevalHR, we successfully demonstrated increment of the intracellular ADP/ATP ratio upon diauxic shift, which is enhanced by the mitochondrial inhibitor antimycin A, in yeast cells. We anticipate that PercevalHR and its expression plasmid pRS425-PercevalHR are valuable tools for physiological and pathological studies using yeast cells as a model organism. This technique can be an alternative to the biochemical assays, which is accompanied with cell disruption and may cause an unexpected experimental error, for example, caused by ATP hydrolysis during cell lysis.
Author contribution
PTMN and YIK constructed DNA plasmids and performed the experiments. YK designed the experiments and completed the manuscript.
Acknowledgments
We deeply thank to Prof. Kenji Kohno and Prof. Hiroshi Takagi (Nara Inst. Sci. Tech.) for a wide variety of valuable supports, which have been indispensable for this study. The original PercevalHR plasmid, GW1-PercevalHR, was a gift from Dr. Gary Yellen (Addgene plasmid # 49082). pAS1NB c Rosella I was a gift from Dr. Mark Prescott (Addgene plasmid # 71245).
Disclosure statement
No potential conflict of interest was reported by the authors.
Additional information
Funding
References
- Sanford L, Palmer A. Recent advances in development of genetically encoded fluorescent sensors. Methods Enzymol. 2017;589:1–49.
- Berg J, Hung YP, Yellen G. A genetically encoded fluorescent reporter of ATP:ADP ratio. Nat Methods. 2009;6:161–166.
- Tantama M, Martínez-François JR, Mongeon R, et al. Imaging energy status in live cells with a fluorescent biosensor of the intracellular ATP-to-ADP ratio. Nat Commun. 2013;4:2550.
- Galdieri L, Mehrotra S, Yu S, et al. Transcriptional regulation in yeast during diauxic shift and stationary phase. OMICS. 2010;14:629–638.
- Nilsson A, Nielsen J. Metabolic trade-offs in yeast are caused by F1F0-ATP synthase. Sci Rep. 2016;6:22264.
- Christianson TW, Sikorski RS, Dante M, et al. Multifunctional yeast high-copy-number shuttle vectors. Gene. 1992;110:119–122.
- Mori K, Kawahara T, Yoshida H, et al. Signalling from endoplasmic reticulum to nucleus: transcription factor with a basic-leucine zipper motif is required for the unfolded protein-response pathway. Genes Cells. 1996;1:803–817.
- Mai CT, Le QG, Ishiwata-Kimata Y, et al. 4-Phenylbutyrate suppresses the unfolded protein response without restoring protein folding in Saccharomyces cerevisiae. FEMS Yeast Res. 2018;18:foy016.
- Walther T, Novo M, Rössger K, et al. Control of ATP homeostasis during the respiro-fermentative transition in yeast. Mol Syst Biol. 2010;6:344.
- Rosado CJ, Mijaljica D, Hatzinisiriou I, et al. Rosella: a fluorescent pH-biosensor for reporting vacuolar turnover of cytosol and organelles in yeast. Autophagy. 2008;4:205–213.
- Orij R, Postmus J, Ter Beek A, et al. In vivo measurement of cytosolic and mitochondrial pH using a pH-sensitive GFP derivative in Saccharomyces cerevisiae reveals a relation between intracellular pH and growth. Microbiology. 2009;155:268–278.