
ABSTRACT
Pituitary adenomas (PA) are commonly occurring benign neoplasms. Identification of molecular pathway resulting in pituitary tumorigenesis remains challenges in endocrine oncology. The present study was conducted with aim of investigating the role of microRNA-543 (miR-543) in PA development. Up-regulated miR-543 and downregulated Smad7 were observed in PA tissues. Afterwards, the specific mechanism of miR-543 and Smad7 in PA were determined with the use of ectopic expression, depletion and reporter assay experiments. Smad7 was confirmed as a target gene of miR-543. HP75 cells treated with overexpressed miR-543 exhibited increased cell proliferation, migration and invasion, while decreased cell apoptosis as well as expression of Cleaved caspase-3 and Cleaved caspase-8 were observed. Suppression of miR-543 contributed to an opposite trend to the above findings. Based on the findings, the inhibition of miR-543 was found to play a tumor suppressive role in PA through the down-regulation of Wnt/β-catenin pathway by negatively regulating Smad7.
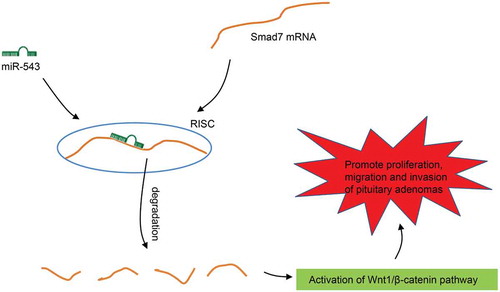
Graphical abstract
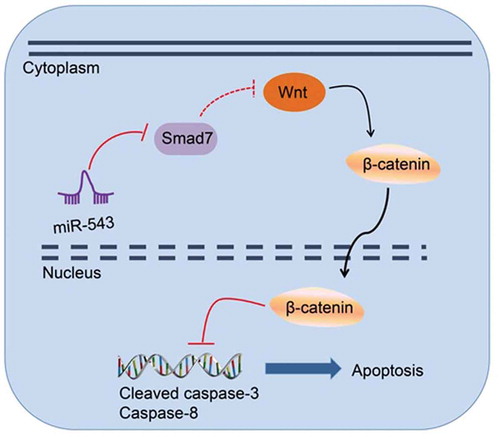
The mechanism of miR-543 targeting Smad7 in pituitary adenoma via the Wnt/β-catenin pathway. miR-543 activates the Wnt/β-catenin pathway by negatively targeting Smad7, thus increasing expression of cleaved caspase-3 and caspase-8, which affects cell apoptosis of pituitary adenoma.
Pituitary adenoma (PA) has been recognized as one of the universal primary central nervous system related tumors with the prevalence at 17% [Citation1]. Since pituitary gland tissue is in close proximity to the brain, invasive PA could invade into cranial bone, dura mater, or sphenoid bone, which could be triggered by genetic and epigenetic regulation, excess or insufficient hormone secretion [Citation2,Citation3]. Patients suffering from PA often present with visual deficits related to the compression of the chiasma, which manifests in different forms including visual field deficits and decreased visual acuity [Citation4]. Due to the limitation of effective diagnostic biomarkers and unsatisfactory response to available therapies, there have been a number of challenges in PA treatment [Citation5]. Although surgical excision is habitually used to remove PA, however, the difficulty in completely removing the tumor often results in reoccurrence [Citation6]. Moreover, few markers have been identified to reliably predict the behavior of PA, thus, it is of great importance to find out a novel biomarker which is able to improve its clinical management.
microRNAs (miRNAs or miRs) have been shown to play important roles in various diseases including cancer, and they are involved in proliferation, apoptosis and metastasis of several tumors [Citation7,Citation8]. An increasing number of studies demonstrate that miR-543 plays as an oncogene in hepatocellular carcinoma (HCC), clear cell renal cell carcinoma and cervical cancer [Citation9–Citation11], among which the miR-543 expression is elevated while miR-543 inhibition could reverse its oncogenic effect. Mothers against decapentaplegic homolog 7 (Smad7) is predicted to be a target gene of miR-543 according to a bioinformatics prediction website (microRNA.org). Smad7 has been identified to be associated with various diseases, the repression of which by miRs could enhance osteogenic differentiation, while inhibiting epithelial-mesenchymal transition (EMT) and tumor metastasis [Citation12,Citation13]. In accordance with the aforementioned study, Smad7 down-regulation targeted by miR-106b promotes esophageal squamous cell carcinoma cell proliferation and invasion [Citation14]. Activation of the Wnt signaling pathway is involved in the pituitary organ genic process, and more importantly, the Wnt signaling pathway could potentially be involved in cell activity regulation and cell proliferation stimulation in both physiological and pathological processes of the mature pituitary [Citation15]. In addition, Smad7 has been identified as an essential molecule for the nuclear β- catenin accumulation in the canonical Wnt signaling pathway [Citation16]. Therefore, on the basis of the above findings, we hypothesized that miR-543 might influence the biological functions of HP75 cells through the regulation of Smad7/Wnt/β-catenin pathway axis.
Materials and methods
Ethics statement
The study was approved by the Ethics Committee of Weifang People’s Hospital. All patients agreed to participate in the study and gave written informed consent.
Study subjects
A total of 137 patients with PA admitted to Weifang People’s Hospital between January 2012 and December 2016 were enrolled in this study. The patients included 53 males and 84 females within the age of 30 to 60 years, with the mean age of 45.39 ± 8.90 years old. The criteria for invasive PA [Citation17] were as follows: (1) PA at grade III-IV or stage C, D and E according to the Wilson’s Hardy classification [Citation18]; (2) PA with destruction of adjacent structures such as sious cavernosus, parasellar and hypothalamus as confirmed by imaging examination including computer tomography (CT) and magnetic resonance imaging (MRI) prior to surgery; (3) PA with the sellar floor bone or adjacent dura presented PA cell invasion confirmed by pathological methods; (4) PA with the destructed sellar floor bone and adjacent dura as a result of PA cell invasion, and tumor protrusion into the sphenoid sinus cavity or invasion of the parasellar vascular nerve during surgery. The patients with PA were enrolled into the invasive group if they met any one of the above criteria; otherwise, they were enrolled into the noninvasive group. A total of 71 cases were confirmed as the invasive and 66 cases as noninvasive using pathological methods.
Cell culture
Human PA HP75 cells were purchased from American Type Culture Collection cell bank (ATCC, Manassas, VA, USA). After resuscitation, the cells were cultured in Dulbecco’s modified Eagle’s medium/Ham’s Nutrient Mixture F12 (DMEM/F12, Gibco, Grand Island, NY, USA) containing 10% fetal bovine serum (FBS, HyClone, Logan, UT, USA) and 100 U/mL penicillin (Sigma, St. Louis, MO, USA), followed by incubation in a 5% CO2 incubator at 37°C with a saturated humidity. When the cell confluence reached 70% – 80%, cells were treated with 0.25% trypsin (Gibco, Grand Island, NY USA), followed by subculture.
Dual-luciferase reporter gene assay
Initially, a bioinformatics analysis website (microRNA.org) predicted that miR-543 could bind to the 3ʹ-untranslated region (UTR) of Smad7. The Smad7-3ʹ-UTRwild type (W) and Smad7-3ʹ-UTRmutant type (M) (Shanghai Genechem Co., Ltd., Shanghai, China) were ligated to the reporter gene vector pGL3-basic (Promega, Madison, WI, USA). Afterwards, the Smad7-3ʹ-UTRW, Smad7-3ʹ-UTRM and miR-543 mimic were transferred into HP75 cells, respectively. Finally, the fluorescence intensity was measured with a luminescence detector (Bio-Rad, Hercules, CA, USA) in accordance with the instructions on the dual-luciferase reporter gene assay kit (Promega, Madison, WI, USA).
Lentiviral embedding
The sequences of human Smad7 were obtained with the use of the NCBI database (https://www.ncbi.nlm.nih.gov/). The sh-Smad and sh-Smad7 sequences (Forward oligo: 5ʹ-CACCGCTTTCAGATTCCCAACTTCTCGAAAGAAGTTGGGAATCTGAAAGC-3ʹ; Reverse oligo: 5ʹ-AAAAGCTTTCAGATTCCCAACTTCTTTCGAGAAGTTGGGAATCTGAAAGC-3ʹ) were synthesized by Shanghai Sangon Biotechnology Co. Ltd. (Shanghai, China), which were then respectively ligated to the PLKO.1-Puro (Sigma, St. Louis, MO, USA) vector. Subsequently, the plasmids sequenced correctly were co-transfected with psPAX2 and pMD2.G (Addgen, Cambridge, MA, USA) into the 293T cells, respectively (293T cells was used for lentivirus production), and the virus supernatant was collected after 48-h transfection. The lentivirus titer was 3 × 10⁸ PFU/mL as determined by fluorescence-activated cell sorting (FACS). Finally, the Puromycin (Sigma, St. Louis, MO, USA) was used to screen out stably transduced cell line (HP75-sh-Samd7), HP75 cell line transduced with lentivirus vector harboring sh-Samd7.
Cell transfection
HP75 cells in the logarithmic growth phase were seeded into a 12-well plate at a cell density of 1 × 10⁶ cells/mL. Next, the cells were separately transfected with miR-543 mimic (50 nM, AAACAUUCGCGGUGCACUUCUU), negative control (NC) mimic (100 nM, GCAUAGGAUGUGGUTTCTGCAUC), miR-543 inhibitor (50 nM, AAGAAGTGCACCGCGAATGTTT) and NC inhibitor (100 nM, UUGCAUUGCGACGCAACUGGGA) using lipo2000 transfection reagent (RiboBio Co., Ltd., Guangzhou, Guangdong, China). In addition, a section from the HP75 cells was treated with Wnt pathway inhibitor, XAV-939 (10 μM, 50 ng/mL; HY-15147, MedChem Express, NJ, USA). Following a 6-h culture, the medium was replaced with DMEM/F12 complete medium. The cells were transfected with different plasmids at a concentration of 5 μM in accordance with the aforementioned grouping.
5-ethynyl-2ʹ-deoxyuridine (EdU) staining
HP75 cells in the logarithmic growth phase were seeded into a 96-well plate with 3 × 10³ cells/well. Three replicates were set for each group. The cell proliferation was detected according to the instructions of the EdU kit (RiboBio Co., Ltd., Guangzhou, Guangdong, China). After 48 h of culture, cells were added with 20 μmol/L EdU solution for further 4-h culture. This was followed by the removal of the supernatant, after which the cells were fixed in 4% paraformaldehyde for 15 min and incubated with 0.2% glycine for 10-min. Next, the cells were permeabilized with 0.5% Triton X-100 for 10 min after phosphate buffer saline (PBS) rinsing and incubated with Apollo® staining reagent for 30 min with the avoidance of light. Finally, the nuclei were stained with Hoechst 33,342 for 10 min, and the stained cells were photographed and counted under a fluorescence microscope, with 5 visual fields calculated in each well. The EdU positive cells, which were named the red fluorescent cells, were considered as proliferative cells. The cell proliferation rate was calculated using the following formula: Cell proliferation rate = the number of EdU positive cells/the total number of cells.
Scratch test
HP75 cells in the logarithmic growth phase were seeded into a 6-well plate at a cell density of 1 × 10⁶ cells/well. When the well was covered with cells, the original culture medium was replaced with 1% FBS cell culture medium to starve cells for 12 h. Then, scratches were vertically made on the 6-well plates covered with cells by a 200 μL pipette, and the scratched-off cells were washed with PBS. The cells had already been assigned to different groups as mentioned. The migration distance of cells was photographed at 0 h and 24 h. The experiment was repeated 3 times independently. The average width of the scratches was measured and calculated by Image J. Cell migration rate (%) = (1 – scratch width/initial scratch width) × 100%. The data at different time points of each group were analyzed.
Transwell assay
The Matrigel (Becton Dickinson, Franklin Lakes, NJ, USA) was mixed with serum-free cell culture medium at a ratio of 1: 1. The Transwell chamber (Corning, NY, USA) was added with the above mixture in a volume of 50 μL/well, which was placed in a 37°C incubator to polymerize Matrigel into a gel. Subsequently, HP75 cells in logarithmic growth phase were starved for 24 h with 1% FBS cell culture solution. Following trypsinization, the cells were re-suspended to 1 × 10⁶ cells/mL with serum-free medium, and the mixture of 50 μL cell suspension and 50 μL 2% FBS culture solution was added to the apical chamber. The basolateral chamber was added with 600 μL cell culture solution containing 10% FBS. Subsequently, the Transwell chamber was incubated in a CO2 incubator at a stable temperature for 24 h. Finally, the Transwell chamber was removed, fixed in 4% paraformaldehyde (Sigma, St. Louis, MO, USA) and stained with crystal violet (Sigma, St. Louis, MO, USA). Finally, the five-point sampling method was used for the selection of five visual fields, and the cells were counted under an inverted microscope (200 ×), with the mean value obtained.
Flow cytometry
After detachment, the HP75 cells were washed twice with PBS, centrifuged at 2000 rpm for 5 min and collected. The cell apoptosis was detected according to the instructions of Annexin-V-fluorescein isothiocyanate (FITC) kit (Sigma, St. Louis, MO, USA). The cells in each tube (1 × 10⁵ cells/tube) were added with 150 μL binding buffer and 5 μL Annexin-V-FITC, mixed and incubated at room temperature for 15 min without light exposure. Afterwards, additional 100 μL binding buffer and 5 μL propidium iodide (PI) dye (Sigma, St. Louis, MO, USA) were added and mixed. Finally, the cell apoptosis detection was performed by a FACSCanto II flow cytometer (Becton Dickinson, Franklin Lakes, NJ, USA).
Western blot analysis
The HP75 cells were washed twice with PBS, lysed with cell lysis buffer and centrifuged at 4°C at 12,000 rpm for 30 min in order to remove the tissue or cell debris, after which the supernatant was collected to determine the concentration of total protein using the bicinchoninic acid (BCA) kit (Pierce, Rockford, IL, USA). Next, 50 μg total protein was dissolved in 2 × sodium dodecyl sulfate (SDS) loading buffer, boiled at 100°C for 5 min, and separated by sodium dodecyl sulfate polyacrylamide gel electrophoresis (SDS-PAGE) with a concentration of 10%. After electrophoresis, the protein was transferred onto a polyvinylidene fluoride (PVDF) membrane using the wet transfer method, followed by blockade using 5% skim milk for 1 h at room temperature. Afterwards, PVDF membrane was incubated with primary antibodies (Abcam, Cambridge, MA. USA): Samd7 (ab90086), caspase-3 (ab4051), caspase-8 (ab32397), Wnt1 (ab31962) and β-catenin (ab2362). After Tris-buffered saline with Tween 20 (TBST) washes, the membrane was incubated with horseradish peroxidase (HRP) conjugated secondary antibody for 1 h and then washed with TBST. An identical volume of solution A and solution B in the electrochemiluminescence (ECL) fluorescence detection kit (BB-3501, Amersham Pharmacia Biotech, Amersham, UK) were mixed under dark conditions, and added to the membrane. Images were acquired using the Bio-Rad image analysis system (Bio-Rad, Hercules, CA, USA) and analyzed with the use of Image J software. The relative protein expression was represented by the gray value of the target protein bands divided by that of the GAPDH protein band. The experiment was conducted three times.
Reverse transcription quantitative polymerase chain reaction (RT-qPCR)
The PA tissues were ground into the shape of minced meat in liquid nitrogen, followed by the extraction of the RNA with Trizol (Invitrogen, Carlsbad, CA, USA). The RNA of HP75 cells were directly extracted with Trizol, and the concentration was determined by NanoDrop ultra-microvolume spectrophotometer (Thermo Fisher Scientific, Waltham, MA, USA). The RT-qPCR was performed by using SYBR®Premix Ex TaqTM II kit (Takara, Dalian, Liaoning, China). The reaction system was 20 μL, including 1.0 μL cDNA, 10 μL 2 × SYBR Green Mix, 0.5 μL forward primer (10 μM), 0.5 μL reverse primer (10 μM), supplemented to a final 20 μL reaction system with RNase free water. The reaction conditions consisted of pre-denaturation at 95°C for 3 min, a total of 40 cycles of denaturation at 95°C for 15 s, annealing at 60°C for 30 s, extension at 72°C for 20 s, and finally elongation at 72°C for 5 min. All the primers were synthesized by Beijing Genomics Institute (Beijing, China), shown in . U6 was used as an internal reference for miR-543, and glyceraldehyde-3-phosphate dehydrogenase (GAPDH) for other genes. The reliability of the RT-qPCR results was evaluated using the melting curve. The mRNA expression of relative genes was calculated by the 2−ΔΔCt method, which represents the ratio of the target gene expression between the experimental group and the control group. All reaction was set in three replicates in order to obtain the mean value.
Table 1. Primer sequences for RT-qPCR.
Statistical analysis
All data were analyzed using SPSS 21.0 software (IBM Corp. Armonk, NY, USA). Measurement data were expressed as mean ± standard derivation. When the data was in normal distribution and variance homogeneity detected by normality and variance homogeneity test, comparisons between two groups were performed with the t-test, and comparisons among multiple groups were analyzed by one-way analysis of variance. In addition, the rank-sum test was also conducted for comparison. The clinical data were examined by Chi-square test, with p < 0.05 considered as statistically significant.
Results
Higher expression of miR-543 was found in invasive PA tissues than in noninvasive PA tissues
Initially, the expression of miR-543 in invasive (n = 66) and noninvasive PA (n = 71) tissues was determined by RT-qPCR () to explore the correlation between miR-543 expression and PA progression. The results found that there was a significantly higher expression of miR-543 in the invasive group in comparison to that of the noninvasive group. According to clinical data analysis as described in by Chi-square test, it was shown that gender was not correlated to the pathological type of PA tumor (p < 0.05).
Table 2. Baseline data of PA patients with non-invasive pituitary and invasive pituitary.
Figure 1. Higher expression of miR-543 is observed in invasive PA tissues relative to noninvasive ones.
*p < 0.05 vs. the noninvasive group; measurement data were expressed as mean ± standard derivation, and the data between two groups were analyzed by non-paired independent t-test; the experiment was repeated 3 times; miR-543, microRNA-543; PA, pituitary adenoma. N (the noninvasive group) = 66; N (the invasion group) = 71.
MiR-543 promotes HP75 cell proliferation, suppresses apoptosis, and induces invasion and migration
Next, HP75 cells were transfected with different mimic and inhibitor to investigate the effects of miR-543 on PA progression. RT-qPCR was employed to detect the expression of miR-543 in HP75 cells, the results of which are shown in ). Compared with the NC mimic group, the expression of miR-543 elevated in the miR-543 mimic group while it was decreased in comparison to the NC inhibitor group (all p < 0.05). Afterwards, cell proliferation, apoptosis, invasion and migration were respectively measured using EdU staining, flow cytometry, scratch test and Transwell assay. In contrast to the NC mimic group, cell proliferation was significantly increased in the miR-543 mimic group; in comparison with the NC inhibitor group, the miR-543 inhibitor group presented with decreased cell proliferation (all p < 0.05) ()). An inhibition of cell apoptosis was also observed in the miR-543 mimic group compared with the NC mimic group; cell apoptosis was also enhanced in the miR-543 inhibitor group in contrast to the NC inhibitor group (all p < 0.05) ()). In addition, the protein levels of cleaved caspase-3 and cleaved caspase-8 reduced while that of pro caspase-3 and pro caspase-8 elevated in the miR-543 mimic group compared with the NC mimic group; the changes in those protein levels were opposite in the miR-543 inhibitor group in contrast to the NC inhibitor group (all p < 0.05) ()). Compared with the NC mimic group, cell migration was enhanced in the miR-543 mimic group, while it was decreased in the miR-543 inhibitor in comparison with the NC inhibitor group (all p < 0.05) ()). The cell invasion was elevated in the miR-543 mimic group in contrast to the NC mimic group while it was suppressed in the miR-543 inhibitor group in comparison with the NC inhibitor group (all p < 0.05) ()). These results were highly suggestive of the promotive effect played by miR-543 on HP75 cell proliferation, while suppressing apoptosis, and enhancing cell migration and invasion.
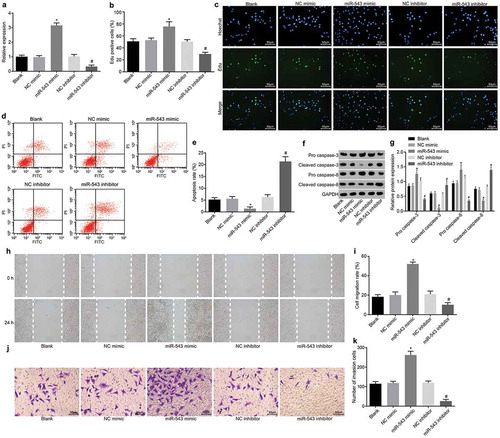
Figure 2. Suppression of miR-543 restrains cellular functions of HP75 cells and enhances cell apoptosis.
(a) the expression of miR-543 in HP75 cells in the presence of miR-543 mimic or inhibitor; (b) Hoechst 33,342 and EdU positive cells after transfection with miR-543 mimic or inhibitor; (c) detection of HP75 cell proliferation by EdU staining in the presence of miR-543 mimic or inhibitor (200 ×); (d & e), detection of HP75 cell apoptosis by flow cytometry in the presence of miR-543 mimic or inhibitor; (f & g), the protein level of Cleaved caspase-3, Cleaved caspase-8, Pro caspase-3, and Pro caspase-8 in HP75 cells in the presence of miR-543 mimic or inhibitor; (h & i), the HP75 cell migration detected by scratch test in the presence of miR-543 mimic or inhibitor; (j & k), Transwell assay of HP75 cell invasion in the presence of miR-543 mimic or inhibitor (200 ×); *p < 0.05 vs. the NC mimic group; #p < 0.05 vs. the NC inhibitor group; measurement data were expressed as mean ± standard deviation; the one-way analysis of variance was performed for multiple-group comparison; the experiment was repeated 3 times independently; miR-543, microRNA-543; PA, pituitary adenoma; NC, negative control; EdU, 5-ethynyl-2ʹ-deoxyuridine; FITC; fluorescein isothiocyanate; PI, propidium iodide; GAPDH, glyceraldehyde-3-phosphate dehydrogenase.
MiR-543 activates Wnt/β-catenin signaling pathway through the down-regulation of Smad7
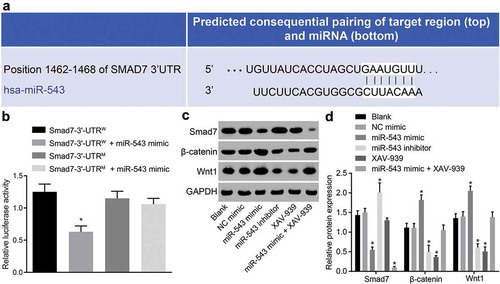
The binding site between miR-543 and Smad7 was predicted by bioinformatics prediction website (microRNA.org) ()). Dual-luciferase reporter gene assay was performed to further verify their relationship ()), which showed that the luciferase intensity was significantly decreased in the Smad7-3ʹ-UTRW + miR-543 mimic group, while there were no significant differences observed in the Smad7-3ʹ-UTRM + miR-543 mimic group, suggesting that miR-543 could target Smad7. Western blot analysis was applied to measure the protein expression of Wnt1 and β-catenin in HP75 cells following mimic/inhibitor delivery or XAV-939 treatment. The results showed an increase in protein expression of Wnt1 and β-catenin while that of Smad7 was decreased in the miR-543 mimic group in contrast to the NC mimic group, which was opposite to the results observed in the miR-543 inhibitor group (all p < 0.05) ()). In addition, HP75 cells treated with XAV-939 presented a decline in Wnt1 and β-catenin protein expression. As for HP75 cells treated with miR-543 mimic and XAV-939, the protein expression of Smad7 decreased while there were no relevant changes observed in Wnt1 and β-catenin. The aforementioned findings demonstrated that overexpression of miR-543 could regulate the Wnt/β-catenin pathway by specifically binding to Smad7.
Figure 3. MiR-543 activates the Wnt/β-catenin pathway through inhibition of Smad7.
(a) the predicted binding site of miR-543 and Smad7; (b) the verified relationship between miR-543 and Smad7 using dual-luciferase reporter gene assay; *p < 0.05 vs. the Smad7-3ʹ-UTRW group; (c) the protein bands of Smad7, Wnt1, β-catenin and GAPDH; d, the protein level measurement of Smad7, Wnt1 and β-catenin relative to GAPDH in response to miR-543 mimic or inhibitor, XAV-939 (an Wnt/β-catenin pathway inhibitor) treatment by western blot assay; *p < 0.05 vs. the NC mimic group; the measurement data were expressed as mean ± standard deviation; the one-way analysis of variance was conducted for data analysis in panel; (D) the experiment was repeated 3 times independently; miR-543, microRNA-543; Smad7, mothers against decapentaplegic homolog 7; NC, negative control; W, wild-type; M, mutant; GAPDH, glyceraldehyde-3-phosphate dehydrogenase.
MiR-543 mediates HP75 cell proliferation, apoptosis, migration and invasion by regulating Smad7 and Wnt/β-catenin pathway
The protein expression of Smad7 in HP75 cells following transfection was measured by western blot analysis for the assessment of the transfection efficiency. Compared with the sh-NC group, the Smad7 protein level notably decreased in the sh-Smad7 group (p < 0.05), while there were no notable differences observed in the miR-543 inhibitor + sh-Smad7 group (p > 0.05) ()).
Figure 4. miR-543 regulates HP75 cell proliferation, apoptosis, migration and invasion through regulation of Smad7 and Wnt/β-catenin pathway.
(a & b) Smad7 protein level in the HP75 cells treated with sh-Smad7 in the presence of miR-543 inhibitor or XAV-939 in the presence of miR-543 mimic; (c) HP75 cell proliferation detected by EdU staining under treatment of sh-Smad7 in the presence of miR-543 inhibitor or XAV-939 in the presence of miR-543 mimic; (d) Hoechst 33,342 and EdU positive cells following treatment; (e & f) HP75 cell apoptosis under treatment of sh-Smad7 in the presence of miR-543 inhibitor or XAV-939 in the presence of miR-543 mimic; (g & h) HP75 cell migration under treatment of sh-Smad7 in the presence of miR-543 inhibitor or XAV-939 in the presence of miR-543 mimic; (i & j) HP75 cell invasion under treatment of sh-Smad7 in the presence of miR-543 inhibitor or XAV-939 in the presence of miR-543 mimic; *p < 0.05 vs. the blank or sh-NC group; miR-543, microRNA-543; Smad7, mothers against decapentaplegic homolog 7; NC, negative control; PA, pituitary adenoma; EdU, 5-ethynyl-2ʹ-deoxyuridine; XAV-939, an Wnt/β-catenin pathway inhibitor. The measurement data were expressed as mean ± standard deviation; the one-way analysis of variance was conducted for data analysis; the experiment was repeated 3 times independently.
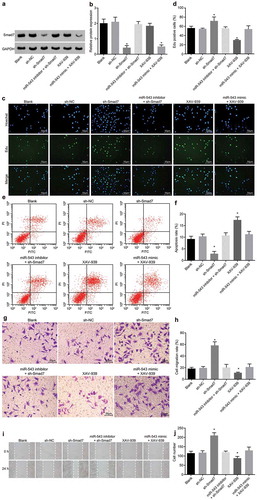
As mentioned above, miR-543 could bind to Smad7. HP75 cells were transduced with sh-Smad7 alone or both miR-543 inhibitor and sh-Smad7 in order to explore the influence of miR-543 targeting Smad7 on HP75 cell proliferation, which was subsequently assessed by EdU staining. XAV-939 treatment in addition to miR-543 mimic transfection was applied to verify the involvement of Wnt/β-catenin pathway of the regulatory effect of miR-543 on HP75 cell proliferation. As described in ), there was no remarkable difference in the fluorescence intensity between the blank and sh-NC groups. Cell proliferation rate was enhanced in the sh-Smad7 group in comparison with that of the sh-NC group (p < 0.05), while it did not change markedly in the miR-543 inhibitor + sh-Smad7 group compared with the blank group (p > 0.05). Treatment of XAV-939 resulted in the significant decrease of proliferation rate of HP75 cells (p < 0.05). The proliferation rate of HP75 cells in the miR-543 mimic + XAV-939 group presented without any significant changes as compared to that in the blank group (p > 0.05).
Next, HP75 cell apoptosis was evaluated with the use of flow cytometry after receiving treatment. Based on the results, there was no significant difference observed in the apoptosis rate of HP75 cells between the blank and sh-NC groups (p > 0.05). Compared with the sh-NC group, the sh-Smad7 group showed increased cell apoptosis rate (p < 0.05). The miR-543 inhibitor + sh-Smad7 group was observed to have no notable difference in cell apoptosis rate in contrast to the blank group (p > 0.05). HP75 cells in the XAV-939 group presented with increased apoptosis rate (p < 0.05), while that in the miR-543 mimic + XAV-939 group had no significant difference when compared with the blank group (p > 0.05) ()).
Scratch test was performed to test the regulatory effect of miR-543 on HP75 cell migration in relation to involvement of Smad7 and Wnt/β-catenin pathway. HP75 cell migration rate presented with no significant difference between the blank and sh-NC groups (p > 0.05). Compared with the sh-NC group, the sh-Smad7 group showed increased cell migration rate (p < 0.05). The miR-543 inhibitor + sh-Smad7 group had no notable difference in cell apoptosis rate compared with the blank group (p > 0.05). HP75 cells in the XAV-939 group displayed decreased cell migration rate (p < 0.05). The migration rate of HP75 cells in the miR-543 mimic + XAV-939 group had no significant change compared with the blank group (p > 0.05) ()).
Transwell assay was used to examine the effect of miR-543 on HP75 cell invasion in relation to involvement of Smad7 and Wnt/β-catenin pathway. The number of invasive HP75 cells had no significant difference between the blank and sh-NC groups (p > 0.05). Compared with the sh-NC group, the number of invasive HP75 cells increased and cell invasion enhanced in the sh-Smad7 group (p < 0.05). The miR-543 inhibitor + sh-Smad7 group had no notable difference in the number of invasive HP75 cells compared with the blank group (p > 0.05). The number of invasive HP75 cells decreased in the XAV-939 group (p < 0.05), while those in the miR-543 mimic + XAV-939 group had no significant change compared with the blank group (p > 0.05) ()).
It can be observed that the silencing of Smad7 could promote cell proliferation, suppress apoptosis, and enhance migration and invasion of HP75 cells, while inhibition of miR-543 reversed those effects. Meanwhile, inhibition of the Wnt/β-catenin pathway was observed for the results of suppression in proliferation and induction in apoptosis of HP75 cells as well as repression of migration and invasion, which were all reversed by miR-543 upregulation. These results strongly suggest that miR-543 could regulate PA progression through targeting Smad7 and activation of the Wnt/β-catenin pathway.
Discussion
PA is defined as a benign tumor, which accounts for approximately 8–15% of intracranial tumors; PA with large size has a high potential of eventually resulting in the invasion and infiltration in the surrounding dura, sinus, brain and bone tissue [Citation19]. There’s been multiple studies suggesting the correlation between miR expression and various cancers, and many miRs have been found to contribute to tumor initiation and progression, mainly due to the functional role they played as tumor suppressors or oncogenes [Citation20]. Our results indicated the inhibition of miR-543 could result in the suppression of cell proliferation, invasion and migration while promoting apoptosis in PA through the inactivation of the Wnt/β-catenin signaling pathway by targeting Smad7.
Initially, the results from RT-qPCR revealed increased levels of miR-543 in invasive PA tissues in comparison to that of the non-invasive PA tissues (). According to previous studies, there’s a number of regulatory roles played by miR-543 in several types of cancer, including its tumor suppressor role in breast cancer [Citation21], glioma [Citation22] and colorectal cancer [Citation23]. In addition to its anti-oncogenic effect in cancers, miR-543 also has an oncogenic influence in other types of cancer in humans. An example of this includes the up-regulation of miR-543 observed in clear cell renal cell carcinoma cells, in which the inhibition of miR-543 resulted in the significant suppression of cell invasion and proliferation [Citation10]. In addition, miR-543 has also been demonstrated to promote the proliferative and invasive ability of HCC cells [Citation18]. The results from the present study we conducted were consistent with the aforementioned findings suggesting the oncogenic properties of miR-543 as an oncogene in PA (). Another finding from our study revealed that there was an enhancement of proliferation and invasion of HP75 cells that occurs secondary to the overexpression of miR-543 with a reduced cell apoptosis. In addition, there was a decrease in the protein levels of Cleaved caspase-3 and Cleaved caspase-8 in HP75 cells transfected with miR-543 mimic; opposing results were found following the suppression of miR-543 expression. A study demonstrated that the activation of both Cleaved caspase-3 and Cleaved caspase-8, that occurs as a result of the loading of FRα-targeted liposomes with doxorubicin was a major contributor to the non-functional inhibition of PA cell proliferation [Citation24]. On the basis of the above findings, we concluded that miR-543 could potentially play an oncogenic role in PA.
Based on the results from the bioinformatics analysis, miR-543 was illustrated to be a negative regulator of Smad7. Moreover, the up-regulation of miR-543 resulted in the significant decrease in Smad7 expression while there was an evident increase in Wnt and β-catenin expression, which highly indicates that miR-543 could regulate the Wnt/β-catenin pathway by specifically binding to Smad7 (). Previous data showed the inhibition of miR-15a is capable of reducing cardiomyocyte apoptosis due to its ability to release Smad-7-dependent NF-κB in cardiac ischemia/reperfusion injury [Citation25]. Moreover, miR-520g directly binds to the 3ʹ-UTR of Smad7 mRNA, resulting in Smad7 being directly targeted by miR-520g; as a result of this phenomenon, the decrease in Smad7 expression modulated by miR-520g promoted HCC cell metastasis and induced EMT by blocking TGF-β signaling pathway [Citation13]. Smith et at. found that miR-106b-25 cluster activated TGF-β signaling pathway through the down-regulation of Smad7, which in turn induces EMT and tumor-initiating cell characteristics in human breast cancer [Citation26]. Cell invasion and migration in breast cancer are facilitated by miR-21-regulated Smad7 suppression through the activation of the epidermal growth factor (EGF) and TGF-β signaling pathways [Citation27]. Consistently, HP75 cells transduced with sh-Smad7 showed the evident acceleration of cell migration, proliferation, and invasion while reducing cell apoptosis; however, the inhibition of miR-543 reversed all those effects by sh-Smad7 (). Therefore, the aforementioned findings provided further evidence in validating our hypothesis miR-543 accelerates PA progression through the downregulation of Smad7. An aforementioned study showed that miR-93 resulted in the suppression of invasion, proliferation and migration of colon cancer cells via the Wnt/β-catenin signaling pathway by targeting Smad7 [Citation16]. The restoration of Smad4 expression in colon cancer was also found to inhibit the Wnt/β-catenin signaling pathway by down-regulating β-catenin [Citation28]. Up-regulation of Wnt protein in pituitary progenitor/stem cells was found to be associated with tumorigenesis of PA in both mice and humans [Citation29]. Moreover, the Wnt pathway has been implicated to be deregulated in the oncogenesis of pituitary [Citation15]. XAV939, known as a Wnt signaling inhibitor, degrades β-catenin by stabilizing axin via blocking the poly-ADP-ribosylating enzymes tankyrase 1 and tankyrase 2 [Citation30]. Consistent with our study, XAV939 treatment could result in a decrease in Wnt1 expression [Citation31]. In this study, inhibition of the Wnt/β-catenin pathway by XAV939 contributed to suppression in proliferation and induction in apoptosis of HP75 cells as well as repression of migration and invasion, which were all reversed by miR-543 upregulation. Thus, we may conclude that miR-543 contributes to the activation of the Wnt/β-catenin signaling pathway in regulating the progression of PA.
In conclusion, the collective results from our study found a rationale for the hypothesis that miR-543 acts as a tumor promotor in PA by which suppression of miR-543 restrained cell proliferation, migration and invasion through the inactivation of the Wnt/β-catenin signaling pathway and up-regulation of Smad7 (). Our study was able to initiate an alternative pathway for the currently existing therapeutic methods for PA, based on the findings on the effect of miR-543, Smad7 and Wnt/β-catenin signaling pathway in PA. However, further investigations and in vivo experiments are required to illustrate the efficacy and safety of the use of these pathways as therapeutic methods in the treatment of PA.
Figure 5. The schematic map of miR-543/Smad7/Wnt/β-catenin involved in the progression of PA. miR-543 down-regulates Smad7 to activate the Wnt/β-catenin signaling pathway, by which miR-543 promotes cell proliferation, migration and invasion in PA. miR-543, microRNA-543; PA, pituitary adenoma.
Author contribution
Da-Wei Shen and Yun-Long Li designed the study. Da-Wei Shen and Zhi-Dan Xu collated the data. Yu-Jie Hou and Yong-Zhe Li designed and developed the database, carried out data analyses and produced the initial draft of the manuscript. Jian-Yong Chang contributed to drafting the manuscript. All authors participated in the revised manuscript, and have read and approved the final submitted manuscript.
Acknowledgments
We would like to thank all participants enrolled in the present study.
Disclosure statement
No potential conflict of interest was reported by the authors.
References
- Mehta GU, Lonser RR. Management of hormone-secreting pituitary adenomas. Neuro Oncol. 2017;19(6):762–773.
- Ezzat S, Asa SL. Mechanisms of disease: the pathogenesis of pituitary tumors. Nat Clin Pract Endocrinol Metab. 2006;2(4):220–230.
- He W, Huang L, Li M, et al. MiR-148b, MiR-152/ALCAM axis regulates the proliferation and invasion of pituitary adenomas cells. Cell Physiol Biochem. 2017;44(2):792–803.
- Muskens IS, Zamanipoor Najafabadi AH, Briceno V, et al. Visual outcomes after endoscopic endonasal pituitary adenoma resection: a systematic review and meta-analysis. Pituitary. 2017;20(5):539–552.
- Qiu P, Xu TJ, Lu XD, et al. MicroRNA-378 regulates cell proliferation and migration by repressing RNF31 in pituitary adenoma. Oncol Lett. 2018;15(1):789–794.
- Feng Y, Mao ZG, Wang X, et al. MicroRNAs and target genes in pituitary adenomas. Horm Metab Res. 2018;50(3):179–192.
- Han G, Zhang L, Ni X, et al. MicroRNA-873 promotes cell proliferation, migration, and invasion by directly targeting TSLC1 in hepatocellular carcinoma. Cell Physiol Biochem. 2018;46(6):2261–2270.
- Jiang LP, Zhu ZT, Zhang Y, et al. Downregulation of MicroRNA-330 correlates with the radiation sensitivity and prognosis of patients with brain metastasis from lung cancer. Cell Physiol Biochem. 2017;42(6):2220–2229.
- Liao C, Chen W, Fan X, et al. MicroRNA-200c inhibits apoptosis in pituitary adenoma cells by targeting the PTEN/Akt signaling pathway. Oncol Res. 2013;21(3):129–136.
- Yang F, Ma J, Tang Q, et al. MicroRNA-543 promotes the proliferation and invasion of clear cell renal cell carcinoma cells by targeting Kruppel-like factor 6. Biomed Pharmacother. 2018;97:616–623.
- Dang H, Zheng P, Liu Y, et al. MicroRNA-543 acts as a prognostic marker and promotes the cell proliferation in cervical cancer by BRCA1-interacting protein 1. Tumour Biol. 2017;39(2):1010428317691187.
- Li H, Yang F, Wang Z, et al. MicroRNA-21 promotes osteogenic differentiation by targeting small mothers against decapentaplegic 7. Mol Med Rep. 2015;12(1):1561–1567.
- Kan H, Guo W, Huang Y, et al. MicroRNA-520g induces epithelial-mesenchymal transition and promotes metastasis of hepatocellular carcinoma by targeting SMAD7. FEBS Lett. 2015;589(1):102–109.
- Dai F, Liu T, Zheng S, et al. MiR-106b promotes migration and invasion through enhancing EMT via downregulation of Smad 7 in Kazakh’s esophageal squamous cell carcinoma. Tumour Biol. 2016;37(11):14595–14604.
- Chambers TJ, Giles A, Brabant G, et al. Wnt signalling in pituitary development and tumorigenesis. Endocr Relat Cancer. 2013;20(3):R101–R111.
- Tang Q, Zou Z, Zou C, et al. MicroRNA-93 suppress colorectal cancer development via Wnt/beta-catenin pathway downregulating. Tumour Biol. 2015;36(3):1701–1710.
- Izycka-Swieszewska E, Drozynska E, Rzepko R, et al. Analysis of PI3K/AKT/mTOR signalling pathway in high risk neuroblastic tumours. Pol J Pathol. 2010;61(4):192–198.
- Yu L, Zhou L, Cheng Y, et al. MicroRNA-543 acts as an oncogene by targeting PAQR3 in hepatocellular carcinoma. Am J Cancer Res. 2014;4(6):897–906.
- Zhu H, Guo J, Shen Y, et al. Functions and mechanisms of tumor necrosis factor-alpha and noncoding RNAs in bone-invasive pituitary adenomas. Clin Cancer Res. 2018. DOI:10.1158/1078-0432.CCR-18-0472
- Stilling G, Sun Z, Zhang S, et al. MicroRNA expression in ACTH-producing pituitary tumors: up-regulation of microRNA-122 and −493 in pituitary carcinomas. Endocrine. 2010;38(1):67–75.
- Chen P, Xu W, Luo Y, et al. MicroRNA 543 suppresses breast cancer cell proliferation, blocks cell cycle and induces cell apoptosis via direct targeting of ERK/MAPK. Onco Targets Ther. 2017;10:1423–1431.
- Xu L, Yu J, Wang Z, et al. miR-543 functions as a tumor suppressor in glioma in vitro and in vivo. Oncol Rep. 2017;38(2):725–734.
- Fan C, Lin Y, Mao Y, et al. MicroRNA-543 suppresses colorectal cancer growth and metastasis by targeting KRAS, MTA1 and HMGA2. Oncotarget. 2016;7(16):21825–21839.
- Liu X, Ma S, Dai C, et al. Antiproliferative, antiinvasive, and proapoptotic activity of folate receptor alpha-targeted liposomal doxorubicin in nonfunctional pituitary adenoma cells. Endocrinology. 2013;154(4):1414–1423.
- Yang Y, Ding S, Xu G, et al. MicroRNA-15a inhibition protects against hypoxia/reoxygenation-induced apoptosis of cardiomyocytes by targeting mothers against decapentaplegic homolog 7. Mol Med Rep. 2017;15(6):3699–3705.
- Smith AL, Iwanaga R, Drasin DJ, et al. The miR-106b-25 cluster targets Smad7, activates TGF-beta signaling, and induces EMT and tumor initiating cell characteristics downstream of Six1 in human breast cancer. Oncogene. 2012;31(50):5162–5171.
- Han M, Wang F, Gu Y, et al. MicroRNA-21 induces breast cancer cell invasion and migration by suppressing smad7 via EGF and TGF-beta pathways. Oncol Rep. 2016;35(1):73–80.
- Tian X, Du H, Fu X, et al. Smad4 restoration leads to a suppression of Wnt/beta-catenin signaling activity and migration capacity in human colon carcinoma cells. Biochem Biophys Res Commun. 2009;380(3):478–483.
- Gaston-Massuet C, Andoniadou CL, Signore M, et al. Increased wingless (Wnt) signaling in pituitary progenitor/stem cells gives rise to pituitary tumors in mice and humans. Proc Natl Acad Sci U S A. 2011;108(28):11482–11487.
- Huang SM, Mishina YM, Liu S, et al. Tankyrase inhibition stabilizes axin and antagonizes Wnt signalling. Nature. 2009;461(7264):614–620.
- Chen J, Jia YS, Liu GZ, et al. Role of LncRNA TUG1 in intervertebral disc degeneration and nucleus pulposus cells via regulating Wnt/beta-catenin signaling pathway. Biochem Biophys Res Commun. 2017;491(3):668–674.