
ABSTRACT
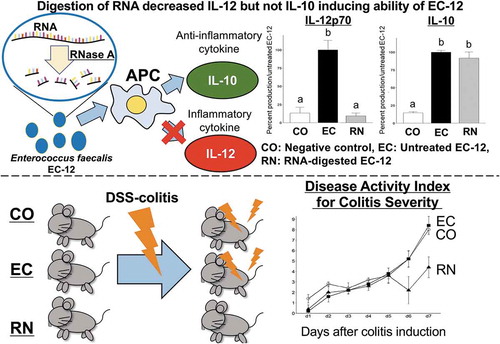
We previously reported that the major component of Enterococcus faecalis strain EC-12 (EC-12) inducing production of Interleukin (IL)-12 in mouse/human immune cells was its own RNA. This study aimed to investigate if RNase A-treated EC-12 could also produce IL-10 and to evaluate the possible effects of IL-10 produced by RNase A-treated EC-12. Three experiments were conducted: (1) Assessment of the effect of RNase A-treated EC-12 on transcriptome profiles and biological pathways in human peripheral blood mononuclear cells; (2) Determination of cytokine concentration in its culture supernatants; and (3) Supplementation of RNase A-treated EC-12 (RN) to mice with dextran sodium sulfate-induced colitis. Treatment of EC-12 with RNase A inhibited inflammatory response including the potency to induce IL-12 production, while it did not affect IL-10 production (Experiment 1 and 2). Colitis symptoms were milder in RN than in PBS-supplemented controls (Experiment 3). RNase A-treated EC-12 likely became an anti-inflammatory agent primarily inducing IL-10 production.
Graphical Abstract
RNase A-treated Enterococcus faecalis strain EC-12 (EC-12) likely became an anti-inflammatory agent primarily inducing IL-10 production.
Lactic acid bacteria (LAB) have been shown to confer health benefits such as protection against allergies [Citation1,Citation2] and infection as well as modulation of inflammation [Citation3,Citation4], on both animal models and humans. Results from recent in vivo studies suggested that both live and heat-killed LAB exert such beneficial effects [Citation2,Citation5–Citation7]. In those studies, it was suggested that immunomodulation, not an alteration of the intestinal microbiota by heat-killed LAB was the major causative mechanism of those health benefits. Production of pro- and anti-inflammatory cytokines induced by LAB has been well documented [Citation3,Citation8]. It is believed that while recognition of LAB components by immune cells induces production of both pro-and anti-inflammatory cytokines [Citation9], the production ratio depends on the LAB strain [Citation10,Citation11]. This ratio is used to differentiate pro-inflammatory from anti-inflammatory strains [Citation11–Citation13].
Pro-inflammatory cytokines, such as interleukin (IL)-12 and tumor necrosis factor (TNF)-α, produced by antigen-presenting cells (APCs), play a pivotal role in inducing a T helper 1 (Th1)-predominant immune response and enhancing cellular immunity [Citation14,Citation15]. However, pro-inflammatory cytokine production likely exacerbates inflammatory diseases, such as inflammatory bowel disease (IBD) [Citation16,Citation17]. In contrast, IL-10 is an anti-inflammatory cytokine produced not only by APCs but also by T cells and mast cells. There is abundant evidence on the crucial role IL-10 has in inflammatory diseases, particularly IBD [Citation16,Citation18,Citation19]. For example, it is well known that IL-10 limits and terminates inflammatory responses by inhibiting the production of interferon (IFN)-γ and IL-12 in Th1 cells, natural killer cells and APCs [Citation20,Citation21]. Therefore, regular intake of LAB that primarily induces IL-10 production is thought to trigger several anti-inflammatory effects in the host.
Heat-killed Enterococcus faecalis strain EC-12 (EC-12) is a beneficial LAB [Citation6]. It has been reported that EC-12 showed various health beneficial effects such as improvement of gut microbiota, promotion of bowel movement and exclusion of vancomycin-resistant bacteria [Citation22–Citation25]. We have previously reported that the major component of EC-12 inducing IL-12 production in mouse and human immune cells is its own RNA [Citation22,Citation26]. However, to date, it is unknown whether the RNA-depleted EC-12 could also induce IL-10.
In the present study EC-12 cells were treated with RNase A and compared with non-treated EC-12 cells with the aim of (a) investigating the potential of EC-12 to induce IL-10 production and (b) assessing the possible anti-inflammatory effects of EC-12-induced IL-10 production on an experimental model. The work was divided in three experiments: (1) Assessment of the effect of RNase A-treated EC-12 on transcriptome profiles and biological pathways in human peripheral blood mononuclear cells (PBMCs); (2) Assessment of induction and production of pro- and anti-inflammatory cytokine in human immune cells after co-incubation with RNase A-treated EC-12; and (3) Estimation of the anti-inflammatory effects of RNase A-treated EC-12 supplementation to a mouse model of DSS-induced IBD.
Materials and methods
Experiment 1
Ethical statement
The research protocol for the present study was approved by the Ethical Committee of Combi Corporation (Saitama, Japan; Approval number: FF-006). Written informed consent was obtained from donors of peripheral blood for the use of their samples for research purposes.
Enterococcus faecalis strain EC-12
E. faecalis EC-12 (International Patent Organism Depositary in Japan number, FERM BP-10,284; GenBank Accession number, AB154827) was stored at Combi Corporation facilities. Commercially available dry cells of heat-killed EC-12 in powder-like form were used for the experiments.
Peripheral blood collection
Peripheral blood was drawn from three healthy Japanese adults, collected into Venoject II vacuum blood collection tubes (heparinized blood collection tubes) (Terumo, Tokyo, Japan), and transferred to 50 mL centrifuge tubes containing 2 mM ethylenediaminetetraacetic acid (EDTA).
Peripheral blood mononuclear cell isolation and pre-culture
After two-fold dilution with sterile phosphate buffered saline (PBS), blood was transferred to a Percoll density gradient solution (d = 1.077) (GE Healthcare, Tokyo, Japan), and PBMCs were isolated from the mixture by centrifugation at 800 g for 30 min. Red blood cells remaining in the mixture were lysed with ACK lysing solution (0.15 mM MNH4Cl, 10 mM KHCO3, and 0.1 mM Na2EDTA; pH 7.4). When needed, debris not dispersed after suspension of the cell pellet with PBS was carefully removed using a pipette. PBMCs were washed with PBS and suspended in culture medium [RPMI1640 (Nacalai Tesque, Kyoto, Japan) with 10% fetal calf serum (Equitech-Bio Inc., Kerrville, TX, USA), 100 U/mL of penicillin and 100 μg/mL of streptomycin (Nacalai Tesque)], at a density of 2.5 × 10⁶ cells/mL. Four hundred µL of PBMCs was seeded into each well of a 24-well cell culture plate (TPP, Trasadingen, Switzerland), and pre-cultured in an incubator at 37°C for 4 h, in a 5% CO2 humidified environment.
Preparation of untreated EC-12 and RNase A-treated EC-12
E. faecalis EC-12 were treated with RNase A because we previously demonstrated that the RNA of EC-12 was an important immunogenic component inducing IL-12 production in human immune cells [Citation26].
Forty milligrams of E. faecalis EC-12 (EC-12) were suspended in 1 mL of RPMI 1640 and 0.2 mg/mL RNase A (Invitrogen, Tokyo, Japan). Upon 60-min incubation at 37°C, RNase A-treated EC-12 were washed with PBS and resuspended in the culture medium. Untreated EC-12 were processed in a similar manner, except that the RNase A treatment was omitted.
Bacterial stimulation
Untreated (EC) and RNase A-treated EC-12 (RN) were separately added in a final concentration of 40 μg/mL to individual wells of 24-well cell culture plates where PBMCs were previously seeded. Separately, individual wells of 24-well cell culture plates were also seeded with PBMCs, added an equal volume of EC-12-free culture medium, and used as a negative control (CO). PBMCs were co-cultured with EC-12 for 6 h in an incubator at 37°C in a humidified 5% CO2 environment. The incubation time was determined based on time to induce IL-12 gene expression according to Eisen et al.,1998; Nilsson et al., 2006.
Microarray analysis of PBMCs
After incubation, PBMCs (2–3 wells seeded per donor) were lysed with Trizol (Invitrogen). Total RNA was isolated using a standard chloroform/isopropanol extraction method. With the addition of an RNase-free DNase I (Qiagen) digestion step, total RNA was further extracted using an RNeasy MinElute Cleanup kit (Qiagen, Crawley, UK), as per the manufacturer’s instructions. RNA integrity was determined using an Agilent 2100 Bioanalyzer (Agilent Technologies, Wokingham, UK). Only RNA samples showing RNA integrity numbers (RIN) >8.0 were used for microarray analyses. Cy3-labeled cRNA was synthesized from 25 ng of total RNA using a Low Input Quick Amp Labeling Kit (Agilent Technologies), as per the manufacturer’s instructions. The quality of Cy3-labeled cRNA was verified using a NanoDrop Spectrophotometer (NanoDrop Technologies, Wilmington, DE, USA). Next, samples were then hybridized to the array slide [SurePrint G3 Human GE microarray, 8 × 60 K, V3; Agilent Technologies Japan] for 16 h at 65°C. The array was washed as per the manufacturer’s instructions and scanned with an Agilent G2565CA microarray scanner. Intensity data were extracted using Feature Extraction software (Agilent).
Experiment 2
Cytokine analyses
Except for differences in PBMCs seeding conditions (100 µL at 1 × 10⁷ cells/mL in 96-well plates), PBMCs isolation and bacterial stimulation were conducted as described in Experiment 1. After 20-h incubation, culture supernatants of PBMCs were collected. Concentrations of cytokines were determined in supernatants using a BDTM Human Soluble Protein Master Buffer Kit (BD Biosciences, San Diego, CA, USA). BDTM CBA Flex Sets were used to measure the levels of TNF, IL-8, IL-10, IL-12p70, MIG, and IP-10. Except for that of IL-8 (500-fold), all supernatants were diluted ten-fold with the diluent assay included in a Human Soluble Protein Master Buffer kit, and levels were measured as per the manufacturer’s instructions. Fluorescence intensity of beads was measured using an Accuri™ C 6 Flow Cytometer (BD). Data were analyzed using FCAP Array software (BD), and concentrations of cytokines in culture supernatants were calculated.
Experiment 3
Animals
Fifteen 5-week old female C57BL6/N mice were obtained from a commercial supplier (Japan SLC, Shizuoka, Japan) and acclimatized for eight days prior to experiments. After acclimatization, mice were equally allocated to PBS (control; CO), untreated EC-12 (EC) and RNase A-treated EC-12 (RN) groups. Individual groups were of comparable average body weight.
Mice were kept in a 12-h light, 12-h dark lightning cycle, at 25 ± 2°C and with 55% relative humidity. Feed [Labo MR Stock (NOSAN, Yokohama, Japan)] and non-sterilized tap water (prior to DSS administration) were given ad libitum.
Experiment 3 was carried out as per the guidelines for animal studies of Kyoto Prefectural University. (Approval number: KPU271113-C)
Preparation of 3% DSS
Dextran Sulfate Sodium (DSS) salt, colitis grade (MP Biomedicals M.W 36–50 kDa) was dissolved in distilled water at 30 g/L.
Preparation of untreated EC-12 and RNase A-treated EC-12
Preparation of untreated EC-12 and RNase A-treated EC-12 were carried out as described for Experiment 1. RNA digestion was confirmed by measuring IL-12p40-inducing ability against mouse macrophage-like cells (J774.1 cells) according to Inoue et al., 2011 using BDTM CBA Flex Set for mouse IL-12p40.
Oral administration to mice
The following treatments were orally administered to mice once daily throughout the experiment: 200 µl of PBS (CO), 0.2 mg of non-treated EC-12 (EC) or 0.2 mg of RNase A-treated (RN). Oral administration was carried out using a disposable feeding needle FG5202 [Φ2.0 mm (AS ONE, Osaka, Japan)] attached to a 1-ml syringe (Termo, Tokyo, Japan). After 2-week oral treatment administration, colitis was induced in mice by adding 3% DSS to drinking water.
Dissection and sample collection
Upon 8-day DSS administration, mice were injected 30 µl of sodium pentobarbital (Kyoritsu Seiyaku, Tokyo, Japan) intraperitoneally, killed and exsanguinated. Next, the abdomen of the mice was incised, and the full colon was removed and measured. The colon was then vertically cleaved, rinsed with PBS, stretched and immersed in neutral buffered 10% formalin. Colonic tissues were stored at 4°C until further use.
Assessment of colitis symptoms by disease activity index
During the DSS administration period, colitis symptoms were assessed every day at 16:30. Symptoms were recorded using a disease activity index (DAI), which, as previously described [Citation27], was calculated as a cumulative score of three parameters: weight loss, stool consistency, and perianal bleeding.
Histopathologic evaluation
Mice were treated with DSS because it was reported to inhibit crypt cell proliferation and to promote apoptosis, leading to crypt loss and inflammation [Citation28,Citation29]. Colon section samples for analysis were prepared using 10% neutral formalin-fixed tissues according to Inoue et al. [Citation30]. Crypt depth in colon samples was measured under an optical microscope at a magnification of 100×. The depth of 15 crypts per field from eight randomly selected colon samples (total 120 crypts) was measured. It is worth noting that when not all 15 crypts were observed in one field, the depth of all measurable crypts remaining in that particular field was measured. Image integration software NIS-Elements D (Nikon, Tokyo, Japan) was used to measure the depth of crypts.
Data analysis
Experiment 1
To minimize statistical variation between array slides, microarray data were normalized using freely available R and Bioconductor software packages. Converted microarray data were statistically analyzed using CLC Main workbench software version 7.6.4 (Qiagen, Tokyo, Japan). Differences in the transformed values of each microarray probe between experimental groups (i.e., CO vs. EC, CO vs. RN, and EC vs. RN) were determined by the Student’s t-test. False discovery rate was considered in this study and thus genes meeting the following criteria were regarded as significant (P < 0.01): Q-value < 0.1, −2 ≤ fold change ≥ 2. For Gene Ontology (GO) analysis, lists of significantly up- or downregulated genes (P < 0.01, Q-value < 0.1, −2 ≤ fold change ≥ 2) were imported into the web-based pathway analysis software Database for Annotation, Visualization and Integrated Discovery (DAVID); GO analysis was then conducted to detect the processes in which they were involved. DAVID is based on established biomedical literature and uses specific approaches to estimate significance [Citation31]. GO terms with FDR<0.05 were identified as significantly affected.
Experiment 2 and 3
Data are presented as the mean values ± standard errors. Statistical analysis was conducted using R and its packages “userfriendlyscience” and “nparLD”.
The effect of experimental treatments on cytokine production and colon length, crypt depth between groups was analyzed using Kruskal–Wallis. When significant differences were detected, Games-Howell test post hoc comparisons were used by R package “userfriendlyscience”.
DAI scores from the first day of DSS administration (day 1) to the day prior to dissection (day 7) were analyzed by R package “nparLD” which is for nonparametric analysis for repeated measures data in factorial designs. Because significant interaction was found between the groups and days, the effect of experimental treatments on daily DAI score was separately analyzed using Kruskal–Wallis. When significant differences were detected, Games-Howell test post hoc comparisons were used.
For all statistical analyses, P < 0.05 was considered statistically significant.
Results
Experiment 1
Microarray
Raw and processed microarray data were submitted to Gene Expression Omnibus (accession number GSE126161, available from 30 Jun-2019)
Effect of RNase A treatment to EC-12 on gene expression
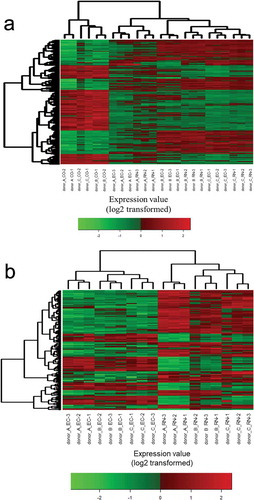
The number of genes differentially expressed (t-test; P < 0.01, −2 ≤ fold change ≥ 2 and having a Q-value < 0.1) between EC and RN groups was 120, 39 of which were significantly lower in RN. In addition, the number of genes differentially expressed between CO and EC and CO and RN was 913 (high:379; low: 534) and 725 (high: 353; low: 372), respectively. The heat map shown in was generated based on differentially expressed gene probes in all groups (ANOVA; P< 0.05, −4 ≤ fold change ≥ 4). The heat map shows that while the transcriptome profile of CO was different from those of treatment groups, no distinct differences were found between EC and RN. To make the difference between EC and RN clearer, the heat map shown in was created based on differentially expressed gene probes (t-test; P < 0.01, −4 ≤ fold change ≥ 4) between these two groups (EC and RN). clearly shows the gene expression profiles between EC and RN differ from each other.
Figure 1. Microarray-based heat maps of differentially expressed gene probes in human PBMCs stimulated by untreated EC-12- or RNase A-treated EC-12. The heat map was produced by hierarchical clustering of the gene probe set data that met the following criteria: (a) ANOVA (medium vs untreated EC-12, RNase A-treated EC-12); P < 0.05, −4 ≤ fold change ≥ 4 and (b) t-test (untreated EC-12 vs RNase A-treated EC-12); P < 0.01, −4 ≤ fold change ≥ 4.
Pathways identified in PBMCs stimulated by EC-12 with or without RNase A treatment
Biological pathways that exerted significant effects on PBMCs in CO vs EC and CO vs RN are listed in . The numbers of pathways upregulated and downregulated from CO to EC were 7 and 15, respectively. In addition, the numbers of pathways upregulated and downregulated from CO to RN were 3 and 20, respectively. All pathways downregulated from CO to EC were common to the pathways downregulated from CO to RN. However, the only pathway commonly upregulated from CO to EC and RN was chemokine activity.
Table 1. GO analysis of differentially expressed genes between PBMCs of experimental groups (medium vs untreated EC-12, medium vs RNase A- treated EC-12, untreated EC-12 vs RNase A- treated EC-12).
Comparisons of the biological pathways in human PBMCs induced by untreated and RNase A-treated EC-12 were carried out. Biological pathways that exerted significant effects on PBMCs in EC and RN are also listed in . The numbers of pathways upregulated and downregulated from EC to RN were 1 and 3, respectively. For example, pathways related to inflammation such as inflammatory response (GO: 0006954) and CXCR3 chemokine receptor binding (GO:0048248) were found among those downregulated from EC to RN. Furthermore, among the eight genes downregulated in pathway inflammatory response, six were cytokines (CXCL8, CXCL9, CXCL10, CXCL11, IL-27, TNF).
Experiment 2
Effect of RNase A treatment of EC-12 on cytokine-inducing ability in human pbmcs
Individual cytokine production levels are shown in . Production of IL-12 drastically decreased upon stimulation of human PBMCs with RNase A-treated EC-12. Furthermore, production of IL-12 induced by RNase A-treated EC-12 was < 10% that induced by non-treated EC-12 (P < 0.01), which was in agreement with our previous studies [Citation22,Citation26]. In addition, treating EC-12 with RNase A also decreased TNF and IP-10 production. In contrast, production of IL-10 induced by RNase A-treated EC-12 was more than fourfold that detected in CO and nearly equal to that induced by untreated EC-12, which indicated that treating with RNase A did not affect IL-10 production.
Figure 2. Effect of RNase A treatment of EC-12 on cytokines inducing ability in human PBMCs.Untreated and RNase A-treated heat-killed E. faecalis EC-12 were co-cultured with PBMCs obtained from three donors, for 20 h. The protein concentrations of cytokine in the culture supernatant were measured by cytometric beads array (CBA). Data are expressed as a relative percentage to untreated EC-12. The values above the bars of untreated EC-12 indicate the mean concentrations of cytokines (pg/mL or ng/mL) in each donor. CO: medium (negative control); EC: untreated E. faecalis EC-12, RN: RNase A-treated EC-12. Columns with different letters are significantly different (P < 0.05), mean ± SE, n = 3 per donor.
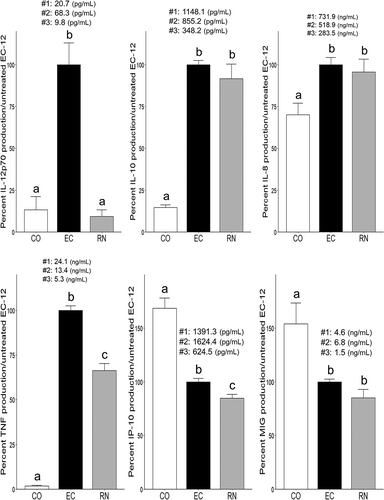
In addition, MIG and IL-8 production was not affected by RNase A treatment. Lastly, the production of IP-10 and MIG was significantly lower in both EC and RN than in CO.
Experiment 3
Assessment of colitis symptoms by DAI
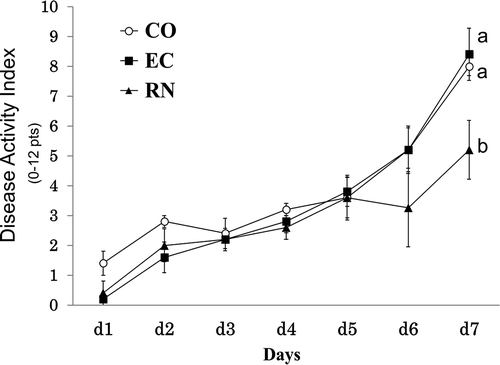
DAI scores of all groups during DSS administration are shown in . DAI scores increased in all groups from day 2 of DSS administration. At day 6 of DSS administration, DAI scores were 5.2 ± 0.73 (CO), 5.2 ± 0.80 (EC) and 3.3 ± 1.31 (RN), although no significant differences were detected among experimental groups, the DAI score of RN was lower than that of CO or EC. At day 7 of DSS administration, DAI scores were 8.0 ± 0.32 (CO), 8.4 ± 0.87 (EC) and 5.2 ± 0.98 (RN). The DAI scores of RN were significantly lower than that of CO or EC (P < 0.01).
Figure 3. Transition of DAI after DSS administration in mice. Mice in experimental groups were orally administered PBS (CO, negative control), untreated EC-12 (EC) or RNase A-treated EC-12 (RN). After 2-week oral administration, colitis was induced by adding 3% DSS to drinking water. During DSS administration, colitis symptoms were monitored daily by DAI (cumulative score of weight loss, stool consistency, and perianal bleeding). Nonparametric test for repeated measures data showed a significant difference among groups (P = 0.01) and among days (P < 0.01). However, a significant correlation between groups and days (P < 0.01) was found and thus the daily DAI score was separately evaluated by Kruskal–Wallis followed by Games-Howell post-hoc test. Point with different letters are significantly different (P < 0.05), mean ± SE, n = 5.
Colon length and histopathological evaluation of colon samples
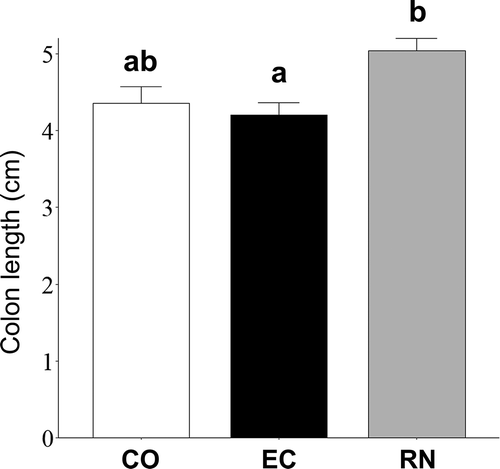
Colon was significantly longer (P < 0.05) in RN (5.04 ± 0.16 cm) than in EC (4.20 ± 0.16 cm) and tended to be longer (P = 0.082) in RN than in CO (4.36 ± 0.21 cm) ().
Figure 4. Preventive effect of RNase A-treated EC-12 on DSS-induced colon shortening in mice. After 8-day DSS administration, all mice were killed for dissection. The abdomen of mice was incised, and their full colon removed and measured. CO: medium (negative control); EC: untreated E. faecalis EC-12, RN: RNase A-treated EC-12. Columns with different letters are significantly different (P < 0.05). n = 5. Mean ± SE.
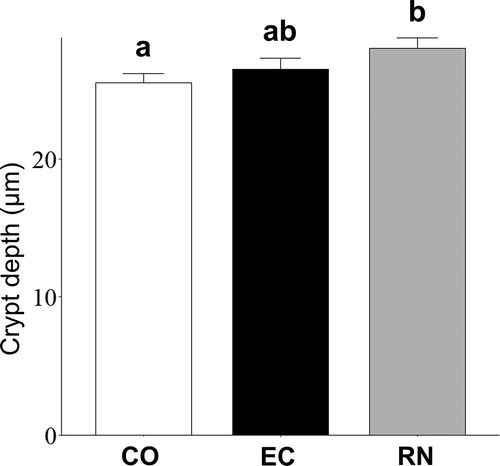
Upon measurement and compared with that observed in samples from CO, it was detected that crypt depth in RN was more pronounced than that in EC (P < 0.05) (). However, no significant difference was detected between EC and RN.
Figure 5. Effect of RNase A-treated EC-12 on crypts in colon tissues of mice suffering from colitis induced by DSS. Depth of crypts in colon section samples was measured under an optical microscope at a magnification of 100×, to evaluate inflammation. Columns with different letters are significantly different (P < 0.05). Mean ± SE, n = 5.
Discussion
Recent studies have suggested that not only live but also heat-killed LAB exert immunomodulatory effects on the host. These effects originate from the recognition of LAB components by immune cells, which induce production of various cytokines. Interestingly, LAB induce simultaneous production of both pro- and anti-inflammatory cytokines, the ratio of which depends on the LAB strain. In that context, we previously reported that the RNA of EC-12 acted as an IL-12-inducing immunogenic component. Thus, we hypothesized that RNase A-treated EC-12 may possess stronger anti-inflammatory properties than untreated EC-12.
In Experiment 1, the effect of RNase A treatment on EC-12 was evaluated by analyzing via microarray techniques the transcriptome profiles and biological pathways in human PBMCs. Heat-killed EC-12 were used because viable bacteria did not allow nucleic acid digestion by extracellularly added nuclease [Citation22].
The heat map in generated with data from CO and treatment groups shows that the transcriptome profiles were different, although no distinct differences were found between EC and RN. However, while the heat map (which was based on differentially expressed gene probes between EC and RN) clearly shows that transcriptome profiles were all different, the transcriptome profile induced by RNase A-treated EC-12 was not entirely different from that caused by untreated EC-12. Therefore, EC-12 does not become completely different material due to RNase A treatment; however, RNase-treated one is a different material from untreated one.
In light of the aforementioned results, we assessed the changes in biological pathways using GO analysis. All pathways downregulated from CO to EC were common to the pathways downregulated from CO to RN. In contrast, the pathways upregulated from CO to EC, such as cellular response to interleukin-1 (GO: 0071347) and chemokine-mediated signaling pathway (GO: 0070098) were not observed in pathways upregulated from CO to RN. These results seemed to indicate that RNase A treatment of EC-12 inhibited cytokine-related pathways in human PBMCs upon stimulation. Next, we compared the changes in pathways between EC and RN. In pathways downregulated from EC to RN, inflammation pathways such as inflammatory response and CXCR3 chemokine receptor binding were observed. The inflammation response pathway included cytokine genes such as CXCL8 (IL-8), CXCL9 (MIG), CXCL10 (IP-10), TNF and IL-27. Regarding the genes for IL-12, namely IL12A and IL12B, the expression of the former gene was significantly higher in EC than CO, while it was not the case in RN compared to CO. The expression of the latter gene was unchanged among the experimental groups. It has been reported that, upon bacterial stimulation, gene expression of IL-12 was induced slower than that of other cytokines such as TNF [Citation32]. In the present study, since RNA extracted from PBMCs co-cultured with EC-12 for 6 h was used for microarray analysis, we deduced that the co-cultivation time was too short to detect differences in expression of gene IL-12 between EC and RN.
The results from Experiment 1 indicated that the treatment of EC-12 with RNase A changed the transcriptome profile and inhibited the inflammatory response pathway in human PBMCs. In addition, the pathway included cytokine genes such as CXCL8 (IL-8), CXCL9 (MIG), CXCL10 (IP-10), TNF. To confirm this presumption, we measured the production of these cytokines along with IL-12p70 and IL-10 upon stimulation with RNase A-treated EC-12 in human PBMCs. IL-12p70 was included because we previously showed that RNase A treatment of EC-12 reduced IL-12p70 production in human immune cells [Citation26]. Moreover, among major cytokines, IL-12 and IL-10 are the most typically induced by LAB, as mentioned above.
Digestion of RNA drastically reduced (> 90%) the IL-12p70-inducing ability of EC-12, in agreement with our previous study. TNF-inducing ability of EC-12 was also significantly reduced (> 30%). By contrast, treating EC-12 with RNase A had little effect on their IL-10 inducing-ability. Although bacterial RNA is reported to induce TNF-α production in human PBMCs [Citation33,Citation34], little has been reported about the induction of IL-10 production by bacterial RNA. Nonetheless, several studies have previously reported that the cell wall of Gram-positive bacteria such as Enterococcus faecalis played a major role in IL-10 production in human immune cells [Citation35–Citation38]. Those investigations indicated that the cell wall of EC-12 induced production of IL-10. Likewise, in the present work, treating EC-12 with RNase A did not significantly reduce IL-8 production. Previous work showed that DNA and cell wall components of Gram-positive bacterial, especially lipoteichoic acid (LTA) and peptidoglycan (PGN), induced IL-8 production in human and mouse immune cells [Citation39–Citation41]. Thus, apart from their RNA, the other reason treating EC-12 with RNase A not only did not reduce but likely induced production of IL-8, may have been components in their cell wall.
Treating EC-12 reduced production of IP-10 and MIG. Li et al. reported that S. aureus, a Gram-positive bacterium, inhibited IFN-γ signaling in human PBMCs, which in turn decreased the production of IP-10 and gene expression of MIG [Citation42]. Thus, in the present study EC-12 likely inhibited IFN-γ signaling in PBMCs, which also resulted in lower IP-10 and MIG production.
The results from Experiment 2 were promising, as they indicated that RNase A treatment reduced the ability of EC-12 to induce production of IL-12p70, TNF, IP-10, but not IL-10. While cytokines TNF-α, IL-8, IL-12p70, MIG, and IP-10 have been associated with the development of IBD, IL-10 is known for its important role in the suppression of this disorder [Citation16,Citation43–Citation45].
Thus, based on the information obtained from the first two experiments, in Experiment 3 we evaluated the anti-inflammatory effects of RNase A-treated EC-12 on a mouse model of DSS-induced colitis. In comparison with those of CO and EC, by day 6, the DAI score of RN tended to be lower and on day 7, it became significantly lower. These results indicated that colitis symptoms between RN and the other groups began to differentiate in a 2-day window that resulted in severe colitis by day 7. As DAI scores were not significant between CO and EC, it can be inferred that the administration of RNase A-treated EC-12 to mice helped ameliorate DSS-induced colitis symptoms.
Due to colon shortens as colitis progresses, its length is regarded as an index for colitis evaluation [Citation46]. The colon length was significantly longer in RN than in EC and tended to be longer than in CO. Nonetheless, the colon length did not differ between CO and EC. These results demonstrated that, unlike untreated EC-12, RNase A-treated EC-12 administered to mice helped prevent the shortening of the colon. However, the mean colon length of age-matched healthy female C57BL6/N mice evaluated in another experiment was 5.8 cm that is still longer than that in RN. Therefore, RNase-treated EC-12 alleviated but not completely prevented the development of colitis.
Similarly, crypt depth has been shown to become shallower in mice models of IBD as colitis progresses [Citation28,Citation47,Citation48]. Thus, crypt depth is also regarded as an index for colitis evaluation. Crypt depth was significantly more pronounced in RN than in CO and tended to be deeper in EC than in CO. However, crypt depth was not significantly different between EC and RN. These results also demonstrated that, regardless of RNase A treatment, EC-12 administered to mice helped alleviate damage/atrophy of colon tissues, crypts included, although treating EC-12 with RNase A may have somewhat enhanced the effect. Although the exact mechanism by which EC-12 treated with RNase A achieved prevention of colon shortening and crypt shallowness caused by DSS, it can be theorized that EC-12 supplementation to mice created the following virtuous cycle effect: daily dosages of EC-12 induced production of anti-inflammatory cytokine IL-10, which helped mitigate inflammation of colon tissues caused by DSS-induced colitis, which in turn permitted an increase in colonic crypts; alleviation from inflammation permitted tissues to grow.
It should be mentioned that, to achieve a higher anti-inflammatory effect, past research aimed to select LAB that could induce more IL-10 than IL-12 [Citation4,Citation49]. In contrast, by treating them with RNase A, the present study aimed to modify EC-12 so that they could effectively become an anti-inflammatory agent.
There are other functional foods that show anti-inflammatory effects including omega-3 fatty acids such as eicosapentaenoic acid and docosahexaenoic acid and flavonoids such as quercetin [Citation50–Citation52]. Anti-inflammatory effects of these functional foods apparently are not achieved by IL-10. Omega-3 fatty acids attenuate inflammation via their metabolites such as resolvins, while quercetin via preventing the activation of extracellular signal-related kinase (ERK) and/or nuclear factor-κB (NF-κB) [Citation50–Citation54]. Therefore, we believe that RNase-treated EC-12 can effectively be used as an anti-inflammatory agent in conjunction with these functional foods.
To summarize, the present work demonstrated that colitis symptoms were milder in RN than in CO. Moreover, due to no anti-inflammatory effects were observed in EC, it was estimated that EC-12 treated with RNase A likely became an in vivo anti-inflammatory agent primarily inducing IL-10 production, as our in vitro work with human PBMCs also showed.
Author contribution
R.I. designed research, R.T. M.T. S.T. and R.I. performed the experiments, Y.M-I. and T.I. prepared the bacterial materials, R.T. and R.I. wrote the manuscript. All authors have read and approved the final manuscript.
Acknowledgments
We thank Mr. Yuki Kawada and Ms. Rana Kobayashi (Kyoto Prefectural University) for skillful technical assistance.
Disclosure statement
Y.M-I. and T. I. are employed by Combi Corporation. R.I. received collaboration research fund from Combi Corporation. Other authors have no conflict of interest.
References
- Kang H, Oh YJ, Ahn KS, et al. Leuconostoc citreum HJ-P4 (KACC 91035) regulates immunoglobulin E in an ovalbumin-induced allergy model and induces interleukin-12 through nuclear factor-kappa B and p38/c-Jun N-terminal kinases signaling in macrophages. Microbiol Immunol. 2009;53:331–339.
- Tobita K, Yanaka H, Otani H. Heat-treated lactobacillus crispatus KT strains reduce allergic symptoms in mice. J agri food chem. 2009;57:5586–5590.
- Hsieh PS, An Y, Tsai YC, et al. Potential of probiotic strains to modulate the inflammatory responses of epithelial and immune cells in vitro. New Microbiol. 2013;36:167–179.
- Sokol H, Pigneur B, Watterlot L, et al. Faecalibacterium prausnitzii is an anti-inflammatory commensal bacterium identified by gut microbiota analysis of Crohn disease patients. Proc Natl Acad Sci[Internet]. 2008;105:16731–16736. Available from: http://www.pnas.org/cgi/doi/10.1073/pnas.0804812105
- Murosaki S, Muroyama K, Yamamoto Y, et al. Antitumor effect of heat-killed Lactobacillus plantarum L-137 through restoration of impaired interleukin-12 production in tumor-bearing mice. Cancer Immunol Immunother. 2000;49:157–164.
- Terada A, Bukawa W, Kan T, et al. Microbial ecology in health and disease effects of the consumption of heat-killed enterococcus faecalis ec-12 preparation on microbiota and metabolic activity of the faeces in healthy adults effects of the consumption of heat-killed enterococcus faecalis. Microb ecolo health dis. 2009;2235:188–194.
- Kawase M, He F, Kubota A, et al. Heat-killed Lactobacillus gasseri TMC0356 protects mice against influenza virus infection by stimulating gut and respiratory immune responses. FEMS Immunol Med Microbiol. 2012;64:280–288.
- Miettinen M, Matikainen S, Vuopio-Varkila J, et al. Lactobacilli and streptococci induce interleukin-12 (IL-12), IL-18, and gamma interferon production in human peripheral blood mononuclear cells. Infect Immun. 1998;66:6058–6062.
- Tsai YT, Cheng PC, Pan TM. The immunomodulatory effects of lactic acid bacteria for improving immune functions and benefits. Appl Microbiol Biotechnol. 2012;96:853–862.
- Kechaou N, Chain F, Gratadoux JJ, et al. Identification of one novel candidate probiotic lactobacillus plantarum strain active against influenza virus infection in mice by a large-scale screening. Appl Environ Microbiol. 2013;79:1491–1499.
- Foligne B, Nutten S, Grangette C, et al. Correlation between in vitro and in vivo immunomodulatory properties of lactic acid bacteria. World J Gastroenterol. 2007;13:236–243.
- Christensen HR, Frøkiaer H, Pestka JJ. Lactobacilli differentially modulate expression of cytokines and maturation surface markers in murine dendritic cells. J Immunol. [Internet]. 2002 [cited 2019 Jan 8];168:171–178. Available from: http://www.jimmunol.org/content/168/1/171http://www.jimmunol.org/content/168/1/171.full#ref-list-1
- Hart AL, Lammers K, Brigidi P, et al. Modulation of human dendritic cell phenotype and function by probiotic bacteria. Gut. [Internet]. 2004 [cited 2019 Jan 8];53:1602–1609. Available from: http://www.ncbi.nlm.nih.gov/pubmed/15479680
- Shibuya K, Robinson D, Zonin F, et al. IL-1 alpha and TNF-alpha are required for IL-12-induced development of Th1 cells producing high levels of IFN-gamma in BALB/c but not C57BL/6 mice. J Immunol. 1998;160:1708–1716.
- Mosmann TR, Sad S. The expanding universe of T-cell subsets: th1, Th2 and more. Immunol Today. 1996;17:138–146.
- Papadakis K, Targan S. Role of cytokines in the pathogenesis of inflamatory bowl disease. Annu Rev Ethesis. 2000;51:289–298.
- Blanco P, Palucka AK, Pascual V, et al. Dendritic cells and cytokines in human inflammatory and autoimmune diseases. Cytokine Growth Factor Rev. 2008;19:41–52.
- Steidler L, Hans W, Schotte L, et al. Treatment of murine colitis by lactococcus secreting interleukin-10. Adv Sci[Internet]. 2011;289:1352–1355. Available from: http://www.ncbi.nlm.nih.gov/htbin-post/Entrez/query?db=m&form=6&dopt=r&uid=10958782
- Leach MW, Davidson NJ, Fort MM, et al. The Role of IL-10 in inflammatory bowel disease: “Of Mice and Men. Toxicol Pathol. 1999;27:123–133.
- Fiorentino DF, Zlotnik A, Vieira P, et al. IL-10 acts on the antigen-presenting cell to inhibit cytokine production by Th1 cells. J Immunol. [Internet]. 1991 [cited 2018 Jul 31];146:3444–3451. Available from: http://www.ncbi.nlm.nih.gov/pubmed/1827484
- Ren M, Abrams J, Bennett B, et al. Interleukin 10(IL-10) Inhibits Cytokine Synthesis by Human Monocytes: an Autoregulatory Role of IL-10 Produced by Monocytes. J Exp Med. 1991;174:1209–1220.
- Inoue R, Nagino T, Hoshino G, et al. Nucleic acids of Enterococcus faecalis strain EC-12 are potent Toll-like receptor 7 and 9 ligands inducing interleukin-12 production from murine splenocytes and murine macrophage cell line J774. 1. FEMS Immunol Med Microbiol. 2011;61:94–102.
- Terada A, Bukawa W, Kan T, et al. Effects of the consumption of heat-killed enterococcus faecalis EC-12 preparation on microbiota and metabolic activity of the faeces in healthy adults. Microb Ecol Health Dis. [Internet]. 2004 [cited 2019 Jan 4];16:188–194. Available from: http://citeseerx.ist.psu.edu/viewdoc/download?doi=10.1.1.1009.880&rep=rep1&type=pdf
- Inoue R, Tsukahara T, Noda M, et al. Oral administration of a heat-killed cell preparation of enterococcus faecalis strain EC-12 stimulates the gene expression of Na þ-K þ-2Cl À co-transporter 1 in rat ileal epithelial cells. Biosci Biotechnol Biochem. [Internet]. 2006 [cited 2019 Feb 26]; Available from: https://www.jstage.jst.go.jp/article/bbb/71/3/71_60589/_pdf
- Sakai Y, Tsukahara T, Bukawa †W, et al. Cell preparation of enterococcus faecalis strain EC-12 prevents vancomycin-resistant enterococci colonization in the cecum of newly hatched chicks. Poult Sci. [Internet]. 2006 [cited 2019 Feb 26]; Available from: https://academic.oup.com/ps/article-abstract/85/2/273/1530962
- Nishibayashi R, Inoue R, Harada Y, et al. RNA of Enterococcus faecalis strain EC-12 is a major component inducing interleukin-12 production from human monocytic cells. PLoS One. 2015;10:1–13.
- Mennigen K, Rijcken E, Utech M, et al. Probiotic mixture VSL #3 protects the epithelial barrier by maintaining tight junction protein expression and preventing apoptosis in a murine model of colitis. Am J Physiol Gastrointest Liver Physiol. 2009;296:G1140–G1149.
- Kullmann F, Messmann H, Alt M, et al. Clinical and histopathological features of dextran sulfate sodium induced acute and chronic colitis associated with dysplasia in rats. Int J Colorectal Dis. 2001;16:238–246.
- Kitajima S, Takuma S, Morimoto M. Tissue distribution of dextran sulfate sodium (DSS) in the acute phase of murine DSS-induced colitis. J Vet Med Sci. [Internet]. 1999;61:67–70. Available from: http://www.ncbi.nlm.nih.gov/pubmed/10027168
- Inoue R, Tsuruta T, Nojima I, et al. Postnatal changes in the expression of genes for cryptdins 1–6 and the role of luminal bacteria in cryptdin gene expression in mouse small intestine. FEMS Immunol Med Microbiol. [Internet]. 2008 [cited 2019 Jan 7];52:407–416. Available from: https://academic.oup.com/femspd/article-lookup/doi/10.1111/j.1574-695X.2008.00390.x
- Huang DW, Sherman BT, Lempicki RA. Systematic and integrative analysis of large gene lists using DAVID bioinformatics resources. Nat Protoc. [Internet]. 2009 [cited 2018 Aug 1];4:44–57. Available from: http://www.nature.com/articles/nprot.2008.211
- Kuwata H, Matsumoto M, Atarashi K, et al. IκBNS inhibits induction of a subset of toll-like receptor-dependent genes and limits inflammation. Immunity. 2006;24:41–51.
- Eberle F, Sirin M, Binder M, et al. Bacterial RNA is recognized by different sets of immunoreceptors. Eur J Immunol. 2009;39:2537–2547.
- Love AC, Schwartz I, Petzke MM. Borrelia burgdorferi RNA induces type I and III interferons via toll-like receptor 7 and contributes to production of NF-κB-dependent cytokines. Infect Immun. [Internet]. 2014 [cited 2018 Aug 8];82:2405–2416. Available from: http://iai.asm.org/
- Moreira LO, El Kasmi KC, Smith AM, et al. The TLR2-MyD88-NOD2-RIPK2 signalling axis regulates a balanced pro-inflammatory and IL-10-mediated anti-inflammatory cytokine response to Gram-positive cell walls. Cell Microbiol. 2008;10:2067–2077.
- Sparo M, Delpech G, Batisttelli S, et al. Immunomodulatory properties of cell wall extract from Enterococcus faecalis CECT7121. Brazilian J Infect Dis[Internet]. 2014;18:551–555. Available from: http://dx.doi.org/10.1016/j.bjid.2014.05.005
- Miettinen M, Vuopio-Varkila J, Varkila K. Production of human tumor necrosis factor alpha, interleukin-6, and interleukin-10 is induced by lactic acid bacteria. Infect Immun. 1996;64:5403–5405.
- Kaji R, Kiyoshima-Shibata J, Nagaoka M, et al. Bacterial teichoic acids reverse predominant IL-12 production induced by certain lactobacillus strains into predominant IL-10 production via TLR2-dependent ERK activation in macrophages. J Immunol. [Internet]. 2010 [cited 2019 Jan 17];184:3505–3513. Available from: http://www.ncbi.nlm.nih.gov/pubmed/20190136
- Lammers KM, Brigidi P, Vitali B, et al. Immunomodulatory effects of probiotic bacteria DNA: IL-1 and IL-10 response in human peripheral blood mononuclear cells. FEMS Immunol Med Microbiol. 2003;38:165–172.
- Su SC, Hua KF, Lee H, et al. LTA and LPS mediated activation of protein kinases in the regulation of inflammatory cytokines expression in macrophages. Clin Chim Acta. 2006;374:106–115.
- Wang Q, Dziarski R, Kirschning CJ. Micrococci and peptidoglycan activate NF- κ B signal transduction pathway that induces transcription of interleukin-8 micrococci and peptidoglycan activate TLR2 3 MyD88 3 IRAK 3 TRAF 3 NIK 3 IKK 3 NF- B signal transduction pathway that induces transcrip. Infect Immun. 2001;69:2–9.
- Li Z, Levast B, Madrenas J. Staphylococcus aureus Downregulates IP-10 production and prevents Th1 cell recruitment. J Immunol. [Internet]. 2017;198:1865–1874. Available from: http://www.jimmunol.org/lookup/doi/10.4049/jimmunol.1601336
- Ostvik AE, A V G, Bugge M, et al. Enhanced expression of CXCL10 in inflammatory bowel disease: potential role of mucosal toll-like receptor 3 Stimulation. Inflamm Bowel Dis. 2013;19:265–274.
- Singh U, Venkataraman C, Singh R, et al. CXCR3 axis: role in inflammatory bowel disease and its therapeutic implication. Endocrine‚ Metab Immune Disord Targets [Internet]. 2007;7:111–123. Available from: http://www.eurekaselect.com/openurl/content.php?genre=article&issn=1871-5303&volume=7&issue=2&spage=111
- Grimm MC, Doe WF, Doe WF, et al. Interleukin 8: cells of origin in inflammatory bowel disease. Gut. [Internet]. 1996 [cited 2019 Jan 17]. 38:90–98. Available from: https://www.ncbi.nlm.nih.gov/pmc/articles/PMC1382985/pdf/gut00502-0106.pdf
- Park YH, Kim N, Shim YK, et al. Adequate dextran sodium sulfate-induced colitis model in mice and effective outcome measurement method. J Cancer Prev[Internet]. 2015;20:260–267. Available from: http://www.jcpjournal.org/journal/view.html?doi=10.15430/JCP.2015.20.4.260
- Cooper HS, Murthy SN, Shah RS, et al. Clinicopathologic study of dextran sulfate sodium experimental murine colitis. Lab Invest. [Internet]. 1993 [cited 2019 Jan 20];69:238–249. Available from: http://www.ncbi.nlm.nih.gov/pubmed/8350599
- Erben U, Loddenkemper C, Doerfel K, et al. A guide to histomorphological evaluation of intestinal inflammation in mouse models. Int J Clin Exp Pathol. [Internet]. 2014 [cited 2019 Jan 20];7:4557–4576. Available from: http://www.ncbi.nlm.nih.gov/pubmed/25197329
- Toshimitsu T, Ozaki S, Mochizuki J, et al. Effects of Lactobacillus plantarum Strain OLL2712 Culture Conditions on the Anti-inflammatory Activities for murine immune cells and obese and type 2 diabetic mice [Internet]. Appl Environ Microbiol. 2017 [cited 2019 Jan 17];83. Available from: http://aem.asm.org/
- Rozangela V, Renata G, Carla CK, et al. Effects of EPA and DHA on proliferation, cytokine production, and gene expression in raji cells. Lipids. [Internet]. 2004 [cited 2019 Feb 27];39:857–864. Available from: http://www.ncbi.nlm.nih.gov/BLAST
- Comalada M, Camuesco D, Sierra S, et al. in vivo quercitrin anti-inflammatory effect involves release of quercetin, which inhibits inflammation through down-regulation of the NF-κB pathway. Eur J Immunol. [Internet]. 2005 [cited 2019 Feb 27];35:584–592. Available from: http://doi.wiley.com/10.1002/eji.200425778
- Serhan CN, Petasis NA. Resolvins and protectins in inflammation resolution. Chem Rev. [Internet]. 2011 [cited 2019 Mar 4];111:5922–5943. Available from: https://pubs.acs.org/doi/10.1021/cr100396c
- Boots AW, Wilms LC, Swennen ELR, et al. In vitro and ex vivo anti-inflammatory activity of quercetin in healthy volunteers. Nutrition. [Internet]. 2008 [cited 2019 Feb 27];24:703–710. Available from: https://www.sciencedirect.com/science/article/pii/S089990070800172X
- Li Y, Yao J, Han C, et al. Quercetin, Inflammation and Immunity. Nutrients. [Internet]. 2016 [cited 2019 Mar 3];8:167. Available from: http://www.ncbi.nlm.nih.gov/pubmed/26999194