
 ?Mathematical formulae have been encoded as MathML and are displayed in this HTML version using MathJax in order to improve their display. Uncheck the box to turn MathJax off. This feature requires Javascript. Click on a formula to zoom.
ABSTRACT
Chitin, poly (β-(1→4)-N-acetyl-d-glucosamine), is an important biopolymer for insects that is utilized as a major component of peritrophic membrane. The chitin content in peritrophic membrane is of expedient interest from a pest control perspective, although it is hard to quantify chitin. In this study, we establish a facile method for the quantification of chitin in peritrophic membrane by image processing. In this method, chitin was indirectly quantified using chitosan–I3− complex, which exhibited a specific red-purple color. A calibration curve using a chitosan solution showed good linearity in a concentration range of 0.05–0.5 μg/μL. We quantified the amount of chitin in peritrophic membrane of Spodoptera litura (Lepidoptera: Noctuidae) larvae using this method. Throughout the study, only common inexpensive regents and easily attainable apparatuses were employed. This method can be easily applied to the sensitive quantification of the amounts of chitin and chitosan in materials by wide range of researchers.
Abbreviations: LOD: limit of detection; LOQ: limit of quantification; ROI: region of interest; RSD: relative standard deviation.
GRAPHICAL ABSTRACT
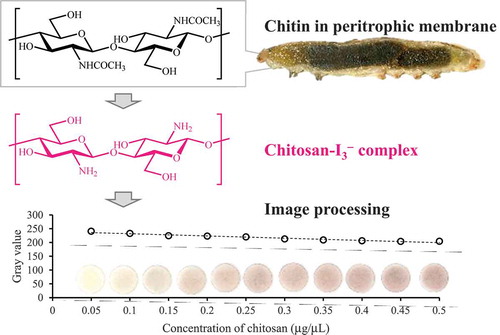
Chitin in peritrophic membrane of insects was quantified by image processing with an
easy, inexpensive and sensitive method.
Chitin, poly (β-(1→4)-N-acetyl-d-glucosamine), is a major biopolymer in many invertebrates and exhibits a high rigidity and chemical stability [Citation1,Citation2]. In insects, chitin is found in many tissues, such as cuticle, peritrophic membrane, trachea, and eggshells [Citation3–Citation5]. The strength of these tissues is enhanced by chitin fibers and contributes to defense from environmental elements.
The peritrophic membrane is composed of chitin which accounts for 3–13% of its dry weight [Citation6]. Chitin forms a lattice structure by first organizing into microfibrils (2–6 nm diameter, 20–400 chains) which are further assembled into bundles (about 20 nm diameter), and these bundles are compiled into lattices (about 150 nm lattice width) [Citation7,Citation8]. This lattice is a structural scaffold for many molecules with important roles in the insect intestine: mucins, glycans, peritrophins, and digestive enzymes. The main functions of the peritrophic membrane are to separate digestive processes and protect midgut epithelial cells from toxins, pathogens, and mechanical damage [Citation9–Citation11]. Because of the importance of peritrophic membrane in the physiologies of the insect intestine, chitin metabolism (e.g. biosynthesis, modification, and degradation) is one of the most effective targets for pest management strategies [Citation12–Citation14].
In a study of chitin metabolism in peritrophic membrane, the amount of chitin is one of the main concerns. However, it is difficult to directly quantify the amount of chitin in the membrane due to its inherit stability and insolubility. In many previously described procedures, chitin is indirectly quantified using its monomer, N-acetylglucosamine or glucosamine [Citation15,Citation16]; however, these approaches require many experimental steps and time. Larionova et al. [Citation17] and Prochazkov [Citation18] developed a quantification method of chitosan, poly (β-(1→4)-d-glucosamine), which is easily obtained by deacetylation of chitin with alkali solution [Citation16,Citation19]. The quantification of chitosan was also demonstrated by Nitschke et al. [Citation20] using a colored complex of chitosan with Lugol’s solution. Lucero et al. [Citation21] directly quantified the amount of chitin using wheat germ agglutinin and peroxidase. Each of these procedures requires extended treatment times, cost, or special equipment.
In the current study, we demonstrate an easy, inexpensive, and sensitive method for the quantification of chitin in insect peritrophic membrane by image processing. In this method, chitin was converted to chitosan by alkali solution; subsequently, chitosan was converted to a red-purple chitosan–I3− complex and quantified by image processing. We used only common inexpensive reagents and easily accessible materials. With this method, the chitin content in peritrophic membrane of Spodoptera litura (Lepidoptera: Noctuidae) was quantified. This method can readily be utilized in many laboratories.
Materials and methods
Chemicals
Chitosan 100 (≥80% deacetylation rate), iodine, potassium iodine, potassium chloride, potassium hydroxide, sodium hydroxide, and acetic acid were purchased from FUJIFILM Wako Pure Chemical Co. (Osaka, Japan).
Insects
Common cutworms, S. litura larvae (Lepidoptera: Noctuidae), were reared on artificial diet (Insecta-LFS, Nihon Nosan Kogyo Ltd., Yokohama, Japan), at 24°C under a 16 h/8 h (light/dark) cycle. The developmental stages were synchronized at each molt by collecting new larvae.
General procedure for quantification of chitosan
Thirty μL of chitosan solution in acetic acid (10%, v/v) was applied dropwise onto paper discs (paper disc for antibiotic assay, 8 mm diameter, 1.5 mm thickness; Toyo Roshi Kaisha, Ltd., Tokyo, Japan). After drying for 10 min, 30 μL of Lugol’s solution (0.33% (w/v) I2 and 0.67% (w/v) KI in H2O was added onto the paper discs to form chitosan–I3−. Eight minutes after addition, the treated paper discs were immersed in 1 mL of H2O in 1.5 mL tube for 2 min to remove excess Lugol’s solution. The paper discs were blotted with a filter paper and immediately scanned by a multifunction printer (imagio MP C5000; Ricoh Company, Ltd., Tokyo, Japan) at 600 dpi. The obtained images were saved as PDF files and imported into image processing software, ImageJ with Fiji plug-ins, which is freely downloadable from the FIJI website (http://pacific.mpi-cbg.de/wiki/index.php/Fiji [Citation22];). A circle-shaped region of interest (ROI) (23 pixels diameter) was overlaid on each paper disc image; subsequently, the mean gray value (i.e. averaged brightness) in each ROI was measured. The high-concentrated chitosan solution exhibits deep red-purple with low gray values and the low-concentrated chitosan solution exhibits pale red-purple with high gray values.
Preparation of peritrophic membrane of S. litura larvae
Newly molted 5th larvae were fed on soybean leaves (Glycine max (L.) Merr., cv. Enrei), which were grown as previously reported [Citation23]. After 15 h of feeding on soybean leaves, the weight of larvae was measured, and the whole peritrophic membranes were excised via dissection and washed with 0.85% (w/v) KCl. Following the initial wash, the membranes were vortexed in 1 mL of 0.85% (w/v) KCl for 2 min (three times), and then vortexed in 1 mL of distilled water for 2 min (three times). The washed membranes were incubated in 1 mL of 1 M NaOH for 2 h at 100°C to remove protein. Then, the cleaned membranes were gently washed with distilled water, and subsequently incubated in 1 mL of sat. KOH aq. for 2 h at 100°C to deacetylate chitin. The deacetylated membranes were suspended in 1 mL of distilled water and centrifuged (12,000 g, 10 min, 20°C). The supernatants were discarded and the residues were suspended in 1 mL of distilled water and centrifuged (12,000 g, 10 min, 20°C). The resulting residues were dissolved in 30 μL of acetic acid. This solution was used for the quantification of chitosan concentration as described above. Subsequently, the chitin amount (μg) per one larva was estimated by following equation:
A constant of 1.23 is added to take into account the loss of the acetyl group and generated by the ratio of the chitin monomer (N-acetylglucosamine, MW 221.21) and that of chitosan (glucosamine, MW 179.17).
Statistics
All statistical analyses were performed using the Excel statistical software package (Bell Curve for Excel; Social Survey Research Information Co., Ltd., Tokyo, Japan). The calibration curve was constructed using the average values of three measurements in a concentration range of 0.05–5 μg/μL and eight measurements in a concentration range of 0.05–0.5 μg/μL. The limit of detection (LOD) was defined as – 3.29sblank/S, where sblank is the standard deviation of blank samples and S is the slope of the calibration curve [Citation24]. The limit of quantification (LOQ) was defined as the minimum concentration which fulfilled the preestablished relative standard deviation (RSD): <5% RSD in our study. In this definition, LOQ was estimated from a model of the RSD against the concentration of chitosan (i.e. precision profile) [Citation25–Citation27]
Results
Method validation
The gray value of the blank sample (0 μg/μL of chitosan) was 247.5 ± 1.4 (mean ± SD, N = 14). The authentic image of the chitosan–I3− complex on paper discs in a concentration range of 0.05–5 μg/μL of chitosan was shown in . The gray value decreased with increasing the concentration and aligned well with a power function with a regression equation of y = 192x− 0.077 (r2 = 0.991) (Figure S1(a)). Model adequacy was also assessed based on the residual plot (Figure S1(b)); there were no outliers (Smirnov–Grubbs rejection test, P < 0.05) and randomness of residuals (Wald–Wolfowitz runs test, P = 0.681) [Citation28]. The precision profile (Figure S1(c)), however, demonstrated higher RSD in the high concentration range (0.5–5 μg/μL) than the low concentration range (0.05–0.5 μg/μL). Correlation analysis also showed that RSD had a positive correlation with the concentration of chitosan in a range of 0.05–5 μg/μL (Pearson correlation analysis; r = 0.531, P = 0.0194). In addition, the gray value did not change significantly within a range of 0.5–5 μg/μL of chitosan, in other words, the sensitivity was lower due to saturation of the imaging system. Therefore, it was preferred that an accurate quantification of chitosan should be conducted in 0.05–0.5 μg/μL. In this range, the calibration curve showed linearity with a linear regression equation of y = –81.3x + 240 (r2 = 0.946) (). Model adequacy was assessed based on the residual plot (); there were no outliers (Smirnov–Grubbs rejection test, P < 0.05) and randomness of residuals (Wald–Wolfowitz runs test, P = 0.357). LOD was calculated as 1.74 μg. According to a precision profile (), RSD was under 5% in this calibration range. Therefore, LOQ was estimated as the same value with LOD: 1.74 μg.
Figure 1. The authentic images of paper discs colored with a red-purple chitosan–I3− complex. (a) The low concentration range. (b) The high concentration range.
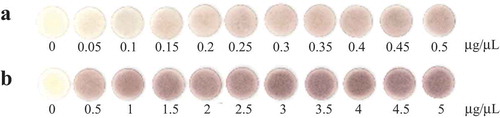
Figure 2. The analysis of chitosan standards in the concentration range of 0.05–0.5 μg/μL. (a) The calibration curve. The regression equation and the coefficient of determination (r2) are also described. (b) The residual plot. (c) The precision profile.
Quantification of the chitin content in peritrophic membrane of S. litura larvae
The image of the chitosan–I3− complex derived from chitin in peritrophic membrane of S. litura larvae was shown in Figure S2. The amount of chitin was 5.34 ± 0.66 μg/larva (mean ± SD, N = 12).
Discussion
In the current study, the amounts of chitin in peritrophic membrane of insects were indirectly measured by use of the insoluble chitosan–I3− complex, which exhibited specific red-purple color. The primary iodine species, I3–, of the stain interact with the hydroxyl groups at C-1, C-3, and C-4 of the glucosamine moiety in chitosan, and thus, generate inner polyiodine chains in the cylindrical assembly of extended chitosan chains [Citation29]. This coloration mechanism is interpreted to be same with the mechanism in amylose–iodine complex which exhibits blue color [Citation30,Citation31]. Nitschke et al. [Citation20] used the chitosan–I3− complex for the quantification of chitin and chitosan in edible mushrooms. Their method, however, required special apparatus and software. In the method presented here, we used a common heat bath, centrifuge, and scanner, as well as free software to establish an easily approachable sample preparation and quantification method of chitin in peritrophic membrane of insects.
A concentration range of 0.05–0.5 μg/μL is preferred because of the higher accuracy and sensitivity potentially due to reaching saturation of the imaging system at higher concentration. A dynamic range at lower concentrations is beneficial as overly concentrated samples can be diluted for accurate measurement more easily than samples with lower concentrations. The LOD and LOQ values are definition dependent, and in many analytical methods (e.g. chromatography), 3sblank/S for LOD and 10sblank/S for LOQ are used as simplified definitions [Citation27].However, these definitions have several problems [Citation24–Citation26]. In the definition of 3sblank/S for LOD, there is a high probability of false negative (type II error) caused by the β value wrongly accepting the absence of analytes [Citation24,Citation26]. β is low, but not absent, in the definition of 3.29sblank/S used in our method, thereby reducing false positives. LOQ should be determined with the required reliability (i.e. RSD value). The definition of 10sblank/S means the LOQ value is 10% RSD, although this definition assumes that the standard deviation in all concentration ranges is constant and equal to sblank. This assumption is not supported in many cases (also see Figure S3). The preferred approach is based on a precision profile, in which RSD values are plotted and examined in the calibration range [Citation25–Citation27]. According to this approach, LOQ was defined as the minimum concentration fulfilling <5% RSD in our method.
The chitin contents in peritrophic membrane of 5th instar larvae of S. litura were estimated to be 5.34 ± 0.66 μg/larva (mean ± SD, N = 12) in our method. This result was comparable with previous studies [Citation32,Citation33], which hydrolyzed chitin by chitinase and measured the N-acetylglucosamine product by a modified Morgan–Elson assay [Citation15]. In the aforementioned study, the total chitin contents in peritrophic membrane and midgut tissues of 5th instar larvae of S. exigua (Lepidoptera: Noctuidae) were estimated to be 0.7–5.7 μg/larva. The peritrophic membrane contains a larger amount of chitin than midgut tissues [Citation34], and therefore our method showed comparable results to the previous method.
In the previous methods [Citation21,Citation32,Citation33], the high specificity for chitin quantification was secured by the specificity of enzymes. In our method, any procedures ensuring the specificity were not conducted. In the quantification of chitin in a peritrophic membrane, however, the proper pretreatment gave an almost pure chitosan solution. To make sure that pretreated samples did not contain protein, cellulose, and xyloglucan, which are major natural compounds colored by Lugol’s solution, this solution was hydrolyzed with trifluoroacetic acid (TFA), and then liberated amino acids and carbohydrates were analyzed (Figures S4 and S5) by liquid chromatography/mass spectrometry (LC/MS) and gas chromatography/mass spectrometry (GC/MS). As a result of those analyses, proteinogenic amino acids and sugars consisting of cellulose and xyloglucan (i.e. glucose, galactose, xylose, arabinose, and fucose [Citation35]) were not detected in the hydrolyzate. This result showed the pretreatment described here was proper for the quantification of chitin in a peritrophic membrane and allowed the reliable quantification, although the protocol of the pretreatment in our method would not be proper for all samples. When some impurities which are colored by Lugol’s solution remain in samples after this pretreatment, the optimization of the pretreatment might be required. When dealing with samples containing a large amount of chitosan, subtracting chitosan amounts in original samples (i.e. before pretreatment) from those in pretreated samples is requisite to calculate the chitin amounts in original samples. Despite of these concern, we think that this method accomplished the quantification of chitin without relatively expensive and inaccessible reagents and apparatuses, such as an ultra-microbalance providing a precise means of measuring weight (as small as 0.1 μg) which enable to weight a very small amount of chitosan purified by the pretreatment and chromatographs equipped with some detectors (ultraviolet detectors, photodiode array detectors, and/or mass spectrometers) which analyze purified chitosan after derivatizing additionally.
Chitin plays important roles in the insect physiology and, much attention is paid to chitin as a potential material [Citation1]. The amount of chitin in interest samples is one of the major concerns. The poor reactivity and processability of chitin have made it difficult to measure the chitin content. In this study, we demonstrated a facile method for the quantification of chitin and chitosan with inexpensive reagents and apparatuses. This method can be easily applied to quantify the amount of chitin and chitosan in materials by wide range of researchers.
Authors’ contribution
Ryu Nakata and Naoki Mori designed the research. R. N. performed the experiments and analyzed data with the aid of Naoko Yoshinaga, Masayoshi Teraishi, and Yutaka Okumoto. M. T. and Y. O. provided plant materials. R. N. wrote the manuscript.
190417_chitin__supplemental_figures__BBB_RN_final.pptx
Download MS Power Point (2.6 MB)Acknowledgments
We thank Dr James Sims of ETH Zurich for English proofreading.
Disclosure statement
No potential conflict of interest was reported by the authors.
Supplementary material
Supplemental data for this article can be accessed here.
Additional information
Funding
References
- Kumar MNVR. A review of chitin and chitosan applications. React Funct Polym. 2000;46:1–27.
- Rinaudo M. Chitin and chitosan: properties and applications. Prog Polym Sci. 2006;31:603–632.
- Devine WP, Lubarsky B, Shaw K, et al. Requirement for chitin biosynthesis in epithelial tube morphogenesis. Proc Natl Acad Sci U S A. 2005;102:17014–17019.
- Moussian B. Recent advances in understanding mechanisms of insect cuticle differentiation. Insect Biochem Mol Biol. 2010;40:363–375.
- Zimoch L, Merzendorfer H. Immunolocalization of chitin synthase in the tobacco hornworm. Cell Tissue Res. 2002;308:287–297.
- Muthukrishnan S, Merzendorfer H, Arakane Y, et al. Chitin metabolism in insects. In: Gilbert LI, editor. Insect molecular biology and biochemistry. Cambridge, Massachusetts: Academic Press; 2012. p. 193–235.
- Harpers MS, Hopkins TL. Peritrophic membrane structure and secretion in European corn borer larvae (Ostrinia nubilalis). Tissue Cell. 1997;29:463–475.
- Peters W, Heitmann S, D’Haese J. Formation and fine structure of peritrophic membranes in the earwig, Forficula auricularia (Dermaptera: forficulidae). Entomol Gen. 1979;5:241–254.
- Hegedus D, Erlandson M, Gillott C, et al. New insights into peritrophic matrix synthesis, architecture, and function. Ann Rev Entmol. 2009;54:285–302.
- Lehane M. Peritrophic matrix structure and function. Ann Rev Entmol. 1997;41:525–550.
- Terra WR. Evolution of digestive systems of insects. Ann Rev Entmol. 1990;35:181–200.
- Hori M, Kakiki K, Suzuki S, et al. Studies on the mode of action of polyoxins. Part III. relation of polyoxin structure to chitin synthetase inhibition. Agric Biol Chem. 1971;35:1280–1291.
- Palli SR, Retnakaran A. Molecular and biochemical aspects of chitin synthesis inhibition. EXS. 1999;87:85–98.
- Wilson TG, Cryan JR. Lufenuron, a chitin-synthesis inhibitor, interrupts development of Drosophila melanogaster. J Exp Zool. 1997;278:37–44.
- Arakane Y, Muthukrishnan S, Kramer KJ, et al. The Tribolium chitin synthase genes TcCHS1 and TcCHS2 are specialized for synthesis of epidermal cuticle and midgut peritrophic matrix. Insect Mol Biol. 2005;14:453–463.
- Zhang J, Zhu KY. Characterization of a chitin synthase cDNA and its increased mRNA level associated with decreased chitin synthesis in Anopheles quadrimaculatus exposed to diflubenzuron. Insect Biochem Mol Biol. 2006;36:712–725.
- Larionova NI, Zubaerova DK, Guranda DT, et al. Colorimetric assay of chitosan in presence of proteins and polyelectrolytes by using o-phthalaldehyde. Carbohydr Polym. 2009;75:724–727.
- Prochazkova S, Vårum KM, Ostgaard K. Quantitative determination of chitosans by ninhydrin. Carbohydr Polym. 1999;38:115–122.
- Ride J. A rapid method for the chemical estimation of filamentous fungi in plant tissue. Physiol Plant Pathol. 1972;2:7–15.
- Nitschke J, Altenbach HJ, Malolepszy T, et al. A new method for the quantification of chitin and chitosan in edible mushrooms. Carbohydr Res. 2011;346:1307–1310.
- Lucero HA, Kuranda MJ, Bulik DA. A non-radioactive, high throuput assay for chitin synthase activity. Anal Biochem. 2002;305:97–105.
- Schindelin J, Arganda-Carreras I, Fris E, et al. Fiji: an open-source platform for biological-image analysis. Nat Methods. 2012;9:676–682.
- Nakata R, Kimura Y, Aoki K, et al. Inducible de novo biosynthesis of isoflavonoids in soybean leaves by Spodoptera litura derived elicitors: tracer techniques aided by highresolution LCMS. J Chem Ecol. 2016;42:1226–1236.
- Currie LA. Nomenclature in evaluation of analytical methods including detection and quantification capabilities1: (IUPAC Recommendations 1995). Anal Chim Acta. 1999;(1999(391):105–126.
- Mermet JM. Limit of quantitation in atomic spectrometry: an unambiguous concept? Spectrochim Acta Part B Atomic Spectrosc. 2008;63:166–182.
- Uemoto M. Fundamental knowledge for reliable analysis―concepts and definitions of the limit of detection and the limit of quantitation. Bunseki. 2010;5:216–221.
- Vial J, Jardy A. Experimental comparison of the different approaches to estimate LOD and LOQ of an HPLC method. Anal Chem. 1999;71:2672–2677.
- Chang Y. Residuals analysis of the generalized linear models for longitudinal data. Stat Med. 2000;19:1277–1293.
- Yajima H, Morita M, Hashimoto M, et al. Complex formation of chitosan with iodine and its structure and spectroscopic properties—molecular assembly and thermal hysteresis behavior. Int J Thermophys. 2001;22:1265–1283.
- Handa T, Yajima H. On the blue color of triiodide ions in starch and starch fractions. I. Characterization and assignment of absorption and circular dichroism spectra of triiodide ions in amylose. Biopolymers. 1979;18:873–886.
- Handa T, Yajima H. Conformation of amylose–iodine–iodide complex in aqueous solution. Biopolymers. 1981;20:2051–2072.
- Chen J, Tang B, Chen H, et al. Different functions of the insect soluble and membrane-bound trehalase genes in chitin biosynthesis revealed by RNA interference. PLoS ONE. 2010;5:e10133.
- Yao Q, Zhang D, Tang B, et al. Identification of 20-hydroxyecdysone late-response genes in the chitin biosynthesis pathway. PLoS ONE. 2010;5:e14058.
- Khajuria C, Buschman LL, Chen MS, et al. A gut-specific chitinase gene essential for regulation of chitin content of peritrophic matrix and growth of Ostrinia nubilalis larvae. Insect Biochem Mol Biol. 2010;40:621–629.
- Fry SC. Xyloglucan: a metabolically dynamic polysaccharide. Trends Glycosci Glycotechnol. 1992;4:279–289.