
ABSTRACT
Protein kinase C (PKC) is a class of phospholipid-dependent serine/threonine kinases that contribute to cell survival, migration, and invasion. Previous studies demonstrated that PKC participates in insulin secretion. However, the role of PKC in glucose-stimulated insulin secretion (GSIS) remains unclear. Herein, we demonstrated that PKC is an important mediator of insulin secretion and revealed a close relationship between PKC activation and insulin secretion in INS-1E cells. Meanwhile, the presence of PKCα was found to induce TRPC1 phosphorylation in INS-1E cells. TRPC1 phosphorylation levels increased by activating PKCα activity. Inhibition of PKCα activity reduced TRPC1 phosphorylation. Finally, we showed that TRPC1 could reverse the decrease in intracellular Ca2+ levels and reduced insulin secretion induced by treatment with PKCα inhibitor under high glucose conditions. In conclusion, our findings indicated that TRPC1 and PKCα are involved in promoting insulin secretion and that PKCα promotes insulin secretion via TRPC1 phosphorylation in INS-1E cells.
Graphical Abstract
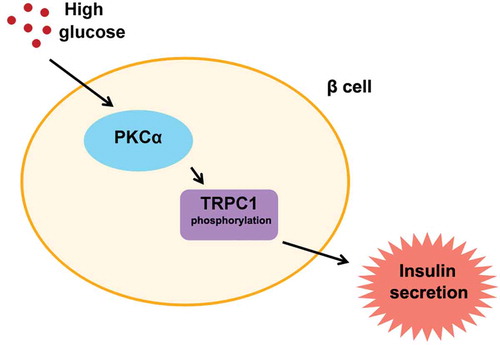
The effect of PKCα is on insulin secretion in pancreatic β-cells. High glucose-enhanced PKCα activation in pancreatic β-cells. And PKCα activation promoted TRPC1 phosphorylation. Meanwhile, insulin secretion increased when the level of TRPC1 phosphorylation enhanced.
Insulin is an essential hypoglycemic hormone for maintaining normal metabolism in the body. Therefore, insulin secretion by pancreatic β-cells plays a crucial role in regulating glucose homeostasis [Citation1]. Higher blood glucose levels promote induced insulin secretion by β-cells. As the major physiological regulator of insulin secretion, glucose metabolism in β-cells induces depolarization of the cell membrane. Furthermore, this depolarization triggers an increase in intracellular Ca2+ concentrations ([Ca2+]i), which in turn promotes insulin secretion. The time of insulin release is divided into two phases, called the “biphasic pattern” [Citation2,Citation3]. Store-operated calcium channels (SOCs) are major components involved in calcium signaling in virtually all cell types. SOCs have been reported to play important roles in β-cells by increasing Ca2+ concentrations in the cytoplasm ([Ca2+]i) [Citation4].
Figure 2. Glucose-induced increase in activity of PKC in INS-1E cells. a. INS-1E cells were treated with different glucose concentrations for 1 h. PKC activity reached a higher level in 20 mM glucose treatment. PKC activity was assayed spectrophoto- metrically at 450 nm by the colorimetric enzyme-linked immunosorbent assay technique. Data from three independent experiments were expressed as the mean ± SEM. Statistical analysis was performed by using one-way ANOVA followed by Dunnett’s multiple comparison. *P < 0.05 and **P < 0.01. b. Treatment INS-1E cells with 20 mM glucose at different time points. PKC activity was assayed spectrophotometrically at 450 nm by the colorimetric enzyme-linked immunosorbent assay technique. Data from three independent experiments were expressed as the mean ± SEM. Statistical analysis was performed by using one-way ANOVA followed by Dunnett’s multiple comparison. *P < 0.05 and ***P < 0.001.
Figure 3. Activation of PKCα induces TRPC1 phosphorylation in INS-1E cells. a,b. Treatment of INS-1E cells with high glucose (20 mM) or PMA (50 nM) increase TRPC1 phosphorylation in INS-1E cells, statistical analysis was performed by using one-way ANOVA followed by Tukey’s test. **P < 0.01 and ***P < 0.001. c, d. INS-1E cells were treated for 30 min with 2 (low glucose), 20 (high glucose) or 2 mM glucose+Gö6976 (0.3 μM) or 20mM glucose + Gö6976 (0.3 μM). Glucose levels, P < 0.01; Gö6976 treatment, P < 0.01; Glucose × Gö6976, P < 0.05. The data are from three independent experiments. Statistical analysis was performed by using two-way ANOVA.
Figure 4. The effect of PKCα and TRPC1 on insulin secretion in INS-1E cells. a, Treatment INS-1E cells with PKCα inhibitor Gö6976 (0.3 μM) and TRPC1 activator, cyclopiazonic acid (CPA) to observe the level of high glucose-induced intracellular Ca2+ by fura-2 AM. INS-1E cells were first treated with 20 mM of glucose for 30 min. Inhibition of PKCα led to a decrease of intracellular Ca2+ and Activation of TRPC1 reversed the decrease in INS-1E cells. Data from three independent experiments were expressed as the mean ± SEM. Statistical analysis was performed by using one-way ANOVA followed by Tukey’s test. **P < 0.01 and ***P < 0.001. b,Treatment INS-1E cells with PKCα inhibitor Gö6976 (0.3 μM) and TRPC1 activator, cyclopiazonic acid (CPA) to observe the level of high glucose-induced insulin secretion by ELISA. Data from three independent experiments were expressed as the mean ± SEM. Statistical analysis was performed by using one-way ANOVA followed by Tukey’s test. *P< 0.05 and **P < 0.01.
The protein kinase C (PKC) family of serine/threonine kinases regulates growth and hypertrophy and act as mediators of signal transduction pathways in a multitude of cells. PKC plays a critical role in various diseases, including heart failure and cancer [Citation5]. Meanwhile, additional studies have demonstrated that the upregulated expression of several PKC isoforms in β-cells and activation of PKC isoforms are closely associated with insulin secretion [Citation6]. However, the specific mechanisms underlying the regulation of insulin secretion by PKC isoforms remain unknown. PKCδ activity is significantly increased during pathological hypertrophy, which induces cardiomyocyte apoptosis. However, PKCα activation promoted cardiac cell proliferation and enhanced myocardial function [Citation7]. PKCδ also regulates neutrophil migration and adhesion by phosphorylating myristoylated alanine-rich C kinase substrate (MARCKS). Inhibition of PKCδ significantly attenuated MARCKS phosphorylation in human neutrophils and thus serves a potential target for anti-inflammatory treatment [Citation8]. In Purkinje cells, PKC eliminates the binding between Ca2+/calmodulin‐dependent protein kinase II (CaMKIIβ) and F-actin by phosphorylating CaMKIIβ, which functions in maintaining normal spinal morphology [Citation9]. Activation of PKC induces the phosphorylation of calcium release-activated calcium channel protein 1 (Orai1), thereby inhibiting Orai1 activity. Considering that Orai1 activity affects SOC activity in immune cells, Orai1 phosphorylation by PKC could play a critical role in immune system [Citation10]. The expression of PKC βII is downregulated in colon cancer tissues. Overexpression of PKC βII was demonstrated to dramatically reduce the cell viability of cancer cells, thereby indicating that PKC βII plays a key role in inhibiting tumors [Citation11].
SOCs play a steady role in supplying Ca2+ to refill endoplasmic reticulum (ER), which increases intracellular Ca2+ concentrations to stimulate insulin secretion in β-cells [Citation12]. The transient receptor potential canonical channel-1 (TRPC1) is a member of canonical transient receptor potential (TRPC) family and is known to be expressed in multiple cell types and plays a critical role in cell proliferation [Citation13,Citation14]. Interestingly, TRPC1 is crucial for the formation of SOCs [Citation15]. TRPC1 was activated by Caveolin‐1 to increase Ca2+ levels, which promoted gastric mucosal repair. A previous study reported that TRPC1 activation also maintains the integrity of intestinal epithelial mucosa [Citation16]. The upregulation of TRPC1 expression promotes Ca2+ entry to maintain calcium homeostasis in the nervous system. Overexpression of TRPC1 protects hippocampal neurons, and TRPC1 can serve as a therapeutic target for the treatment of several brain disorders. Furthermore, mGluR5 activates the TRPC1 channel to promote synaptic transmission, which indicated that TRPC1 channel is involved in the spatial working memory [Citation17]. TRPC1 expression levels are upregulated in the chronic obstructive pulmonary disease (COPD) patients compared to those in normal patients, which indicated that TRPC1 is a determinant protein of COPD treatment. Furthermore, TRPC1 expression is upregulated in colon cancer, leading to the interaction between TRPC1 and stromal interaction molecule 2 (STIM2) by regulating Ca2+ entry [Citation18]. Therefore, TRPC1 could serve as a novel target for colon cancer treatment because it is known to induce the migration of cancer cells [Citation19]. Although TRPC1 has been shown to play a role in different diseases, the detailed mechanisms underlying the effects of TRPC1 in diabetes remain unknown.
In the present study, we investigated the function of PKC and TRPC1 in insulin secretion. Our findings showed that PKC activity and insulin secretion were induced in the high glucose treatment. PKCα regulated TRPC1 phosphorylation levels. Inhibition of PKCα reduced TRPC1 phosphorylation under high glucose conditions. Furthermore, insulin secretion decreased rapidly with addition of PKCα inhibitor. TRPC1 activator reversed the decrease of insulin induced by PKCα inhibitor, Gö6976. The above results suggested that PKCα and TRPC1 are involved in the process of insulin secretion and that PKCα promotes insulin secretion via TRPC1 phosphorylation.
Materials and methods
Materials
Gö6976 and PMA were purchased from Sigma-Aldrich. Fetal bovine serum (FBS), HEPES and anti-IgG and anti-TRPC1 antibodies were purchased from Invitrogen (USA). Anti-Phosphoserine/threonine antibody (ab17464) was from Abcam (Cambridge, MA). Rat insulin ELISA kits (EZRMI-13K) were obtained from Millipore (USA). BCA protein assay kits were purchased from Pierce (USA). PKC kinase activity kits were purchased from Enzo Life Sciences (Switzerland). Cyclopiazonic acid was purchased from YanSheng Biochemical Reagent (Shanghai, China).
Cell culture
The rat insulinoma cell lines (INS-1E) were cultured in a humidified atmosphere (5% CO2/95% air) at 37°C in regular RPMI 1640 medium supplemented with 10% heat-inactivated FBS, 25 mmol·L−1 HEPES, 2 mmol·L−1 L-glutamine, 1 mmol·L−1 sodium pyruvate, 100 μg·mL−1 streptomycin,100 U·mL−1 penicillin and 50 μmol·L−1 β-mercaptoethanol. Standard medium contains 5 mmol·L−1 glucose. We planted INS-1E cells on a 24-well culture plate with a pore density of 1 × 10⁵ cells/well for insulin secretion analysis, and cultured cells on a 6-well culture plate with a pore density of 1 × 10⁶ well for Western blotting. In order to ensure the accuracy of the experiment, we starved the cells before the experiment.
Insulin secretion measurement
Before insulin secretion measurement, cells were maintained in glucose-free RPMI-1640 medium for 2 h. Then, cells were washed twice and preincubated with Krebs-Ringer bicarbonate HEPES buffer (KRBH; 135 mM NaCl, 3.6 mM KCl, 1.5 mM CaCl2, 0.5 mM NaH2PO4, 0.5 mM MgCl2, and 5 mM NaHCO3, 10 mM HEPES and 0.1% bovine serum albumin) containing 5 mM glucose for 30 min at 37°C to maintain stable basic insulin secretion. Subsequently, cells were stimulated with increasing glucose concentrations (from 5 to 30 mM). Then, the supernatants were collected and stored at −80 °C. Insulin secretion was measured every 2 min. The level of insulin accumulated in the medium measured at this time point minus the level of insulin accumulated in the previous 2 min is used as insulin secretion at that time point. Insulin secretion was assayed by the insulin ELISA (Millipore, Billerica, MA, USA). Briefly, the insulin ELISA assay was based on a sandwich type, which used the 96-well microplate coated with an anti-insulin monoclonal antibody. Horseradish peroxidase was combined with the immobilized biotinylated antibody. Then, the enzyme activity was measured spectrophotometrically by the increased absorbency at 450 nm. The concentration of insulin secretion was calculated by the absorptivity of the sample.
PKC activity
PKC activity in INS-1E cells was measured using a PKC kinase activity kit (Enzo Life Sciences, No. ADI-EKS-420A). Briefly, specific synthetic peptides were used as subtypes of PKCs and a polyclonal antibody for recognition of the substrate phosphorylation. PKC activity was measured at a wavelength of 450 nm, and PKC activity was calculated as the relative activity.
Immunoprecipitation and western blotting
Cells were grown into confluency, lysed in lysis buffer (50 mM Tris-HCl, pH 7.4, 150 mM NaCl, 5 mM EDTA, 0.05% Nonidet P-40,1 mM phenylmethanesulfonyl fluoride and a protease inhibitor cocktail). Cell lysates were collected and BCA protein assay was performed to determine the total protein content (Pierce, Rockford, IL, USA). Then, cell lysates precleared by protein A-agarose. After 15 min of centrifugation, 400 μg whole cell protein lysates incubated with anti-TRPC1 antibody overnight at 4°C and constant mixed. Next, Protein-A-Sepharose beads were added to the IP product for 3 h at 4°C followed by washing three times with KLB buffer (137 mM NaCl, 20 mM Tris HCl pH 8.0, 1% NP-40, 10% Glycerol, 2 mM EDTA). Then, we isolated the product for Western blot. We electrophoresed 20 μg each protein lysates on 12% SDS polyacrylamide gel. Then, we transferred these proteins onto PVDF membranes (EMD Millipore). And 0.05% Tween-20 (PBS-Tween) and 5% milk were used for blocking in PBS. We probed the membranes with Phospho-(Ser/Thr) Phe Antibody in 2% milk PBS-Tween at 4°C overnight. Subsequent to a further three times washing with PBS-Tween, the membranes were added to the secondary antibody in 2% milk PBS-Tween for 2 h at room temperature. Immunoreactivity was detected by the enhanced chemiluminescence (ECL) kits (Abcam).
Measurement of intracellular Ca2+
Cells were cultured in 24-well plates on to the medium at a rate of 1.5 × 10⁵ cells/well overnight. Intracellular Ca2+ levels were measured by fura-2 AM. INS-1E cells were loaded with KRBH (2 mM CaCl2, 3 μM Fura2/AM, and 5 mM glucose) and incubated for 40 min at 37°C in the dark. Next, cells were washed and observed under an inverted Zeiss microscope (×40 oil immersion fluorescence objective). Fua-2am was excited by Visichrome Holographic Monochromator at 340/380 nm, and the emission fluorescence was monitored using a Hamamatsu Orca ER coded CCD Camera at 510 nm. Treatment images were analyzed with MetaFluor (Xi’an Jiaotong University) and evaluated the ratio.
Statistical analysis
Data were reported as means±SEM. One-way ANOVA plus Tukey’s (Tukey–Kramer) or Dunnett’s multiple comparison tests and two-way ANOVA were used to analyze the differences among multiple groups. P < 0.05, P < 0.01, and P < 0.001 were considered statistically significant. Statistical analysis was performed by using SPSS22.0.
Result
High glucose promotes the insulin secretion in INS-1E cells
To determine whether high glucose promote upregulation of insulin secretion, INS-1E cells were cultured in different glucose concentrations. Then, insulin secretion was measured in different glucose conditions. As shown in ), we observed a significant difference in insulin secretion among the different glucose treatment groups. The level of insulin secretion was evidently increased following glucose treatment and reached a much higher level at 20 mM glucose treatment. Meanwhile, we evaluated insulin secretion levels in INS-1E cells at different time points. INS-1E cells were treated with 20 mM glucose to stimulate insulin secretion. We found that the insulin secretion was gradually increased until 1 h .
Figure 1. The effect of glucose in insulin-secreting INS-1E cells. a. Insulin secretion was measured in different concentrations of glucose for 30 min. The levels of insulin secretion were detected by ELISA. Data from three independent experiments were expressed as the mean ± SEM. Statistical analysis was performed by using one-way ANOVA followed by Dunnett’s multiple comparison. **P < 0.01 and ***P < 0.001. b. Insulin secretion was measured at different time points of 20 mM glucose treatment in INS-1E cells. Insulin secretion increased significantly in 60-min high glucose treatment and decreased at 120 min. Data from three independent experiments were expressed as the mean ± SEM. Statistical analysis was performed by using one-way ANOVA followed by Dunnett’s multiple comparison. **P < 0.01 and ***P < 0.001.
High glucose promotes the activation of PKC in INS-1E cells
PKC proteins have been reported to play roles in insulin secretion. PKC activation contributes to glucose-stimulated insulin secretion (GSIS). Therefore, we hypothesized that high glucose levels promote PKC activation. To verify the effect of high glucose levels, PKC activation was measured in INS-1E cells subjected to different glucose treatments. Results indicated that high glucose levels led to greater PKC activation . In addition, INS-1E cells were treated with high glucose levels (20 mM) for 2 h. PKC activity increased within 1 h and subsequently decreased .
PKCα activation induces TRPC1 phosphorylation in INS-1E cells
As an important component of SOCs, TRPC1 contributes to insulin secretion. To determine whether PKCα plays a critical role in TRPC1, INS-1E cells were treated with 50 nM PMA and high glucose levels to activate PKCα function. The effect of PKCα on TRPC1 phosphorylation was examined by immunoprecipitation and Western blotting. TRPC1 phosphorylation levels were higher in the PMA group and the high glucose group compared to those in the control group . To further explore the role of PKCα, we measured TRPC1 phosphorylation levels under different treatment conditions. The above results demonstrated that treatment with the PKCα inhibitor Gö6976 partially inhibited TRPC1 phosphorylation in INS-1E cells subjected to high glucose conditions. Notably, Gö6976 treatment altered TRPC1 phosphorylation levels under low glucose conditions .
PKC and TRPC1 promote insulin secretion in INS-1E cells
Although our results revealed that PKCα-induced TRPC1 phosphorylation in INS-1E cells, the involvement of the PKCα signaling pathway in Ca2+ entry and insulin secretion remains unknown. Intracellular Ca2+ levels were significantly higher under high glucose conditions (20 mM). The intracellular Ca2+ levels were rapidly reduced when PKCα was inhibited under the high glucose condition (20 mM). Treatment with the TRPC1 activator cyclopiazonic acid increased intracellular Ca2+ levels when INS-1E cells were treated with Gö6976 . Meanwhile, insulin secretion was evidently increased in the high glucose treatment. TRPC1 activator reversed the Gö6976-induced decrease in insulin secretion under the high glucose condition .
Discussion
Type 2 diabetes is characterized by defects in insulin secretion in pancreatic β-cells. Insulin is an essential hormone involved in normal metabolism. Β-cells maintain blood glucose concentrations by secreting insulin. Therefore, insulin secretion plays a key role in maintaining glucose homeostasis [Citation20,Citation21]. Previous studies indicated that insulin secretion primarily relies on Ca2+ homeostasis through store-operated Ca2+ channels (SOCs) [Citation22,Citation23]. However, the specific mechanisms regulating insulin secretion remain unclear. In the current study, we verified the critical role of PKC in insulin secretion in INS-1E cells. Our results revealed that high glucose levels promoted insulin secretion and PKC activity, which indicated that PKC activity is associated with insulin secretion. Activation of PKCα was found to increase TRPC1 phosphorylation levels. Moreover, PKCα and TRPC1 were involved in promoting insulin secretion in INS-1E cells. Our findings showed that PKCα and TRPC1 play important roles in insulin secretion. Meanwhile, PKCα can enhance insulin secretion by regulating TRPC1 phosphorylation.
Protein kinase-C (PKC) is a class of phospholipid-dependent serine/threonine kinase that regulate many cellular processes by participating in phosphoinositol signaling pathways [Citation24]. Previous studies have shown that as an oncogenic kinase, PKCϵ activated in human prostate cancer cells compared with normal cells. Moreover, inhibition of PKCϵ impaired the invasive capacity of cancer cells which may be an effective target to prostate cancer therapy [Citation25]. Activation of PKCϵ also promoted an increase of β-catenin expression and contributed to improve glomerular filtration barrier. More evidences demonstrated that PKCϵ was a critical regulator of kidney disease [Citation26]. In our study, we found that the level of insulin secretion in INS-1E cells were significant differences in different glucose concentrations. The level of insulin secretion reached a much higher level at the 20 mM glucose treatment. Meanwhile, INS-1E cells treated with 20 mM glucose for 2 h to explore the level of insulin secretion in different time point. Then, we further explored the effect of different glucose treatment on PKC activity, and 20 mM glucose treatment was sufficient to promote PKC activity. In addition, the PKC activity in high glucose was measured to verify whether glucose-induced PKC activity increased in a time-dependent manner. PKC activity increased rapidly in the first hour, and then PKC activity gradually decreased for 2 h. Together, these results indicated that PKC activity paralleled closely with insulin secretion in INS-1E cells.
TRPC1 as a member of TRPC channel subfamily and is a key protein involved in SOC formation. TRPC1 contributes to the activation of SOCs and regulates various cellular functions. Meanwhile, TRPC1 activity was regulated by different mechanisms for various diseases therapy. Previous studies demonstrated that TRPC1 is activated by mGluR5, which is involved in synaptic plasticity and spatial working memory. Inhibition of TRPC1 impaired the spatial working memory in the hippocampus [Citation17]. TRPC1 plays an important role in ELF-EMF-induced neuronal differentiation and neurite outgrowth. Exposure to extremely low-frequency electromagnetic fields (ELF-EMF) upregulated TRPC1 expression to promote Ca2+ influx, leading to neuronal differentiation and neurite outgrowth of embryonic neural stem cells (eNSCs) [Citation27]; however, the precise mechanisms underlying the observed TRPC1 induction remain unknown. In the present study, we speculated that TRPC1 can also be regulated by PKCα. The results revealed that TRPC1 phosphorylation levels were higher in INS-1E cells treated with PMA 50 nM and high glucose to activate PKCα function. Furthermore, TRPC1 phosphorylation levels were measured under high and low glucose conditions, with or without treatment with inhibitors. Results showed that TRPC1 phosphorylation was enhanced under high glucose conditions, and treatment with the PKCα inhibitor Gö6976 reduced TRPC1 phosphorylation in INS-1E cells. In addition, the TRPC1 phosphorylation levels were reduced under the low glucose condition and that treatment with Gö6976 altered TRPC1 phosphorylation levels.
TRPC1 regulates various mechanisms that in turn control different diseases. In vascular smooth muscle cells, TRPC1 channel activity may involve in vascular tone by regulating Ca2+ entry to create a new activation pathway based on TRPC1 [Citation28]. Meanwhile, TRPC1 overexpression was found to be closely associated with M1 inflammatory mediators; therefore, TRPC1 could serve as a direct target for the treatment of inflammatory diseases in macrophages [Citation29]. TRPC1 expression is a determining factor in multiple myeloma therapy. Inhibition of TRPC1 expression partially inhibited cell death in multiple myeloma cells, whereas upregulation of TRPC1 expression promoted cells death [Citation30]. TRPC1 is a critical regulator of adiposity via autophagy and apoptosis. All these studies demonstrate that TRPC1 is involved in different diseases. Therefore, we speculated that PKCα and TRPC1 are involved in increasing intracellular Ca2+ levels and insulin secretion. Results showed that the intracellular Ca2+ levels and insulin secretion were rapidly reduced when PKCα was inhibited. TRPC1 restored intracellular Ca2+ levels and the reduction in insulin secretion induced by treatment with a PKCα inhibitor. Based on the above findings, PKCα promotes insulin secretion via TRPC1 phosphorylation. However, further studies are required to verify the specific regulatory mechanisms.
In summary, we demonstrated that high glucose concentrations promote insulin secretion and PKC activity in INS-1E cells. We observed that PKC activity was closely associated with insulin secretion in INS-1E cells. Furthermore, TRPC1 phosphorylation levels were reduced upon treatment with a PKC inhibitor under high or low glucose conditions, thereby indicating that TRPC1 phosphorylation is regulated by PKCα activation. Moreover, our findings showed that the inhibition of PKCα activity induced a decrease in the glucose-mediated stimulation of insulin secretion. In addition, TRPC1 reversed the decrease in insulin secretion induced by PKCα inhibitor under the high glucose treatment. Therefore, our results provided strong evidence that PKCα and TRPC1 are involved in insulin secretion. Our findings suggested that PKCα promoted insulin secretion via TRPC1 phosphorylation and that TRPC1 could serve as a new target for T2D therapy.
Author Contributions
All authors contributed to this work. Conceptualization: Bingyin Shi. Methodology: Jing Xu, Wei Zhang, and Wei Cui. Validation:Jing Xu, Wei Zhang, Wei Cui, Huifang Wang. Formal Analysis:Bingyin Shi, and Jing Xu. Investigation: Jing Xu, Wei Zhang. Resources: Jing Xu, Wei Zhang, Wei Cui, and Huifang Wang. Data Curation: Bingyin Shi. Writing-Original draft: Jing Xu, and Wei Zhang. Writing-Review and editing: Bingyin Shi; Visualization: Jing Xu, and Wei Zhang. Supervision: Bingyin Shi. Project Administration: Bingyin Shi. Funding acquisition: Jing Xu and Bingyin Shi.
Disclosure statement
No potential conflict of interest was reported by the authors.
Additional information
Funding
References
- Rorsman P, Ashcroft FM. Pancreatic beta-cell electrical activity and insulin secretion: of mice and men. Physiol Rev. 2018;98(1):117–214.
- Houtz J, Borden P, Ceasrine A, et al. Neurotrophin signaling is required for glucose-induced insulin secretion. Dev Cell. 2016;39(3):329–345.
- Salunkhe VA, Elvstam O, Eliasson L, et al. Rosuvastatin treatment affects both basal and glucose-induced insulin secretion in INS-1 832/13 cells. PLoS One. 2016;11(3):e0151592.
- Ca L, Rf K, Ha N, et al. Stromal interaction molecule 1 (STIM1) regulates ATP-sensitive Potassium (KATP) and Store-operated Ca(2+) channels in MIN6 beta-Cells. J Biol Chem. 2017;292(6):2266–2277.
- Mochly-Rosen D, Das K, Grimes KV. Protein kinase C, an elusive therapeutic target? Nat Rev Drug Discov. 2012;11(12):937–957.
- Trexler AJ, Taraska JW. Regulation of insulin exocytosis by calcium-dependent protein kinase C in beta cells. Cell Calcium. 2017;67:1–10.
- Naskar S, Datta K, Mitra A, et al. Differential and conditional activation of PKC-isoforms dictates cardiac adaptation during physiological to pathological hypertrophy. PLoS One. 2014;9(8):e104711.
- Sheats MK, Sung EJ, Adler KB, et al. In vitro neutrophil migration requires protein kinase C-Delta (delta-PKC)-mediated myristoylated alanine-rich C-Kinase substrate (MARCKS) phosphorylation. Inflammation. 2015;38(3):1126–1141.
- Sugawara T, Hisatsune C, Miyamoto H, et al. Regulation of spinogenesis in mature Purkinje cells via mGluR/PKC-mediated phosphorylation of CaMKIIbeta. Proc Natl Acad Sci U S A. 2017;114(26):E5256–E5265.
- Kawasaki T, Ueyama T, Lange I, et al. Protein kinase C-induced phosphorylation of Orai1 regulates the intracellular Ca2+ level via the store-operated Ca2+ channel. J Biol Chem. 2010;285(33):25720–25730.
- Dowling CM, Phelan J, Callender JA, et al. Protein kinase C beta II suppresses colorectal cancer by regulating IGF-1 mediated cell survival. Oncotarget. 2016;7(15):20919–20933.
- Wang R, McGrath BC, Kopp RF, et al. Insulin secretion and Ca2+ dynamics in beta-cells are regulated by PERK (EIF2AK3) in concert with calcineurin. J Biol Chem. 2013;288(47):33824–33836.
- Kuang CY, Yu Y, Wang K, et al. Knockdown of transient receptor potential canonical-1 reduces the proliferation and migration of endothelial progenitor cells. Stem Cells Dev. 2012;21(3):487–496.
- Asghar MY, Magnusson M, Kemppainen K, et al. Transient receptor potential canonical 1 (TRPC1) Channels as Regulators of Sphingolipid and VEGF receptor expression: implications for thyroid cancer cell migration and proliferation. J Biol Chem. 2015;290(26):16116–16131.
- Sabourin J, Le Gal L, Saurwein L, et al. Store-operated Ca2+ Entry mediated by orai1 and trpc1 participates to insulin secretion in rat beta-cells. J Biol Chem. 2015;290(51):30530–30539.
- Rathor N, Chung HK, Wang SR, et al. Caveolin-1 enhances rapid mucosal restitution by activating TRPC1-mediated Ca2+ signaling. Physiol Rep. 2014;2:11.
- Lepannetier S, Gualdani R, Tempesta S, et al. Activation of TRPC1 channel by metabotropic glutamate receptor mGluR5 modulates synaptic plasticity and spatial working memory. Front Cell Neurosci. 2018;12:318.
- Xu F, Liu XC, Li L, et al. Effects of TRPC1 on epithelial mesenchymal transition in human airway in chronic obstructive pulmonary disease. Medicine (Baltimore). 2017;96(43):e8166.
- Sobradillo D, Hernandez-Morales M, Ubierna D, et al. A reciprocal shift in transient receptor potential channel 1 (TRPC1) and stromal interaction molecule 2 (STIM2) contributes to Ca2+ remodeling and cancer hallmarks in colorectal carcinoma cells. J Biol Chem. 2014;289(42):28765–28782.
- Seino S, Shibasaki T, Minami K. Dynamics of insulin secretion and the clinical implications for obesity and diabetes. J Clin Invest. 2011;121(6):2118–2125.
- Fu Z, Gilbert ER, Liu D. Regulation of insulin synthesis and secretion and pancreatic Beta-cell dysfunction in diabetes. Curr Diabetes Rev. 2013;9(1):25–53.
- Gilon P, Henquin JC. Mechanisms and physiological significance of the cholinergic control of pancreatic beta-cell function. Endocr Rev. 2001;22(5):565–604.
- Liu YJ, Gylfe E. Store-operated Ca2+ entry in insulin-releasing pancreatic beta-cells. Cell Calcium. 1997;22(4):277–286.
- Lahn M, Paterson BM, Sundell K, et al. The role of protein kinase C-alpha (PKC-alpha) in malignancies of the gastrointestinal tract. Eur J Cancer. 2004;40(1):10–20.
- Garg R, Blando J, Perez CJ, et al. Activation of nuclear factor kappaB (NF-kappaB) in prostate cancer is mediated by protein kinase C epsilon (PKCepsilon). J Biol Chem. 2012;287(44):37570–37582.
- Duong M, Yu X, Teng B, et al. Protein kinase C stabilizes beta-catenin and regulates its subcellular localization in podocytes. J Biol Chem. 2017;292(29):12100–12110.
- Ma Q, Chen C, Deng P, et al. Extremely low-frequency electromagnetic fields promote in vitro neuronal differentiation and neurite outgrowth of embryonic neural stem cells via up-regulating TRPC1. PLoS One. 2016;11(3):e0150923.
- Shi J, Miralles F, Birnbaumer L, et al. Store-operated interactions between plasmalemmal STIM1 and TRPC1 proteins stimulate PLCbeta1 to induce TRPC1 channel activation in vascular smooth muscle cells. J Physiol. 2017;595(4):1039–1058.
- Chauhan A, Sun Y, Sukumaran P, et al. M1 macrophage polarization is dependent on TRPC1-mediated calcium entry. iScience. 2018;8:85–102.
- Emmons MF, Anreddy N, Cuevas J, et al. MTI-101 treatment inducing activation of Stim1 and TRPC1 expression is a determinant of response in multiple myeloma. Sci Rep. 2017;7(1):2685.