
ABSTRACT
Previous studies including ours have shown that a low-protein diet up-regulates insulin signaling in the liver and muscle and induces fatty liver in rats. Adiponectin is known as an insulin-sensitizing adipocytokine. We, therefore, examined the effect of a low-protein diet on the adiponectin levels in rats. The low-protein diet significantly increased serum adiponectin level. However, mRNA and protein levels of adiponectin in white adipose tissue (WAT) were not changed by the low-protein diet. Since it is known that oligomerization is important to control serum adiponectin level, we examined the population of adiponectin oligomeric forms in WAT and found that low-protein diet did not change it. Despite these events, the amount of its secretion was significantly increased in the adipocytes isolated from WAT of low-protein diet-fed rats. These results indicate that a low-protein diet enhances adiponectin secretion, which is not due to the increased intracellular amount and oligomerization of adiponectin.
Graphical abstract
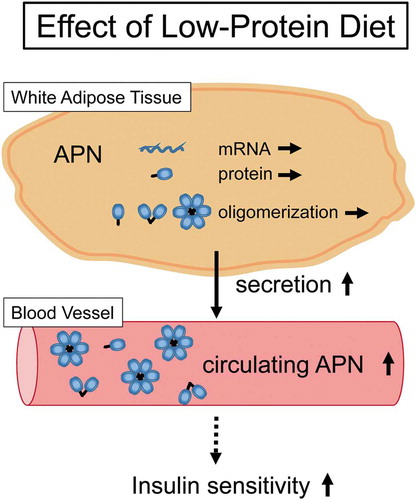
Low-protein diet enhance adiponectin secretion, which is not due to the increased intracellular amount and oligomerization of adiponectin. These events could contribute to the enhancement of insulin sensitivity induced by a low-protein diet.
Low-protein diets are known to reduce insulin secretion in animal models [Citation1–Citation3], but the blood glucose level in animals fed a low-protein diet remains normal, suggesting that the insulin sensitivity of target organs is enhanced by a low-protein diet. Consistent with those findings, several research groups including ours have shown that upregulates insulin signaling in the liver and skeletal muscle [Citation2,Citation4]. However, little is known about the changes of insulin-sensitizing hormones and cytokines under protein deprivation.
Adiponectin (APN) is an adipocyte-derived hormone that has the effect of enhancing insulin sensitivity by regulating glucose and lipid metabolism [Citation5,Citation6]. In the circulation, APN exists as three main forms; a low-molecular-weight (LMW) trimer, a middle-molecular-weight (MMW) hexamer, and a high-molecular-weight (HMW) multimer [Citation7]. The serum APN level is negatively correlated with both adiposity and insulin resistance. Of the three major forms of APN in the blood, HMW APN has been considered the most active form to enhance insulin sensitivity [Citation8]. An understanding of the mechanisms that underlie the increases in serum total and HMW APN levels could thus contribute to therapeutic strategies for insulin resistance.
Several pharmacological treatments and dietary factors have been reported to increase the circulating APN level [Citation9,Citation10]. Thiazolidinediones (TZDs), which are synthetic peroxisome proliferator-activated receptor (PPAR)-γ agonists, have been well studied and reported to increase total APN and the ratio of HMW to total APN in vivo and in vitro [Citation11,Citation12]. The stimulatory effect of TZDs on APN could occur not only at the transcriptional levels but at the post-translational levels [Citation13]. The activation of PPARγ by TZDs has been shown to enhance APN oligomerization and secretion by regulating the expression level of endoplasmic reticulum (ER) chaperones including endoplasmic reticulum resident protein 44 (ERp44), endoplasmic reticulum oxidoreductase (Ero)1-Lα, and disulfide-bond A oxidoreductase-like protein (Dsb-AL) [Citation13].
We conducted the present study to evaluate the effects of a low-protein diet on adiponectin in growing rats. We found that the low-protein diet increased the circulating APN level and enhanced insulin sensitivity in the rats. We then analyzed the expression level of APN and factors known to regulate APN oligomerization in white adipose tissue (WAT), and the amount of APN secretion using adipocytes isolated from WAT of low-protein diet-fed rats.
Materials and methods
Animals
Five-week-old male Wistar rats were purchased from Charles River Japan (Kanagawa, Japan). The rats were caged individually and kept in a room maintained at 22 ± 2°C with relative humidity at 50–60% and a 12-h light (0800–2000 h) and 12-h darkness (2000–0800 h) cycle. They were allowed free access to water throughout the experiment. All rats were trained to feed a 15% casein diet (15C) as a control diet ad libitum for 5 days, after which they were divided into two groups.
For the next 14 days (day 1 to day 14), one group was fed 15C, and the other group was fed a 5% casein diet (5C) as a low-protein diet. The 15C and 5C diets were isocaloric by equally varying casein and β-corn starch and prepared by our laboratory. These compositions are shown in . Since the 5C-fed rats consumed more food than the 15C-fed rats under the ad libitum-feeding condition, all experiments were performed under a pair-feeding condition. Each day, the amount of food consumed by each rat in the 15C group was determined, and the mean of those amounts was given to the 5C rats on the next day.
Table 1. The composition of the experimental diets.
On day 15, after a 4–5-h fast, all rats were anesthetized with isoflurane, and we collected blood from the carotid artery and epididymal white adipose tissues (epiWAT). The blood was allowed to clot for 2 h at room temperature and was subjected to centrifugation at 2,700 × g for 10 min at 4°C. Serum samples were stored at −80°C until analysis. The excised epiWAT was frozen immediately in liquid nitrogen and stored at −80°C until use. All experimental procedures were in accordance with the guidelines of the Animal Usage Committee of Nippon Medical School and verified by the ethics committee.
Insulin tolerance test
On day 12, all of the rats were fasted for 4–5 h and then intraperitoneally injected with bovine insulin (0.5 U/kg body weight; Sigma, St. Louis, MO). Blood was obtained from the tail vein at 0, 30, 60, 90, and 120 min after the injection. The blood glucose level was measured using an Ascensia Breeze 2 glucometer (Bayer Medical, Tokyo). The area above the curve for the changes in blood glucose level was calculated using the trapezoidal rule.
Measurements of triglyceride level in the liver
Hepatic triglyceride (TG) level was measured as described [Citation2]. Briefly, the frozen liver was homogenized with a polytron homogenizer in phosphate-buffered saline, and the tissue lipid was extracted by adding isopropanol into the liver homogenate. The TG levels were measured using a Triglyceride E-Test Wako kit (FUJIFILM Wako Pure Chemical Corporation, Osaka, Japan).
Measurements of serum APN level
The rats’ serum APN levels were measured by a rat/mouse adiponectin enzyme-linked immunosorbent assay (ELISA) kit (Otsuka Pharmaceutical, Tokyo).
Preparation of protein extract from epiwat and isolated adipocyte
The frozen epiWAT were homogenized with a polytron homogenizer in an ice-cold homogenizing buffer (50 mM HEPES-NaOH; pH 7.6, 10 mM sodium orthovanadate, 10 mM sodium pyrophosphate, 100 mM sodium fluoride, 2 mM phenylmethylsulfonyl fluoride, 100 KIU/mL aprotinin, 2 mM EDTA, and 2% Triton X-100). The homogenates were centrifuged at 100,000 × g for 1 h at 4°C, and the supernatants were collected as protein extracts.
The protein extracts from the isolated adipocytes were prepared in ice-cold lysis buffer (10 mM Tris-HCl; pH 7.4, 150 mM NaCl, 1 mM EDTA, 1% Triton-X, 100 mM sodium fluoride, 10 mM sodium orthovanadate, 10 mM sodium pyrophosphate, 20 μg/mL phenylmethylsulfonyl fluoride, 100 KIU/mL aprotinin, 5 μg/mL pepstatin, and 10 μg/mL leupeptin). The cell lysates were centrifuged at 12,000 × g for 30 min at 4°C, and the supernatants were collected for further analysis.
The protein concentration was determined with a Bio-Rad Protein Assay Kit (Bio-Rad, Hercules, CA).
Immunoblotting
An equal amount of protein sample was subjected to sodium dodecyl sulfate-polyacrylamide gel electrophoresis (SDS-PAGE) under reducing condition. Immunoblotting was then performed as described [Citation4]. The antibodies used in this study were anti-adiponectin (AF1119, 1:1000 dilution, R&D Systems, Minneapolis, MN), anti-PPARγ (H-100, 1:200 dilution, Santa Cruz Biochemistry, Dallas, TX), anti-ERp44 (D17A6, 1:1000 dilution, Cell Signaling Technology, Danvers, MA), anti-DsbA-L (100–401-D29, 1:2000 dilution, Rockland Immunochemicals, Limerick, PA), anti-Ero1-L (ab172954, 1:10,000 dilution, Abcam plc, Cambridge, UK), and anti-Actin (clone AC40, 1:5000 dilution, Sigma-Aldrich, St. Louis, MO) antibodies. The bands of immunoreactive proteins were detected with an ECL kit (PerkinElmer Life Sciences, Boston, MA) and quantified using a cooled CCD camera system, the LAS-3000 mini (FujiFilm, Kanagawa, Japan).
Analysis of oligomeric species of APN in rat serum, protein extracts from epiwat and culture medium of primary adipocyte
A 0.7-µL aliquot of serum, 7.5 μg of protein extract from epiWAT, or 10-µL aliquot of culture medium was diluted in non-reducing sample buffer (200 mM Tris-HCl, pH 6.8, 8% SDS, 0.04% bromophenol blue, and 40% glycerol) and incubated at room temperature for 1 h [Citation7]. Each sample was then subjected to SDS-PAGE (4–20%, Mini-Protean TGX precast gel, Bio-Rad) under non-reducing and non-heat denaturing conditions. Immunoblotting with an anti-adiponectin antibody was then performed.
Real-time polymerase chain reaction (PCR)
Total RNA was prepared from the epiWAT according to the manufacturer’s protocol for TRIzol reagent (Invitrogen, Carlsbad, CA). The obtained total RNA was cleaned up with an RNeasy MinElute Cleanup Kit (Qiagen, Valencia, CA) and treated with RNase-free DNase I. The cDNA was synthesized from each RNA sample, and a real-time PCR analysis was performed as described [Citation2]. The primer sequences used were as follows: 5ʹ-GAGAGAAGGGAGACGCAGGT-3ʹ and 5ʹ- GAACATTGGGGACAGTGACG-3ʹ for Adipoq (NM_144744), and 5ʹ-TCCCAGTAAGTGCGGGTCATA-3ʹ and 5ʹ-CGAGGGCCTCACTAAACCATC-3ʹ for Rn18S.
Measurement of APN secretion from the adipocytes isolated from rat epiwat
On day 15, the isolated adipocytes were prepared by digesting the minced epiWAT of either 15C or 5C-fed rats at 37°C for 60 min in Krebs-Ringer bicarbonate HEPES (KRBH) buffer (120 mM NaCl, 4.75 mM KCl, 1.2 mM KH2O4, 1.2 mM MgSO4, 1.27 mM CaCl2, 24 mM NaHCO3, and 30 mM HEPES-NaOH; pH7.4), containing 2 mg/mL collagenase, 1% bovine serum albumin (BSA) (Fraction V), and 200 mM adenosine.
The isolated adipocytes (3 × 10⁵ cells) were then incubated at 37°C in KRBH buffer containing 1% BSA (Fraction V) and 200 mM adenosine. Four h later, the cells were removed, and the concentrations of APN in the culture medium were determined with a rat/mouse adiponectin ELISA kit. The secreted APN level was normalized by cell number.
In order to analyze oligomeric species of APN in culture medium and cellular APN levels, the isolated adipocytes (6 × 10⁶ cells) were incubated for 4 h as described. The adipocytes and culture medium were then collected separately and analyzed by immunoblotting.
Statistical analysis
All values are given as means ± standard error of mean (SEM). The data presented in were analyzed by a two-way analysis of variance (ANOVA) followed by Bonferroni’s test. The other results were analyzed using the unpaired Student’s t-test. Differences were considered significant at p< 0.05.
Figure 1. Effects of a low-protein diet on insulin sensitivity and circulating adiponectin (APN) in growing rats.
Rats were fed either a 15% casein diet (15C) ad libitum for 14 days or a 5% casein diet (5C) that was pair-fed with the 15C group for 14 days. a, b: The result of insulin tolerance test (ITT). a: Change of blood glucose levels during the ITT. b: The area above the curve (AAC) from the ITT. Values are mean ± SEM (15C group; n = 9, 5C group; n = 10). *p< 0.05 vs. 15C-fed rats. c: Serum APN level. d, e: The APN oligomeric complexes in serum. d: A representative immunoblot. e: Quantification of immunoreactivity of high-molecular weight (HMW) form of APN per total APN. The results of densitometric scanning are expressed as arbitrary units. Values are mean ± SEM (15C group; n = 9, 5C group; n = 10). *p< 0.05 vs. 15C-fed rats
Results
The low-protein diet enhanced insulin sensitivity and increased the circulating APN level in growing rats
To examine whether insulin sensitivity is enhanced by a low-protein diet, we performed an insulin tolerance test (ITT) in 15C and 5C-fed rats. At the time that the ITT was conducted, the body weight was significantly lower in the 5C-fed rats (248 ± 2 g) compared to the 15C-fed rats (299 ± 4 g). The fasting blood glucose levels were similar in the 15C and 5C groups (, 0 min). After the intraperitoneal insulin injection, the blood glucose levels were significantly lower in the 5C group compared to the 15C group throughout the observation period. The calculated value of the area above the curve (AAC) was significantly higher in the 5C group than the 15C group (), indicating that insulin sensitivity was enhanced in the 5C-fed rats compared to the 15C-fed rats.
On the last day of the experiment, the body, liver and gastrocnemius weights were significantly lower and the body length was significantly shorter in the 5C-fed rats compared to the 15C-fed rats (). Despite the reduced body weight (BW) gain in the 5C-fed rats, the epiWAT weight was not significantly different between the 15C and 5C-fed rats (). Hepatic TG level was significantly increased in the 5C-fed rats compared to the 15C-fed rats as previously reported [Citation2] (). With the enhanced insulin sensitivity, the 5C-fed rats had higher serum APN levels compared to those of the 15C-fed rats (). We analyzed the APN oligomeric complexes in serum using non-reducing and non-heating SDS-PAGE. The ratio of the HMW form to total APN was significantly higher in the 5C-fed rats than in the 15C-fed rats ().
Table 2. The effects of the low-protein diet on body weight, body length, tissue weight, and hepatic triglyceride level.
The low-protein diet did not change the APN mRNA or protein levels in rat epiwat
To determine whether an increased circulating APN level is associated with increased APN level in adipose tissues, we analyzed the APN mRNA and protein levels in epiWAT. The results demonstrated that the APN mRNA () and protein () levels were not significantly different between the 15C and 5 groups. In addition, the pattern of APN oligomeric complexes and the ratio of HMW to total APN in epiWAT was similar in the two groups ().
Figure 2. Effects of the low-protein diet on APN mRNA and protein levels in rat epididymal white adipose tissue (epiWAT).
Rats were treated for 14 days as described in legend. a: APN mRNA (Adipoq) level. b, c: APN protein level. b: A representative immunoblot. c: Quantification of the immunoreactivity of APN. The actin level was used as an internal control. The results are expressed as arbitrary units. Values are mean ± SEM (15C; n = 9, 5C; n = 10). *p< 0.05 vs. 15C group. d, e: The APN oligomeric complexes in epiWAT. d: A representative immunoblot. e: Quantification of immunoreactivity of HMW form of APN per total APN. The results are expressed as arbitrary units. Values are mean ± SEM (15C group; n = 9, 5C group; n = 10).
The low-protein diet decreased the DsbA-L and erp44 protein levels in rat epiwat
It is recognized that ER chaperones including ERp44, DsbA-L, and Ero1-Lα, play a role in regulating oligomerization and secretion of APN in 3T3-L1 adipocytes [Citation13–Citation16]. Furthermore, the activation of PPARγ by TZDs has been shown to increase APN level by reducing ERp44 and by increasing DsbA-L and Ero1-Lα [Citation13–Citation17]. Here we analyzed the protein level of PPARγ, ERp44, DsbA-L, and Ero1-L in epiWAT of 15C and 5C-fed rats. The 5C intake did not change PPARγ and Ero1-L protein levels (), and significantly reduced ERp44 and DsbA-L protein level in epiWAT ().
Figure 3. Effect of a low-protein diet on the protein levels of PPARγ and ER chaperones in rat epiWAT.
Rats were treated for 14 days as described in legend. a: Representative immunoblots of PPARγ and ER chaperones (ERp44, DsbA-L, and Ero1-L). b–e: Quantification of the immunoreactivity of PPARγ (b), ERp44 (c), DsbA-L (d), and Ero1-L (e). The actin level was used as an internal control. The results are expressed as arbitrary units. Values are mean ± SEM (15C; n = 9, 5C; n = 10). *p< 0.05 vs. 15C group.
The low-protein diet enhanced APN secretion from the isolated adipocyte of rat epiwat
We measured the amount of APN in culture medium secreted from the adipocytes isolated from the epiWAT of both 15C and 5C-fed rats. The secreted APN level for 4 h was significantly higher in the adipocytes isolated from 5C-fed rats compared to that of the 15C-fed rats (). The APN oligomeric complexes in the medium were analyzed, and the ratio of the HMW form to total APN was similar in the adipocytes isolated from the 15C-fed and the 5C-fed rats (). The cellular APN level after 4 h-culture was also similar in the adipocytes isolated from the 15C-fed and the 5C-fed rats ().
Figure 4. Effect of the low-protein diet on APN secretion from the isolated adipocytes of rat epiWAT.
Rats were treated for 14 days as described in legend. The adipocytes were isolated from the epiWAT of both groups and incubated for 4 h. a: The amount of APN secreted into the culture medium from isolated adipocytes. Values are mean ± SEM of six rats in each group. *p< 0.05 vs. 15C-fed rats. b, c: The APN oligomeric complexes in medium of isolated adipocytes. b: A representative immunoblot. c: Quantification of immunoreactivity of HMW form of APN per total APN. The results are expressed as arbitrary units. Values are mean ± SEM (15C; n = 5, 5C; n = 6). d, e: The APN level in isolated adipocytes. d: A representative immunoblot. e: Quantification of the immunoreactivity of APN. The actin level was used as an internal control. The results are expressed as arbitrary units. Values are mean ± SEM (15C; n = 5, 5C; n = 6).
Discussion
The results of our present investigation demonstrated that in rats, the low-protein diet enhanced insulin sensitivity and increased the circulating total APN with a higher ratio of HMW to total APN. However, the mRNA and protein levels of APN in epiWAT were not changed by the low-protein diet. The low-protein diet also did not affect the population of APN oligomeric species in epiWAT. Although there were no changes in the intracellular APN expression and oligomerization, the low-protein diet increased the amount of APN secreted into the culture medium of isolated adipocytes of epiWAT. These results suggest that the low-protein diet enhanced APN secretion without changing its intracellular expression and oligomerization in WAT.
APN is produced primarily by adipose tissue, but the serum APN level is low in obese human and animal models. The level of circulating APN is known to be inversely correlated with abdominal fat accumulation [Citation5,Citation6]. In the present study, we observed that in the low-protein diet-fed rats, the body weight gain was attenuated, and the body length was shorter compared to the control diet-fed rats, whereas the epiWAT weight was not significantly different between the two groups. Thus, it is not likely that the low-protein diet increased the rats’ serum APN levels because of reduced fat accumulation. Moreover, the size of adipocyte is considered as an important factor for the regulation of circulating APN level. The activation of PPARγ reduced the average size of adipocytes in WAT, resulting in the improvement of insulin resistance and the increase in serum APN level in mice [Citation12,Citation18]. The APN production was suppressed in hypertrophied 3T3-L1 adipocytes compared to non-hypertrophied 3T3-L1 adipocytes [Citation19]. There is a report showing that the number of small adipocytes was increased without the changes in WAT mass [Citation20]. It could be considered that the low-protein diet increases the number of small adipocytes, leading to the increase in circulating APN level.
The low-protein diet increased the serum APN level, but it did not change the APN mRNA or protein levels in epiWAT. These results suggest that the low-protein diet did not change the intracellular pool or synthesis of APN in WAT. The effect of PPARγ activation on APN has been well studied. The TZDs-induced PPARγ activation has been reported to increase serum APN level with increase in its expression in WAT, suggesting that PPARγ activation affects APN synthesis [Citation11,Citation21,Citation22]. The low-protein diet could increase serum APN level in a different manner from the PPARγ activation.
In addition to the transcriptional and translational regulations, the post-translational regulation such as oligomerization is also important to regulate APN secretion and its circulating level [Citation13]. Regardless of PPARγ activation, ER chaperones, ERp44, DsbA-L, and Ero1-Lα, are known to regulate APN oligomerization and secretion. Overexpression of DsbA-L increased the ratio of HMW to total APN in vivo and in both cell lysates and cell culture medium of 3T3-L1 adipocytes [Citation15,Citation23]. The knockdown of Ero1-Lα inhibited and the knockdown of ERp44 enhanced APN oligomerization and secretion [Citation14,Citation16]. We found that the low-protein diet significantly reduced the ERp44 protein level in rat epiWAT, which could lead to enhance APN oligomerization and secretion. However, the low-protein diet did not change the protein level of Ero1-L and rather significantly decreased the DsbA-L protein levels in rat epiWAT. We also found that low-protein diet did not change the population of APN oligomers in rat epiWAT. These suggest that a low-protein diet increase APN secretion from the adipocyte without increasing APN oligomerization in epiWAT.
A study that was similar to our present investigation indicated that APN secretion was enhanced with no changes in the intracellular levels of APN and ER chaperones including ERp44, DsbA-L, and Ero1-Lα. DeClercq et al. showed that supplementation of fatty acids did not change cellular APN or these ER chaperone levels, but it did enhance APN secretion in 3T3-L1 adipocytes [Citation24]. Their results and ours suggest that the secretory control is important in the regulation of the circulating APN level in response to nutritional changes rather than the control of intracellular APN level and its oligomerization.
The low-protein diet increased the ratio of HMW to total APN in serum but not in the culture medium of the adipocytes. Besides the enhancement of APN secretion, the suppression of HMW APN degradation in circulation or its clearance [Citation25] could contribute to the increase in circulating APN level under the feeding of a low-protein diet.
The quality as well as the quantity of dietary protein/amino acids could affect serum APN level in rodents. Soy protein diet increased plasma APN level in rats [Citation26]. In addition, dietary methionine restriction has been shown to increase total and HMW APN in serum and improve metabolic disorders in ob/ob mice [Citation27]. The restriction of some essential amino acids in a diet could directly increase circulating APN level.
Besides the enhancement of insulin sensitivity, a low-protein diet is known to induce fatty liver in rats [Citation2,Citation28]. Indeed, the low-protein diet significantly increased hepatic TG level in our rat model. Fatty liver has a potential risk to progress to nonalcoholic steatohepatitis, hepatic cirrhosis, and carcinoma. The increased circulating APN level could contribute to the prevention of the development of fatty liver diseases under protein deprivation since APN has anti-inflammatory and anti-lipogenic effects [Citation6].
In conclusion, the findings described herein demonstrated that a low-protein diet enhances insulin sensitivity and increases total APN and the ratio of the HMW form of APN in rat serum. Despite the absence of a change in the APN expression level and its oligomerization in WAT, the low-protein diet enhanced the APN secretion from isolated adipocytes of WAT. The increased adiponectin secretion could contribute to the enhancement of insulin sensitivity induced by a low-protein diet. Further studies are necessary to elucidate the mechanisms and the physiological importance of an increasing serum APN level under protein deprivation.
Author contributions
Takashi Yagi conducted the experiments, analyzed the data, and wrote the manuscript. Yuka Toyoshima designed the study, conducted the experiments, analyzed the data, and wrote the manuscript. Reiko Tokita and Yusuke Taguchi conducted the experiments and analyzed the data. Yoshihisa Okamoto, Shin-Ichiro Takahashi, Hisanori Kato, and Shiro Minami wrote the manuscript. All authors discussed the data and reviewed the manuscript.
Acknowledgments
We thank Ms. Kanako Oki for her help with animal care. We are grateful for the discussions with Dr. Oksana Gavrilova (NIDDK, NIH) during the preparation of this manuscript. This work was partially supported by Grant-in-Aid for Young Scientist to Y. T. (JP25850095) from the Japan Society for Promotion of Science and by a grant to S. M. from Boehringer Ingelheim, Ono Pharmaceuticals, and Kyowa-Kirin.
Disclosure statement
No potential conflict of interest was reported by the authors.
References
- Okitolonda W, Brichard SM, Henquin JC. Repercussions of chronic protein-calorie malnutrition on glucose homeostasis in the rat. Diabetologia. 1987 December;30(12):946–951. PubMed PMID: 3125080
- Toyoshima Y, Tokita R, Taguchi Y, et al. Tissue-specific effects of protein malnutrition on insulin signaling pathway and lipid accumulation in growing rats. Endocr J. 2014;61(5):499–512. PubMed PMID: 24621780
- Reis MA, Carneiro EM, Mello MA, et al. Glucose-induced insulin secretion is impaired and insulin-induced phosphorylation of the insulin receptor and insulin receptor substrate-1 are increased in protein-deficient rats. J Nutr. 1997 March;127(3):403–410. PubMed PMID: 9082023
- Toyoshima Y, Tokita R, Ohne Y, et al. Dietary protein deprivation upregulates insulin signaling and inhibits gluconeogenesis in rat liver. J Mol Endocrinol. 2010 November;45(5):329–340. PubMed PMID: 20801894.
- Kadowaki T, Yamauchi T, Kubota N, et al. Adiponectin and adiponectin receptors in insulin resistance, diabetes, and the metabolic syndrome. J Clin Invest. 2006 July;116(7):1784–1792. PubMed PMID: 16823476; PubMed Central PMCID: PMC1483172.
- Ye R, Scherer PE. Adiponectin, driver or passenger on the road to insulin sensitivity? Mol Metab. 2013 April 19;2(3):133–141. PubMed PMID: 24049728; PubMed Central PMCID: PMC3773837. .
- Waki H, Yamauchi T, Kamon J, et al. Impaired multimerization of human adiponectin mutants associated with diabetes. Molecular structure and multimer formation of adiponectin. J Biol Chem. 2003 October 10;278(41):40352–40363. PubMed PMID: 12878598.
- Pajvani UB, Hawkins M, Combs TP, et al. Complex distribution, not absolute amount of adiponectin, correlates with thiazolidinedione-mediated improvement in insulin sensitivity. J Biol Chem. 2004 March 26;279(13):12152–12162. PubMed PMID: 14699128.
- Phillips SA, Kung JT. Mechanisms of adiponectin regulation and use as a pharmacological target. Curr Opin Pharmacol. 2010 December;10(6):676–683. . PubMed PMID: 20810317
- Silva FM, de Almeida JC, Feoli AM. Effect of diet on adiponectin levels in blood. Nutr Rev. 2011 October;69(10):599–612. . PubMed PMID: 21967160
- Maeda N, Takahashi M, Funahashi T, et al. PPARgamma ligands increase expression and plasma concentrations of adiponectin, an adipose-derived protein. Diabetes. 2001 September;50(9):2094–2099. PubMed PMID: 11522676; eng
- Tsuchida A, Yamauchi T, Takekawa S, et al. Peroxisome proliferator-activated receptor (PPAR)alpha activation increases adiponectin receptors and reduces obesity-related inflammation in adipose tissue: comparison of activation of PPARalpha, PPARgamma, and their combination. Diabetes. 2005 Dec;54(12):3358–3370. PubMed PMID: 16306350
- Liu M, Liu F. Transcriptional and post-translational regulation of adiponectin. Biochem J. 2009 December 14;425(1):41–52. PubMed PMID: 20001961. .
- Wang ZV, Schraw TD, Kim JY, et al. Secretion of the adipocyte-specific secretory protein adiponectin critically depends on thiol-mediated protein retention. Mol Cell Biol. 2007 May;27(10):3716–3731. PubMed PMID: 17353260; PubMed Central PMCID: PMC1899995.
- Liu M, Zhou L, Xu A, et al. A disulfide-bond A oxidoreductase-like protein (DsbA-L) regulates adiponectin multimerization. Proc Natl Acad Sci U S A. 2008 November 25;105(47):18302–18307. PubMed PMID: 19011089; PubMed Central PMCID: PMC2587637.
- Qiang L, Wang H, Farmer SR. Adiponectin secretion is regulated by SIRT1 and the endoplasmic reticulum oxidoreductase Ero1-L alpha. Mol Cell Biol. 2007 July;27(13):4698–4707. . PubMed PMID: 17452443; PubMed Central PMCID: PMC1951471
- Long Q, Lei T, Feng B, et al. Peroxisome proliferator-activated receptor-gamma increases adiponectin secretion via transcriptional repression of endoplasmic reticulum chaperone protein ERp44. Endocrinology. 2010 Jul;151(7):3195–3203. PubMed PMID: 20484463.
- Yamauchi T, Kamon J, Waki H, et al. The mechanisms by which both heterozygous peroxisome proliferator-activated receptor gamma (PPARgamma) deficiency and PPARgamma agonist improve insulin resistance. J Biol Chem. 2001 November 2;276(44):41245–41254. PubMed PMID: 11533050.
- Ito A, Suganami T, Miyamoto Y, et al. Role of MAPK phosphatase-1 in the induction of monocyte chemoattractant protein-1 during the course of adipocyte hypertrophy. J Biol Chem. 2007 August 31;282(35):25445–25452. PubMed PMID: 17611196.
- Okuno A, Tamemoto H, Tobe K, et al. Troglitazone increases the number of small adipocytes without the change of white adipose tissue mass in obese Zucker rats. J Clin Invest. 1998 March 15;101(6):1354–1361. PubMed PMID: 9502777; PubMed Central PMCID: PMC508690.
- Banga A, Unal R, Tripathi P, et al. Adiponectin translation is increased by the PPARgamma agonists pioglitazone and omega-3 fatty acids. Am J Physiol Endocrinol Metab. 2009 March;296(3):E480–9. PubMed PMID: 19088251; PubMed Central PMCID: PMC2660148.
- Rasouli N, Yao-Borengasser A, Miles LM, et al. Increased plasma adiponectin in response to pioglitazone does not result from increased gene expression. Am J Physiol Endocrinol Metab. 2006 January;290(1):E42–E46. PubMed PMID: 16118250.
- Liu M, Xiang R, Wilk SA, et al. Fat-specific DsbA-L overexpression promotes adiponectin multimerization and protects mice from diet-induced obesity and insulin resistance. Diabetes. 2012 November;61(11):2776–2786. PubMed PMID: 22807031; PubMed Central PMCID: PMC3478538.
- DeClercq V, d’Eon B, McLeod RS. Fatty acids increase adiponectin secretion through both classical and exosome pathways. Biochim Biophys Acta. 2015 September;1851(9):1123–1133. . PubMed PMID: 25900100
- Halberg N, Schraw TD, Wang ZV, et al. Systemic fate of the adipocyte-derived factor adiponectin. Diabetes. 2009 September;58(9):1961–1970. PubMed PMID: 19581422; PubMed Central PMCID: PMC2731534.
- Nagasawa A, Fukui K, Kojima M, et al. Divergent effects of soy protein diet on the expression of adipocytokines. Biochem Biophys Res Commun. 2003 November 28;311(4):909–914. PubMed PMID: 14623267
- Malloy VL, Perrone CE, Mattocks DA, et al. Methionine restriction prevents the progression of hepatic steatosis in leptin-deficient obese mice. Metabolism. 2013 November;62(11):1651–1661. PubMed PMID: 23928105.
- Ozaki Y, Saito K, Nakazawa K, et al. Rapid increase in fibroblast growth factor 21 in protein malnutrition and its impact on growth and lipid metabolism. Br J Nutr. 2015 November 14;114(9):1410–1418. PubMed PMID: 26330054.