
 ?Mathematical formulae have been encoded as MathML and are displayed in this HTML version using MathJax in order to improve their display. Uncheck the box to turn MathJax off. This feature requires Javascript. Click on a formula to zoom.
ABSTRACT
This study investigated the contents of saponins and phenolic compounds in relation to their antioxidant activity and α-glucosidase inhibition activity of 7 colored quinoa varieties. The total saponin content was significantly different among 7 varieties and ranged from 7.51 to 12.12 mg OAE/g DW. Darker quinoa had a higher content of phenolic compounds, as well as higher flavonoids and antioxidant activity than that of light varieties. Nine individual phenolic compounds were detected in free and bound form, with gallic acid and ferulic acid representing the major compounds. The free and bound phenolic compounds (gallic acid and ferulic acid in particular) exhibited high linear correlation with their corresponding antioxidant values. In addition, the free phenolic extracts from colored quinoa exhibited higher inhibitory activity against α-glucosidase than the bound phenolic extracts. These findings imply that colored quinoa with abundant bioactive phytochemicals could be an important natural source for preparing functional food.
Graphical abstract
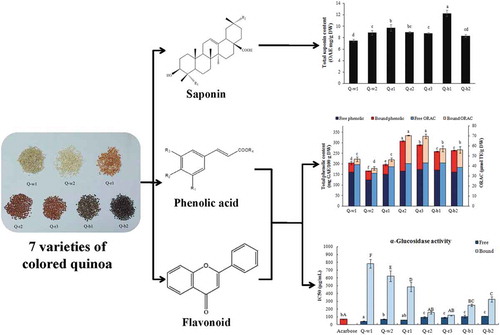
characterization of saponins and phenolic compounds: antioxidant activity and inhibitory effects on α-glucosidase in different varieties of colored quinoa
Oxidative stress is a negative effect caused by reactive oxygen free radicals and is considered to play a causative role in chronic diseases, including diabetes, atherosclerosis, cardiovascular disease and several types of cancers [Citation1]. Natural antioxidants such as phenolics have been extensively studied due to their capability of preventing diseases associated with oxidative stress [Citation2]. Whole grains have been receiving considerable attention because of their abundant phenolic content [Citation3]. Phenolics are secondary metabolites of plants that can exist in a free or bound form. Free phenolics can be extracted into solution, while bound phenolic are often covalently conjugated to cell wall components via ester bonds [Citation4]. In general, bound phenolics in ingested food have been reported to reach the colon without digestion in the gastrointestinal tract and provide a slow and continuous release via the micro-flora, thus exerting several beneficial effects [Citation5]. Therefore, it is important to systematically determine the free and bound phenolics to understand the potential healthy benefit of whole grain.
Quinoa (Chenopodium quinoa Willd) represents a pseudocereal of the Chenopodiacee family that has been receiving a renewed interest due to its complete nutritional profile [Citation6]. It is not only rich in good quality proteins with excellent amino acid balance, unsaturated lipids and dietary fibers, but also phytochemicals such as phenolic acids, flavonoids and saponins [Citation7–Citation9]. The presence of these phytochemicals can differ among varietal variability and environmental conditions of cereal [Citation3,Citation10–Citation12]. Quinoa seeds are the major edible parts of the plant and can be at least divided into three types based on its color, including white, red and black [Citation13]. A recent study reported the content of phenolic compounds and their antioxidant activity of 6 colored quinoa varieties [Citation8]. It should be noted that this research only reported the free phenolics on the basis of the extraction method, while bound phenolics and their contribution to antioxidant activity were not involved. In fact, the majority of phenolic compounds present in whole grains are found in bound form in investigations on brown rice, wheat, corn, and oat [Citation14–Citation16]. It is easy to deduce that there will be an underestimation of the phenolic content if the bound fraction was not included. Furthermore, the differences in bound phenolic compounds and their relation to the antioxidant activity have rarely been studied partially due to genotypic diversity of quinoa. In addition, different varieties of colored quinoa mature in different time periods. Their phenolic compositions are assumed to differ due to the differences in cultivation environment and varieties. It is highly necessary to investigate phenolic profiles and antioxidant activity of different colored quinoa varieties.
On the other hand, α-glucosidase is a key enzyme involved in the digestion of carbohydrates in the small intestine, and studies on phenolic compounds of quinoa have shown inhibitory effects on α-glucosidase [Citation17,Citation18]. However, there have been no studies that have focused comprehensively on the inhibition of both the free and bound phenolics from colored quinoa towards α-glucosidase activity. Another important family of quinoa is saponins. These compounds, located in the outer layers of quinoa, have recently shown a broad variety of biological effects, such as antifungal, anti-cancer, anti-inflammatory and antioxidant activity [Citation19,Citation20]. Therefore, it is meaningful to investigate the difference in phytochemicals and their biological activities among different colored quinoa. It will enhance our knowledge in terms of the nutritive values of these diverse cultivars.
Summarily, little information is available on the difference in phytochemical profiles and their biological activities of different colored quinoa, which has been widely consumed in the northwest of china. Therefore, in the present study, 7 colored quinoa varieties with different origins were analyzed to determine (1) the total saponin content; (2) the contents of free and bound phenolics and their antioxidant activity; (3) the compositions and content of individual phenolics in both free and bound forms; (4) the inhibitory activity of phenolics against α-glucosidase. This research can provide critical guidance for the consumption of colored quinoa, and the development of quinoa-based functional foods.
Materials and methods
Chemicals and reagents
6-Hydroxy-2,5,7,8-tetramethylchroman-2-carboxylic acid (Trolox), 2,4,6-tripyridyl-s-triazine (TPTZ), fluorescein disodium salt, 2,2ʹ-azobis (2-amidinopropane) dihydrochloride (ABAP), Folin–Ciocalteu reagent, acarbose, rat intestinal acetone powder and 4-nitrophenyl-α-D-glucopyranoside (p-NPG) were purchased from Sigma-Aldrich Chemical Co. (St. Louis, MO, USA). HPLC-grade acetonitrile and acetic acid were from Fisher (Suwanee, GA, USA). Standards of phenolic compounds were obtained from Aladdin Reagents (Shanghai, China). All other reagents were of analytical grade.
Quinoa samples
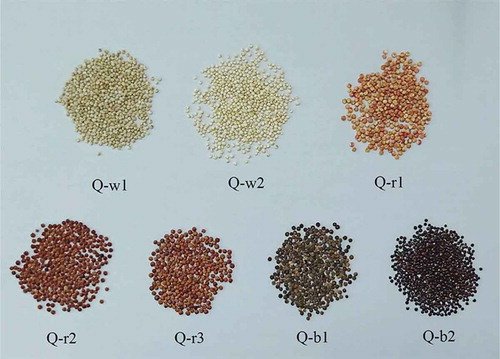
A total of 7 unprocessed quinoa varieties () were employed in the present study. Concretely, four varieties of white (Q-w1), red (Q-r1 and Q-r2) and black (Q-b1) were obtained from Huaqing Quinoa Co. Ltd. (Shanxi, China), and three varieties of white (Q-w2), red (Q-r3) and black (Q-b2) were obtained from local market in Peru. All samples were briefly milled into powder through an 80-screen mesh and then stored at −20°C prior to extraction.
Figure 1. Representative photographs in appearance and the sample code of 7 colored quinoa varieties.
Extraction and determination of total saponin
The total saponins were extracted according to a previous method with slight modifications [Citation21]. Quinoa samples were extracted in reflux at 80°C for 1 h with 50 mL of methanol. The mixture was then centrifuged at 2500 × g for 10 min to separate the supernatant, and this process was repeated once. The combined supernatants were concentrated through an Eyelan-1100 rotary evaporator at 45°C (Tokyo Rikakikai Co. Ltd, Tokyo, Japan) to a final volume of 10 mL. The final extract solution was stored at −20°C until use.
The total saponin content was measured based on a previously described method with some modifications [Citation22]. Briefly, 0.2 mL of the saponin extracts was put in a 70°C water bath to remove the solvent. After cooling, the residue was mixed with 0.2 mL of 5% (w/v) vanillin in the 17 M acetic acid. Then, 0.8 mL of 72% perchloric acid was added and reacted in a 70°C water bath for 10 min. The cooled mixture was then mixed with 5 mL of 17 M acetic acid and incubated in room temperature for an additional 10 min. The absorbance was measured at 550 nm using a Shimadzu UV-1800 spectrometer (Shimadzu Inc., Kyoto, Japan), and oleanolic acid was used as the standard. The total saponin content was expressed as mg of oleanolic acid equivalents (OAE) per g dry weight (DW) of quinoa sample.
Extraction of free and bound phenolics
The free fraction of phenolics was extracted according to a previous method [Citation23]. Briefly, 2 g quinoa sample was homogenized with 50 mL of chilled 80% (v/v) aqueous acetone at 10,000 rpm for 5 min in an ice bath. Then, the supernatant was separated by centrifugation at 2500 × g for 10 min, and the residue was extracted again under the same conditions. The combined supernatants were evaporated under vacuum at 45°C. The extract containing free phenolics was reconstituted to a final volume of 10 mL with methanol and then stored at −20°C until analysis.
The bound phenolics were extracted based on a previous research [Citation24]. The residue remaining after extracting free phenolics was digested with 40 mL of 2 M NaOH at room temperature for 2 h with continuous shaking under nitrogen gas. The pH of the mixture was instantly adjusted to 1.0 by adding 6 M HCl, and then extracted five times with 100 mL ethyl acetate. The ethyl acetate supernatants were pooled and evaporated under vacuum at 45°C. The extract containing bound phenolics was reconstituted with 10 mL of methanol and then stored at −20°C until use.
Determination of free and bound phenolic contents
The total phenolic content of the free and bound extracts was determined using the Folin-Ciocalteu colorimetric method [Citation25]. Briefly, 125 μL of the phenolic extracts were diluted with 500 μL of distilled water and reacted with 125 μL of Folin–Ciocalteu reagent for 6 min. Then, 1.25 mL of 7% (w/v) Na2CO3 solution was added to the mixture and left in the dark for an additional 90 min. The absorbance of the solution was measured at 760 nm using gallic acid as the standard. The phenolic content was expressed as mg of gallic acid equivalents (GAE) per 100 g DW of sample.
Determination of free and bound flavonoid contents
The flavonoid content of free and bound extracts was measured according to a previous method [Citation26]. A 300 μL aliquot of extracts was mixed with 1.5 mL of distilled water and then reacted with 90 μL of 5% (w/v) NaNO2 solution for 6 min. The mixture was incubated for 5 min at room temperature after 180 μL of 10% (w/v) AlCl3•6H2O solution was added. Then, the mixture was reacted with 600 μL of 1 M NaOH solution and the distilled water was then added to bring the final volume to 3 mL. The absorbance was detected at 510 nm and catechin was used as the standard. The flavonoid content was expressed as mg of catechin equivalents (CE) per 100 g DW of sample.
Determination of phenolic profile
The free and bound phenolic extracts were filtered through a 0.25 μm membrane filter (Millipore, MA, USA) for analysis of individual phenolic compounds. The identification of phenolic compounds was performed by high-performance liquid chromatography (HPLC) using an Agilent Zorbox SB-C18 column (250 × 4.6 mm i.d., 5 µm) (Palo Alto, CA, USA) according to a previous method [Citation27]. Gradient elution was used with the mobile phase of 0.4% (v/v) acetic acid (solvent A) and acetonitrile (solvent B), as follows: solvent B from 5 to 25% in the 0–40 min period, from 25 to 35% in the 40–45 min period and from 35 to 50% in the 45–50 min period. The injection volume of the free and bound phenolic extracts was 20 μL, and the flow rate of the mobile phase was 1.0 mL/min. The wavelengths used for identification were 254 nm, 280 nm and 320 nm, respectively. Nine individual phenolic compounds including gallic acid, protocatechuic acid, p-hydroxybenzoic acid, vanillic acid, vanillin, p-coumaric acid, ferulic acid, rutin, and quercetin were used as standards. The qualitative and quantitative measurements of the individual phenolic compounds were based on the retention time and the chromatography of each standard. The content of phenolic compounds was expressed as μg per g DW of sample.
Determination of antioxidant activity
Oxygen radical scavenging capacity (ORAC) assay
The ORAC assay was carried out according to a reported procedure [Citation3]. To each well of a 96-well black-walled plate (Corning Scientific, Corning, NY), a volume of 20 μL of diluted phenolic extracts or standards of trolox (6.25–50 μM) was added and mixed with 200 μL fluorescein (0.96 μM in 75 mM phosphate buffer, pH 7.4). After incubation for 20 min at 37°C, 20 μL of 119 mM ABAP solution was added to each well to initiate the reaction. The fluorescence intensity (485 nm for excitation and 538 nm for emission) was detected every 4.5 min for 35 cycles using a Fluoroskan Ascent FL plate-reader (Thermo Labsystems, Franklin, MA, USA). The ORAC value was expressed as μM Trolox equivalents (TE) per g DW of sample.
Ferric reducing antioxidant power (FRAP) assay
The FRAP assay was analyzed based on a modified method [Citation28]. The FRAP-working reagent consisted of 300 mM acetate buffer (pH 3.6), 10 mM TPTZ in 40 mM HCl and 20 mM FeCl3•6H2O solution mixed in a 10:1:1(v/v/v) ratio. After incubation at 37°C, 5 μL of diluted phenolic extracts or standards of trolox (0.15–1.5 mM) and 180 μL of the FRAP working reagent were added to a 96-well plate and incubated in the dark at room temperature for 30 min. The absorbance was measured at 593 nm against the reagent blank. The FRAP value was expressed as mg of Trolox equivalents (TE) per 100 g DW of sample.
α-glucosidase inhibitory activity assay
The inhibitory activity of phenolic extracts from quinoa against rat intestinal α-glucosidase was determined according to the previous methods with slight modifications [Citation29,Citation30]. The crude α-glucosidase solution was extracted from rat intestinal acetone powder. Briefly, 200 mg of rat intestinal acetone powder was mixed with 4 mL of 50 mM chilled phosphate buffer (pH 6.8). The mixture was sonicated in an ice bath for 15 min, vortexed for 20 min, and then centrifuged at 10,000 × g at 4°C for 30 min, respectively. The supernatant was used as α-glucosidase enzyme solution. A 100 μL aliquot of diluted phenolic extracts, acarbose (positive control) or solvent blank (50 mM phosphate buffer, pH 6.8) was mixed with 25 μL of the α-glucosidase enzyme solution in a 96-well plate and incubated under shaking at 37°C for 10 min. Then, 25 μL of 1 mM p-NPG was added to each well. After incubation at 37°C for 30 min, 50 μL of 0.2 M Na2CO3 was added to terminate the reaction. The absorbance was detected at 405 nm. The inhibition of α-glucosidase was calculated as follows:
The IC50 values were obtained from the least-squares regression line of the plots of the logarithm of the sample concentration (log) versus α-glucosidase inhibitory activity (%).
Statistical analysis
All experiments were repeated 3 times, and the data were expressed as the mean value ± standard deviation (SD). One-way analysis of variance (ANOVA) was used to compare the means, followed by the SNK-q test (p < 0.05). Pearson’s correlation coefficients (r) were calculated to evaluate the linear relationships between the phenolic content and the antioxidant activity. All statistical analysis was performed using the SPSS 19.0 software (SPSS Inc. Chicago, IL, USA).
Results and discussion
Total saponin content
The total saponin content of 7 colored quinoa varieties is shown in . The content of total saponin showed significant differences among 7 varieties, ranging from 7.51 (Q-w1) to 12.24 (Q-b1) mg OAE/g DW (p < 0.05). The coefficient of variation (CV) of total saponin content in quinoa varieties was 15.1%. Q-b1 exhibited the highest total saponin content, followed by Q-r1. However, there was no statistically significant difference observed in total saponin content of the next four varieties (Q-r3, Q-w2, Q-r2 and Q-b2) (p > 0.05). Q-w1 showed the lowest total saponin content. In a previous study, the saponin content of two quinoa varieties was 56.92 and 75.84 mg/g [Citation31]. It was higher than saponin content obtained in this study. This is partly because of a different method used for extraction and quantification. Moreover, a recent study investigated the saponins from 28 quinoa varieties using the same quantification method found in this study, and showed that the saponin content ranged from 6.6 to 30.9 mg/g DW [Citation32]. This result is consistent with the content range of 7 quinoa varieties presently reported.
Figure 2. The total saponin content of 7 colored quinoa varieties. Error bars correspond to the standard deviation (n = 3). Values with different letters are significantly different (p < 0.05). OAE: oleanolic acid equivalents; DW: dry weight.
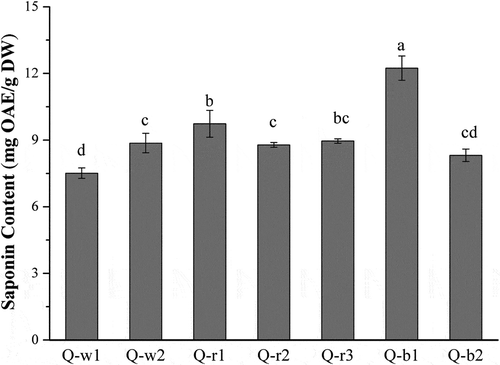
In addition, several factors such as genetic and environmental condition also affected total saponin content of quinoa. It has been demonstrated that the saponin content of different quinoa varieties grown under similar agronomical conditions differed significantly [Citation32]. Furthermore, Gómez-Caravaca et al. [Citation21] reported that growing conditions such as irrigation and salinity had a significant influence on the saponin content of quinoa. Therefore, the identification of saponins in different quinoa varieties is a matter of potential agronomic and pharmacological interest.
Total phenolic content
The total phenolic content in 7 colored quinoa varieties and the contribution of free and bound fractions to the total content are shown in . Results indicated that total phenolic content ranged from 167.15 (Q-w2) to 308.32 (Q-r2) mg GAE/100 g DW. The CV of total phenolic content in quinoa varieties was 20.1%, indicating that there were significant differences in phenolic content among 7 varieties (p < 0.05). Q-r2 exhibited the highest total phenolic content, followed by Q-r3 and Q-b2, while Q-w2 showed the lowest content. These findings indicate that darker varieties (red and black) of quinoa had higher phenolic content than light varieties (white and light red). The total phenolic content of red (Q-r2, Q-r3) and black (Q-b1, Q-b2) quinoa was, on average, 1.6 and 1.4 times higher than that of white quinoa (Q-w1, Q-w2), respectively. This is the result of the red and black quinoa containing a larger amount of pigments called betalains [Citation33]. Betalains with a phenolic hydroxyl group can react with the Folin–Ciocalteu reagent, leading to the increase of total phenolic content [Citation34]. A significant positive correlation between total betalain content and total phenolic content was found in quinoa seed [Citation35]. On the other hand, the total phenolic content of quinoa grown in different places (such as Q-w1 vs. Q-w2 and Q-r2 vs. Q-r3) differed significantly. This finding suggests that environmental conditions might play an important role in the phenolic content of quinoa. Similar phenomena were also observed in other cereals such as wheat and millet [Citation11,Citation36].
Table 1. The total phenolic and flavonoid contents of 7 colored quinoa varieties and the contribution (%) of free and bound fractions to the total content.
The free phenolic content ranged from 124.73 (Q-w2) to 173.23 (Q-r3) mg GAE/100 g DW, and the contribution of free fraction to the total content varied from 53.5% (Q-r2) to 78.1% (Q-w1). The bound phenolic content ranged from 42.42 (Q-w2) to 143.47 (Q-r2) mg GAE/100 g DW with the contribution ranging from 21.9% (Q-w1) to 46.5% (Q-r2). It should be noted that the bound phenolic content of darker quinoa was much higher than that of light varieties. Similar results were reported that the phenolic content of bound fractions was highest in black quinoa followed by red and white quinoa [Citation18]. Moreover, a previous study reported that the bound fractions of white, red and black quinoa contributed 60.0%, 54.4% and 49.1% to the total phenolic content, respectively [Citation13]. These results indicate that the bound fractions are also an important part of phenolics in quinoa. Dietary intake of free phenolics will rapidly release in the stomach and small intestine and be absorbed in order to exert health benefits, such as inhibition of human low density lipoprotein (LDL) cholesterol oxidation and liposomes [Citation37], while dietary intake of bound phenolics may explain the protective role in prevention of colon cancer [Citation38]. Therefore, these results provide useful information for the utilization of free and bound phenolics from colored quinoa in the food industry.
Total flavonoid content
Previous studies have illustrated that the biological effects such as antioxidant and anti-inflammatory activities of quinoa might be attributable to the presence of flavonoids [Citation39,Citation40]. The total flavonoid content of 7 varieties and the contribution of free and bound fractions to the total content are shown in . The total flavonoid content ranged from 139.35 (Q-w2) to 307.11(Q-r2) mg CE/100 g DW with a CV of 17.8%. Q-r2 had the highest flavonoid content, followed by Q-r3 and Q-b1, while Q-w2 showed the lowest content. In addition, a previous study reported that the total flavonoid content ranged from 36.2 to 144.3 mg/100 g in different colored quinoa varieties [Citation39]. It can be seen from this study that the flavonoid content was much lower than those in the present study. This is partly due to the fact that the determination of flavonoid content did not include the contribution of bound fractions.
The free and bound flavonoid content ranged from 96.09 (Q-w2) to 174.44 (Q-r3) mg CE/100 g DW, and 43.26 (Q-w2) to 151.27 (Q-r2) mg CE/100 g DW, respectively. The contribution of bound fraction to the total flavonoid content ranged from 27.1% (Q-w1) to 48.8% (Q-r2), with an average of 36.7%. This result is consistent with a previous study reporting that the bound flavonoid of red quinoa contributed an average of 37.3% [Citation35].
Phenolic profile
Nine phenolic compounds including gallic acid, protocatechuic acid, p-hydroxybenzoic acid, vanillic acid, vanillin, p-coumaric acid, ferulic acid, rutin and quercetin were detected in free and bound forms of 7 colored quinoa varieties (). All of the phenolic acids were detected in both free and bound form, with the exception of vanillic acid. Gallic acid was identified as the predominant compound. The free, bound and total gallic acid content ranged from 150.20 (Q-w2) to 298.52 (Q-r2), 13.60 (Q-r1) to 32.86 (Q-r2) and 167.79 (Q-w2) to 331.37 (Q-r2) μg/g, respectively. The contribution of bound gallic acid to the total content was from 5.8% (Q-w1) to 10.8% (Q-b1), suggesting that gallic acid found in quinoa is mainly present in free form. Gallic acid content was previously reported from 6.53 to 97.42 μg/g [Citation8,Citation17]. The content was lower than results presented here, and a probable reason is different varieties and origins of quinoa sample. Ferulic acid was the second-highest phenolic acid observed in quinoa, and the content ranged from 146.88 (Q-w2) to 274.25 (Q-r2) μg/g. Different from gallic acid, the contribution of bound ferulic acid to the total content was from 38.7% (Q-w2) to 57.8% (Q-r2), while Q-r2 was the only variety having more bound ferulic acid than free. In addition, the content of protocatechuic acid, p-hydroxybenzoic acid, vanillic acid, vanillin and p-coumaric acid ranged from 15.46 to 70.17, 46.05 to 74.54, 18.91 to 49.08, 11.73 to 24.22 and 32.50 to 86.71 μg/g, respectively. The contribution of each bound fraction to their respective total content was in the range of 43.3–94.4% for protocatechuic acid, 32.3–51.2% for p-hydroxybenzoic acid, 5.5–14.1% for vanillin and 26.1–52.0% for p-coumaric acid, respectively.
Table 2. Phenolic compounds of 7 colored quinoa varieties and the contribution (%) of free and bound fractions to the total content of each phenolic compound.
In the present study, two flavonoids (rutin and quercetin), including free and bound forms, were also detected in quinoa. The content of rutin and quercetin ranged from 19.87 (Q-w2) to 57.78 (Q-b1) and 11.61 (Q-w2) to 41.51 (Q-r2) μg/g, respectively. Meanwhile, they were found to be the major flavonoids of quinoa in recent studies [Citation8,Citation17]. Gómez-Caravaca et al. [Citation31] also reported that the average content of rutin and glycoside of quercetin in free form of two quinoa varieties was 120 and 304 μg/g. Our results showed that the bound rutin and quercetin contributed significantly to the total content, and the contribution ranged from 9.7% to 16.3% and 31.5% to 47.4%, respectively.
Quinoa variety had no effect on the composition of these nine phenolic compounds in the free fraction, but did have a significant effect on the bound fraction of vanillic acid, vanillin and rutin. Moreover, the content of nine phenolic compounds was also significantly different (p < 0.05), and the diversity of these phenolic compounds depends on a number of intrinsic factors (genus, species and cultivar) and extrinsic factors (agronomic, environment, handling and storage) [Citation41].
Antioxidant activity
It is well known that the single antioxidant activity assay cannot comprehensively evaluate the activity of all antioxidants in a complicated food system [Citation42]. Therefore, oxygen radical absorbance capacity (ORAC) and ferric reducing antioxidant power (FRAP) assays were used to determine the antioxidant activity of colored quinoa. The results showed that the antioxidant activity of each quinoa variety determined by ORAC and FRAP assays were consistent (). The total ORAC value of 7 varieties ranged from 35.06 (Q-w2) to 70.48 (Q-r2) μmol TE/g DW with a CV of 21.4%, and the total FRAP value varied from 110.26 (Q-w2) to 216.71 (Q-r2) mg TE/100 g DW with a CV of 22.3%. Q-r2 showed the highest antioxidant activity, followed by Q-r3, Q-b1 and Q-b2. The next two varieties (Q-w1, Q-r1) were not significantly different (p > 0.05). Q-w2 exhibited the lowest antioxidant activity. Red quinoa exhibited higher antioxidant activity compared with black quinoa, and the average antioxidant value of ORAC and FRAP assays were 1.23 and 1.15 times than black quinoa, respectively. Moreover, lower FRAP and ORAC values of different quinoa varieties were observed in the previous studies [Citation43,Citation44]. Quinoa was also found to exert stronger antioxidant activity than common cereals and beans [Citation44–Citation46]. Therefore, quinoa has great potential to be a natural antioxidant source of cereal due to the high antioxidant activity.
Table 3. Antioxidant activity of 7 colored quinoa varieties evaluated through the ORAC and FRAP assays and the contribution (%) of free and bound fractions to total antioxidant activity.
The free and bound antioxidant activity and their contribution to the total values are shown in . The free and bound ORAC values ranged from 32.55 (Q-w2) to 43.08 (Q-r3) and 5.06 (Q-w2) to 28.08 (Q-r2) μmol TE/g DW, and the contribution of bound fractions to the total varied from 7.2% (Q-w2) to 39.8% (Q-r2). Similarly, the free and bound FRAP values ranged from 79.96 (Q-w2) to 136.80 (Q-r3) and 30.29 (Q-w2) to 102.48 (Q-r2) mg TE/100 g DW, and the contribution of bound fractions ranged from 21.9% (Q-r1) to 47.3% (Q-r2). These results indicate that the bound fractions of darker quinoa contributed higher to the total. It is mainly attributed to the discovery that the phenolics of darker quinoa had a much higher content in the bound form than light quinoa.
The Pearson’s coefficients between the phenolic compounds of 7 colored quinoa varieties and their antioxidant activity are calculated (). The results showed that the ORAC and FRAP values were positively correlated with the total phenolic and flavonoid contents. The correlation coefficients (r) were as high as 0.969, 0.977, 0.981 and 0.941, 0.987, 0.988 between the free, bound, total phenolic contents and their corresponding ORAC and FRAP values (p < 0.01), respectively. Similarly, r values between the free, bound, total flavonoid contents and their corresponding ORAC and FRAP values were 0.887, 0.965, 0.980 and 0.965, 0.991, 0.995, respectively (p < 0.01). A high linear correlation between the phenolic content and their antioxidant activity was also found in common cereals such as wheat, maize, rice and barley [Citation10,Citation12,Citation47,Citation48]. In addition, some major phenolic compounds of colored quinoa such as gallic acid, p-hydroxybenzoic acid, ferulic acid and quercetin also exhibited high linear correlation with ORAC and FRAP values (p < 0.01), while the Pearson’s coefficients between p-coumaric acid content and ORAC or FRAP values were too low to show the significant correlation (p > 0.05). These findings suggest that the phenolic compounds such as gallic acid and ferulic acid of colored quinoa could be used as an important indicator of their antioxidant activity.
Table 4. The Pearson’s correlation coefficients between the phenolic compounds of 7 colored quinoa varieties and their antioxidant activity.
α-glucosidase inhibitory activity
The inhibitory activity of the free and bound phenolic extracts from 7 colored quinoa varieties on α-glucosidase is shown in . The inhibitory rate of all extracts on α-glucosidase increased with the increasing phenolic content. The results showed that the free phenolic extracts exhibited higher inhibitory activity than bound phenolic extracts. A similar phenomenon was reported previously in millet varieties [Citation49]. This result might be attributed to the fact that free phenolic extracts contain more gallic acid, p-hydroxybenzoic acid, ferulic acid and rutin, which have been demonstrated as strong α-glucosidase inhibitors [Citation50,Citation51].
Figure 3. Inhibition activity of (a) free and (b) bound phenolic extracts from 7 colored quinoa varieties against α-glucosidase. Error bars correspond to the standard deviation (n = 3).
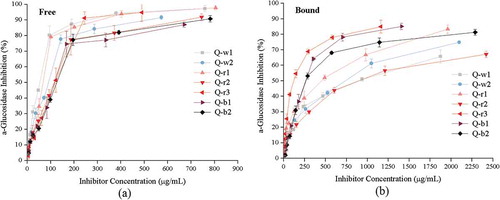
The IC50 values of α-glucosidase inhibition by free and bound phenolic extracts from 7 colored quinoa varieties are shown in . Among all free phenolic extracts, Q-w1 exhibited the strongest inhibitory activity on α-glucosidase, with an IC50 value of 42.23 μg/mL, followed by Q-r1 and Q-w2 (IC50 values were 58.11 and 69.55 μg/mL, respectively). The IC50 values of the last 4 samples were 90.65 μg/mL for Q-r3, 94.36 μg/mL for Q-r2, 103.49 μg/mL for Q-b1 and 106.54 μg/mL for Q-b2, respectively, with no statistically significant difference (p > 0.05). These results were comparable to previous reports that the IC50 values of α-glucosidase inhibitory activity by phenolic extracts from quinoa ranged from 62.1 to 182.0 μg/mL [Citation17]. In addition, the IC50 values of the bound phenolic extracts increased in the order of Q- r3 < Q- r2 < Q- b1 < Q- b2 < Q- r1 < Q- w2 < Q- w1, ranging from 120.26 to 783.34 μg/mL. However, the inhibitory activity of bound phenolic extracts from three quinoa varieties (white, red and black) on α-glucosidase in a previous study (IC50 values ranged from 37.58 to 55.58 mg/mL) were significantly higher than the presented results [Citation18]. This might be due to different extraction procedures of phenolic extracts and determination methods of enzyme inhibition.
Table 5. IC50 values of α-glucosidase inhibition by free and bound phenolic extracts from 7 colored quinoa varieties.
The Pearson’s correlation coefficients between the phenolics, flavonoids of 7 colored quinoa varieties and their IC50 value of α-glucosidase inhibitory activity are also calculated (). The results showed that the free phenolic, flavonoid contents were negatively correlated with their corresponding α-glucosidase inhibitory activity, while the bound phenolic, flavonoid contents showed a high linear correlation with their corresponding α-glucosidase inhibitory activity. The correlation coefficients (r) between the free phenolic, flavonoid contents and their corresponding IC50 values of α-glucosidase inhibitory activity were 0.436 and 0.579 (p > 0.05), and r values between the bound phenolic, flavonoid contents with their corresponding IC50 values of α-glucosidase inhibitory activity were −0.890 and −0.879, respectively (p < 0.01). These results might be attributed to that the free phenolic extracts may contain some other biological active compounds which have a strong inhibitory activity on α-glucosidase, while the bound phenolic extracts had a relative high purity due to the ethyl acetate extraction from the residue of the free extracts. Therefore, the bound phenolic extracts showed a higher linear correlation with the α-glucosidase inhibitory activity. In addition, all free phenolic compounds had no significantly correlated with their corresponding α-glucosidase inhibitory activity (p > 0.05). Conversely, some bound phenolic compounds such as gallic acid, vanillin and quercetin exhibited high linear correlation with their corresponding α-glucosidase inhibitory activity (p < 0.01), and the r values were −0.914, −0.899 and −0.881, respectively.
Table 6. The Pearson’s correlation coefficients between the phenolic compounds of 7 colored quinoa varieties and their IC50 values of α-glucosidase inhibitory activity.
Although the IC50 values in the present study were higher than the values of wheat bran (37.58 μg/mL) [Citation52], small millets (ranged from 18.6 to 29.47 μg/mL) [Citation49] and black rice bran (8.59 μg/mL for free extract and 15.26 μg/mL for bound extract) [Citation29], these are lower than the values of red rice, black barely and black soybean (>1000 μg/mL) [Citation51]. Interestingly, the IC50 values of the free phenolic extracts from Q-w1, Q-r1 and Q-w2 were much lower than that of acarbose (71.13 μg/mL). The findings suggest that these three quinoa varieties have a potential function in the control of postprandial hyperglycemia and could be processed into functional food for the inhibition of glucose absorption in the small intestine.
Conclusion
The saponins and phenolic compounds in relation to the antioxidant activity and the inhibitory activity against α-glucosidase of different colored quinoa varieties from different origins were investigated in the present study. The results showed that there are significant differences in saponin content (p < 0.05), ranging from 7.51 to 12.12 mg OAE/g DW. The phenolic and flavonoid content and their antioxidant activity were dependent on the color of the quinoa seed. Darker quinoa had higher phenolic and flavonoid contents, as well as higher antioxidant activity. Nine phenolic compounds were detected in colored quinoa. Gallic acid and p-hydroxybenzoic acid were mainly present in free form, while ferulic acid was mainly existed in bound form. Interestingly, the bound ferulic acid of Q-r2 contributed 57.8% to the respective total content. In addition, some major phenolic compounds, such as gallic acid and ferulic acid, exhibited significant linear correlation with their corresponding antioxidant value (p < 0.05), suggesting that they could be used as an important indicator of the antioxidant activity of colored quinoa. Moreover, the free and bound phenolic extracts from 7 colored quinoa varieties both had higher inhibitory activity against α-glucosidase, of which free extracts exhibited a stronger inhibitory rate than their corresponding bound extracts. Particularly, free fractions of Q-w1, Q-r1 and Q-w2 showed higher inhibition than acarbose. These results provide important information for the processing and utilization of colored quinoa as functional foods to improve consumer health.
Author contributions
Ler Liu, Jianwei Chi and Mingwei Zhang conceived and designed the research. Yameng Han performed the experiments and wrote the paper. Lei Liu and Ruifen Zhang contributed to the revision of the manuscript. Sanhong Fan, Fei Huang and Kaming Xue participated in analyzing data.
Disclosure statement
No potential conflict of interest was reported by the authors.
Additional information
Funding
References
- Sharma N. Free radicals, antioxidants and disease. Biol Med. 2014;06(3):2–6.
- Shahidi F, Ambigaipalan P. Phenolics and polyphenolics in foods, beverages and spices: antioxidant activity and health effects – A review. J Funct Food. 2015;18:820–897.
- Zhang MW, Zhang RF, Zhang FX, et al. Phenolic profiles and antioxidant activity of black rice bran of different commercially available varieties. J Agric Food Chem. 2010;58(13):7580–7587.
- Su T, Kozo N, Hiroshi K. Analysis of phenolic compounds in white rice, brown rice, and germinated brown rice. J Agric Food Chem. 2004;52(15):4808.
- Vitaglione P, Napolitano A, Fogliano V. Cereal dietary fibre: A natural functional ingredient to deliver phenolic compounds into the gut. Trends Food Sci Technol. 2008;19(9):451–463.
- Abugoch James LE. Quinoa (Chenopodium quinoa Willd.): compositions, chemistry, nutritional, and functional properties. Adv Food Nutr Res. 2009;58:1–31.
- Pasko P, Zagrodzki P, Barton H, et al. Effect of quinoa seeds (Chenopodium quinoa) in diet on some biochemical parameters and essential elements in blood of high fructose-fed rats. Plant Food Hum Nutr. 2010;65(4):333–338.
- Pellegrini M, Lucas-Gonzales R, Ricci A, et al. Chemical, fatty acid, polyphenolic profile, techno-functional and antioxidant properties of flours obtained from quinoa (Chenopodium quinoa Willd) seeds. Ind Crop Prod. 2018;111:38–46.
- Pereira E, Encina-Zelada C, Barros L, et al. Chemical and nutritional characterization of Chenopodium quinoa Willd (quinoa) grains: A good alternative to nutritious food. Food Chem. 2019;280:110–114.
- Adom KK, Sorrells ME, Liu RH. Phytochemical profiles and antioxidant activity of wheat varieties. J Agric Food Chem. 2003;51:7825–7834.
- Kumari D, Madhujith T, Chandrasekara A. Comparison of phenolic content and antioxidant activities of millet varieties grown in different locations in Sri Lanka. Food Sci Nutr. 2017;5(3):474–485.
- Suriano S, Iannucci A, Codianni P, et al. Phenolic acids profile, nutritional and phytochemical compounds, antioxidant properties in colored barley grown in southern Italy. Food Res Int. 2018;113:221–233.
- Tang Y, Li X, Zhang B, et al. Characterisation of phenolics, betanins and antioxidant activities in seeds of three Chenopodium quinoa Willd genotypes. Food Chem. 2015;166:380–388.
- Adom KK, Liu RH. Antioxidant activity of grains. J Agric Food Chem. 2002;50:6182–6187.
- Bhat FM, Riar CS. Characterizing the pigmented traditional rice cultivars grown in temperate regions of Kashmir (India) for free and bound phenolics compounds and in vitro antioxidant properties. J Cereal Sci. 2017;76:253–262.
- Pang Y, Ahmed S, Xu Y, et al. Bound phenolic compounds and antioxidant properties of whole grain and bran of white, red and black rice. Food Chem. 2018;240:212–221.
- Hemalatha P, Bomzan DP, Sathyendra RBV, et al. Distribution of phenolic antioxidants in whole and milled fractions of quinoa and their inhibitory effects on alpha-amylase and alpha-glucosidase activities. Food Chem. 2016;199:330–338.
- Tang Y, Zhang B, Li X, et al. Bound Phenolics of quinoa seeds released by acid, alkaline, and enzymatic treatments and their antioxidant and alpha-glucosidase and pancreatic lipase inhibitory effects. J Agric Food Chem. 2016;64(8):1712–1719.
- Woldemichael GM, Wink M. Identification and biological activities of triterpenoid saponins from Chenopodium quinoa. J Agric Food Chem. 2001;49:2327–2332.
- Yao Y, Yang X, Shi Z, et al. Anti-inflammatory activity of saponins from quinoa (Chenopodium quinoa Willd.) seeds in lipopolysaccharide-stimulated RAW 264.7 macrophages cells. J Food Sci. 2014;79(5):H1018–1023.
- Gomez-Caravaca AM, Iafelice G, Lavini A, et al. Phenolic compounds and saponins in quinoa samples (Chenopodium quinoa Willd.) grown under different saline and nonsaline irrigation regimens. J Agric Food Chem. 2012;60(18):4620–4627.
- Hiai S, Oura H, Nakajima T. Color reaction of some sapogenins and saponins with vanillin and sulfuric acid. Plant Med. 1976;29:116–122.
- Zhang R, Zeng Q, Deng Y, et al. Phenolic profiles and antioxidant activity of litchi pulp of different cultivars cultivated in Southern China. Food Chem. 2013;136(3–4):1169–1176.
- Chu YF, Sun J, Wu X, et al. Antioxidant and antiproliferative activities of common vegetables. J Agric Food Chem. 2002;50(23):6910–6916.
- Dewanto V, Wu X, Adom KK, et al. Thermal processing enhances the nutritional value of tomatoes by increasing total antioxidant activity. J Agric Food Chem. 2002;50(10):3010–3014.
- Zhao G, Zhang R, Dong L, et al. A comparison of the chemical composition, in vitro bioaccessibility and antioxidant activity of phenolic compounds from rice bran and its dietary fibres. Molecules. 2018;23(1):202–216.
- Liu L, Wen W, Zhang R, et al. Complex enzyme hydrolysis releases antioxidative phenolics from rice bran. Food Chem. 2017;214:1–8.
- Ti H, Li Q, Zhang R, et al. Free and bound phenolic profiles and antioxidant activity of milled fractions of different indica rice varieties cultivated in southern China. Food Chem. 2014;159:166–174.
- Wu NN, Li HH, Tan B, et al. Free and bound phenolic profiles of the bran from different rice varieties and their antioxidant activity and inhibitory effects on ɑ-amylose and ɑ-glucosidase. J Cereal Sci. 2018;82:206–212.
- Lavelli V, Sri HPS, Ferranti P, et al. Grape skin phenolics as inhibitors of mammalian alpha-glucosidase and alpha-amylase–effect of food matrix and processing on efficacy. Food Funct. 2016;7(3):1655–1663.
- Gomez-Caravaca AM, Segura-Carretero A, Fernandez-Gutierrez A, et al. Simultaneous determination of phenolic compounds and saponins in quinoa (Chenopodium quinoa Willd) by a liquid chromatography-diode array detection-electrospray ionization-time-of-flight mass spectrometry methodology. J Agric Food Chem. 2011;59(20):10815–10825.
- Medina-Meza IG, Aluwi NA, Saunders SR, et al. GC-MS Profiling of triterpenoid saponins from 28 quinoa varieties (Chenopodium quinoa Willd.) grown in Washington State. J Agric Food Chem. 2016;64(45):8583–8591.
- Escribano J, Cabanes J, Jimenez-Atienzar M, et al. Characterization of betalains, saponins and antioxidant power in differently colored quinoa (Chenopodium quinoa) varieties. Food Chem. 2017;234:285–294.
- Ainsworth EA, Gillespie KM. Estimation of total phenolic content and other oxidation substrates in plant tissues using Folin–ciocalteu reagent. Nat Protoc. 2007;2:875–877.
- Abderrahim F, Huanatico E, Segura R, et al. Physical features, phenolic compounds, betalains and total antioxidant capacity of coloured quinoa seeds (Chenopodium quinoa Willd.) from peruvian altiplano. Food Chem. 2015;183:83–90.
- Butsat S, Siriamornpun S. Antioxidant capacities and phenolic compounds of the husk, bran and endosperm of Thai rice. Food Chem. 2010;119(2):606–613.
- Chandrasekara A, Shahidi F. Bioactivities and antiradical properties of millet grains and hulls. J Agric Food Chem. 2011;59(17):9563–9571.
- Kroon PA, Faulds CB, Ryden P, et al. Release of covalently bound ferulic acid from fiber in the human colon. J Agric Food Chem. 1997;45(3):661–667.
- Repo-Carrasco-Valencia R, Hellström JK, Pihlava JM, et al. Flavonoids and other phenolic compounds in Andean indigenous grains: quinoa (Chenopodium quinoa), kañiwa (Chenopodium pallidicaule) and kiwicha (Amaranthus caudatus). Food Chem. 2010;120(1):128–133.
- Zhu N, Sheng S, Li D, et al. Antioxidative flavonoid glycosides from quinoa seeds (Chenopodium quinoa Willd.). J Food Lipids. 2001;8(1):37–44.
- Balasundram N, Sundram K, Samman S. Phenolic compounds in plants and agri-industrial by-products: antioxidant activity, occurrence, and potential uses. Food Chem. 2006;99(1):191–203.
- Shahidi F, Zhong Y. Measurement of antioxidant activity. J Funct Food. 2015;18:757–781.
- Nickel J, Spanier LP, Botelho FT, et al. Effect of different types of processing on the total phenolic compound content, antioxidant capacity, and saponin content of Chenopodium quinoa Willd grains. Food Chem. 2016;209:139–143.
- Rocchetti G, Lucini L, Rodriguez JML, et al. Gluten-free flours from cereals, pseudocereals and legumes: phenolic fingerprints and in vitro antioxidant properties. Food Chem. 2019;271:157–164.
- Gallardo C, Jiménez L, García-Conesa MT. Hydroxycinnamic acid composition and in vitro antioxidant activity of selected grain fractions. Food Chem. 2006;99(3):455–463.
- Rocchetti G, Chiodelli G, Giuberti G, et al. Evaluation of phenolic profile and antioxidant capacity in gluten-free flours. Food Chem. 2017;228:367–373.
- Min B, Gu L, McClung AM, et al. Free and bound total phenolic concentrations, antioxidant capacities, and profiles of proanthocyanidins and anthocyanins in whole grain rice (Oryza sativa L.) of different bran colours. Food Chem. 2012;133(3):715–722.
- Lopez-Martinez LX, Oliart-Ros RM, Valerio-Alfaro G, et al. Antioxidant activity, phenolic compounds and anthocyanins content of eighteen strains of Mexican maize. LWT-Food Sci Technol. 2009;42(6):1187–1192.
- Pradeep PM, Sreerama YN. Impact of processing on the phenolic profiles of small millets: evaluation of their antioxidant and enzyme inhibitory properties associated with hyperglycemia. Food Chem. 2015;169:455–463.
- Adisakwattana S, Chantarasinlapin P, Thammarat H, et al. A series of cinnamic acid derivatives and their inhibitory activity on intestinal alpha-glucosidase. J Enzyme Inhib Med Chem. 2009;24(5):1194–1200.
- Yao Y, Sang W, Zhou M, et al. Antioxidant and alpha-glucosidase inhibitory activity of colored grains in China. J Agric Food Chem. 2010;58(2):770–774.
- Jie T, Jun C, Shuyun Z, et al. Inhibition of wheat bran and it’s active compoments on α-glucosidase in vitro. Pharm Mag. 2013;9(36):309–314.