
ABSTRACT
A natural isoquinoline alkaloid, berberine, has been known to exhibit anti-tumor activity in various cancer cells via inducing cell cycle arrest. However, it has not been investigated whether berberine and its analogs inhibit the growth of rhabdomyosarcoma (RMS), which is the most frequent soft tissue tumor in children. The present study examined the anti-tumor effects of berberine and palmatine on expansions of three human embryonal RMS cell lines; ERMS1, KYM1, and RD. Intracellular incorporation of berberine was relatively higher than that of palmatine in every RMS cell line. Berberine significantly inhibited the cell cycle of all RMS cells at G1 phase. On the other hand, palmatine only suppressed the growth of RD cells. Both of berberine and palmatine strongly inhibited the growth of tumorsphere of RD cells in three-dimensional culture. These results indicate that berberine derivatives have the potential of anti-tumor drugs for RMS therapy.
Abbreviations: ARMS: alveolar rhabdomyosarcoma; ERMS: embryonal rhabdomyosarcoma; RMS: rhabdomyosarcoma
Graphical abstract
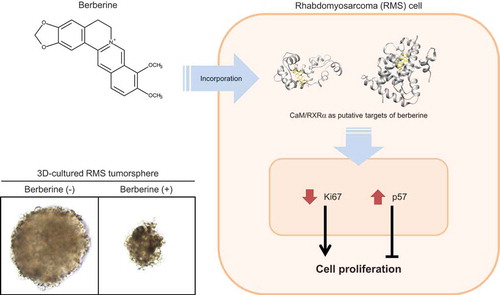
An isoquinoline alkaloid, berberine, inhibits growth of rhabdomyosarcoma cells in three-dimensional culture by modulating cell cycle gene expression.
An isoquinoline alkaloid, berberine, is abundantly involved in several medicinal plants, such as Phellodendron amurense, which has been used as a traditional Chinese herb. Besides berberine, these plants synthesize a series of protoberberine-type alkaloids, such as palmatine, coptisine, and jatrorrhizine ()). Numerous studies have reported that berberine derivatives have a wide range of bioactivities including anti-bacterial, anti-diabetic, anti-inflammatory, anti-oxidative, cardiovascular protective, and neuroprotective effects [Citation1]. Especially, the anti-tumor activities of berberine have been shown because it potentially overcomes drug resistance in combination with clinical chemotherapy [Citation2]. Berberine induces cell cycle arrests or apoptosis of prostate carcinoma [Citation3], bladder cancer [Citation4], lung tumor [Citation5], colon cancer [Citation6], and hepatoma [Citation7]. Berberine has been reported to arrest cell cycle not only in cancers but also in sarcomas, such as osteosarcoma [Citation8] and chondrosarcoma [Citation9]. However, the effects of berberine and its analogs on rhabdomyosarcoma (RMS) have not been studied yet.
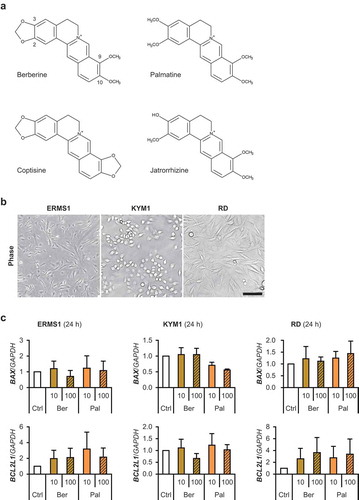
Figure 1. Berberine derivatives and human RMS cells.
(a) The structural formula of berberine derivatives. (b) 2D-cultured human RMS cells. Scale bar, 100 μm. (c) qPCR results of gene expression in RMS cells treated with 10 or 100 μM of berberine or palmatine for 24 h. The mean value in control RMS cells was set at 1.0 for each gene. There was no significant difference among samples in any RMS cells (Scheffe’s F test). n = 3.
RMS is the most frequent soft tissue tumor in children but rarely develops in adults. RMS is formed in soft tissues including striated muscles, and is considered to be derived from several muscular lineages, such as mesenchymal stem cells, myogenic precursor cells, or myoblasts [Citation10]. RMS is classified into two subtypes, alveolar RMS (ARMS) and embryonal RMS (ERMS). ARMS is malignant and mostly occurs in the extremities of adolescents and young adults. 80% of ARMS has the chromosomal translocation t(2;13)(q35;q14) or t(1;13)(p36;q14), which generates chimeric gene PAX3-FOXO1 or PAX7-FOXO1, respectively [Citation10–Citation12]. Therefore, gene therapy is considered to be a relevant strategy for ARMS. However, around 70% of childhood RMS is ERMS, which has a variety of chromosomal abnormalities and can arise from every stage of muscle development [Citation13]. At present, a combination of chemotherapy, surgery, and/or radiation has become the standard treatment for RMS. Although the 5-year survival rate of RMS has increased up to 60% in the 2000s [Citation14], the oncological outcome of RMS patients has not been conspicuously improved in recent years because of drug resistance and metastatic diseases [Citation10]. Development of effective and safe agents for RMS therapy is thus urgently required.
The present study investigated the inhibitory actions of berberine and palmatine on the growth of three ERMS cell lines, ERMS1, KYM1, and RD ()). We further tested berberine and palmatine for RMS tumorspheres in three-dimensional (3D) culture to evaluate their activities in a condition similar to tumorigenesis.
Materials and methods
Compounds
Berberine hydrochloride (Nacalai, Osaka, Japan) and palmatine chloride hydrate (Nacalai) were dissolved in sterile water. In experiments of berberine or palmatine, an equal volume of sterile water instead of the test sample served as a negative control.
RMS cells
Human RMS cells were provided by JCRB Cell Bank (National Institutes of Biomedical Innovation, Health and Nutrition, Osaka, Japan). ERMS1 cells (JCRB1648) were derived from an anaplastic pelvic ERMS of a 5-year-old female [Citation15]. KYM1 cell strain (JCRB0627) was established from a neck tumor in a 9-month-old infant [Citation16]. RD cells (JCRB9072) were directly derived from the biopsy specimens of a malignant pelvic ERMS of a 7-year-old female patient [Citation17]. All RMS cells were cultured in RPMI1640 (Nacalai) with 10% fetal bovine serum (HyClone; GE Healthcare, UT, USA), 100 units/ml penicillin, and 100 μg/ml streptomycin at 37°C with 5% CO2.
Cell counting
5.0 × 10⁴ RMS cells/well were seeded on 12-well (ERMS1 and RD) or 24-well (KYM1) plates. On the next day, the cells were treated by replacing the medium with a brand-new medium containing berberine or palmatine. The cells were continuously cultured until their numbers were counted. For cell counting, the cells were completely dissociated by treating with 0.25% trypsin with 1 mM EDTA (Wako, Osaka, Japan) for 5 min at 37°C. The number of cells was counted using a hemocytometer.
Cell cycle assay
2.0 × 10⁵ (ERMS1 and RD) or 4.0 × 10⁵ (KYM1) cells/well were seeded on 12-well plate. On the next day, the cells were treated by replacing the medium with a brand-new medium containing 10 μM of berberine or palmatine. After 24 h, the cell cycle phases were visualized using Cell-Clock Cell Cycle Assay Kit (Biocolor Life Science Assays, County Antrim, UK). The ratio of the cells at each phase was counted using ImageJ software (National Institute of Health, USA).
Fluorescent microscopy
Intracellular incorporation of berberine or palmatine was detected as green fluorescence because berberine and palmatine have fluorescence emissions at 530 nm upon excitations [Citation18,Citation19]. Phase-contrast and fluorescent images were taken and layered using EVOS FL Auto microscope with an emission bandpass filter of 510–542 nm (AMAFD1000; Thermo Fisher Scientific, MA, USA).
Quantitative real-time RT-PCR (qPCR)
For 2D culture, 1.5 × 10⁵ (ERMS1 and RD) or 2.0 × 10⁵ (KYM1) cells were seeded on 30-mm dishes. On the next day, the cells were treated by replacing the medium with a brand-new medium containing 10 μM of berberine or palmatine. After 48 h (KYM1) or 72 h (ERMS1 and RD), the total RNA from the RMS cells was isolated using TRIzol Reagent (Thermo Fisher Scientific) and reverse transcribed using ReverTra Ace qPCR RT Master Mix (TOYOBO, Osaka, Japan). For 3D culture, the RD tumorspheres at day 6 formed as described below were subjected to RNA preparation. qPCR was performed using GoTaq qPCR Master Mix (Promega, WI, USA) with StepOne Real-Time PCR System (Thermo Fisher Scientific). The amount of each transcript was normalized to that of GAPDH. The results are presented as fold-change. Primer sequences are described in .
Table 1. Primer sequences for qPCR.
Western blotting
8.0 × 10⁵ ERMS1 cells were seeded on 100-mm dishes. The cells were treated with 10 μM of berberine or palmatine for 72 h. The whole cell lysate from the cells was harvested using lysis buffer (100 mM Tris-HCl, 75 mM NaCl, and 1% Triton-X100) with protease inhibitors (1 mM 4-(2-aminoethyl)benzenesulfonyl fluoride hydrochloride, 0.8 μM aprotinin, 15 μM E-64, 20 μM leupeptin hemisulfate monohydrate, 50 μM bestatin, and 10 μM pepstatin A) (Nacalai). Then the lysates were denatured with 50 mM Tris-HCl, 10% glycerol, and 2% sodium dodecyl sulfate (SDS) at 95°C for 5 min. 20 μg of protein samples were subjected to SDS-polyacrylamide gel electrophoresis and following Western blotting using iBlot 2 Dry Blotting System (Thermo Fisher Scientific). Rabbit polyclonal anti-p57Kip2 (Cell Signaling Technology) (1:1000) and mouse monoclonal anti-GAPDH (5A12; Wako) (1:1000) antibodies were used as primary antibodies. 0.1 ng/ml of horseradish peroxidase (HRP)-conjugated goat anti-rabbit and anti-mouse IgG antibodies (Jackson ImmunoResearch, PA, USA) were used as secondary antibodies, respectively. HRP signal was detected using ECL Prime reagents and ImageQuant LAS 500 (GE Healthcare). The amounts of p57Kip2 was normalized to those of GAPDH using ImageJ software.
3D culture of RD tumorspheres
The RD cells were dissociated and suspended in 3D Tumorsphere Medium XF (PromoCell, Heidelberg, Germany). 300 cells/30 μl of drops were placed on 24-well floating-culture plates (Sumitomo Bakelite, Tokyo, Japan). Subsequently, the plates were turned over for hanging-drop culture. After 3 days, the plates were turned over again, then 300 μl/well of 3D Tumorsphere Medium XF with 10 μM of berberine or palmatine was added to RD tumorspheres (defined as day 0). RD tumorspheres were maintained without medium exchange. Phase-contrast images of the tumorspheres were taken using EVOS FL Auto microscope. The projected areas of the tumorspheres were quantified using ImageJ software.
Molecular docking simulation
Molecular models of berberine and palmatine were built by gaussian 09 (Gaussian, CT, USA) and antechamber [Citation25]. The force fields except for the partial charges were taken from a general amber force field (GAFF) [Citation26]. The partial charges on the molecules were assigned by a restrained electrostatic potential (RESP) method based on the conformations after quantum-mechanics structural optimization with B3LYP/6-31G*. These molecular models of berberine and palmatine were used for the following docking simulation. The docking simulation was conducted for berberine or palmatine onto calmodulin. The structures of calmodulin and receptor retinoid X receptor α ligand-binding domain (RXRα-LBD) were taken from the D chain of PDB ID 1K90 and 3OAP, respectively. The amber force field, ff99 [Citation27], was used for the protein model. We used the docking software Sievgene [Citation28]. The docking pose with the lowest docking score was stored. Finally, each complex structure of berberine and palmatine docking upon calmodulin was obtained.
Statistical analysis
The results are presented as the mean ± standard error. Statistical comparisons were performed using multiple comparison test with Williams’ test or Scheffe’s F test, where appropriate following one-way analysis of variance (ANOVA). Statistical significance was set at a p value < 0.05.
Results
Berberine but not palmatine inhibits the growth of ERMS1 cells
ERMS1 is an ERMS cell line having c.743G>T mutation on TP53 gene [Citation15]. The ERMS1 cells showed spindle or polygonal shape in the two-dimensional (2D) monolayer culture ()). First, apoptotic effects of berberine and palmatine on ERMS1 cells were examined. qPCR results indicated that mRNA levels of a apoptosis-inducing gene, Bax (BAX), and an anti-apoptotic factor, Bcl-xL (BCL2L1), were not altered within 24 h even by 100 μM of berberine or palmatine ()). Then, the effects of berberine and palmatine at lower concentrations on cell cycle were investigated. The number of ERMS1 cells treated with 1, 3, or 10 μM of berberine was counted every 24 h as an index of cell growth ()). Berberine suppressed ERMS1 cell growth in a dose-dependent manner. Berberine at concentration of 3 and 10 μM significantly reduced the number of ERMS1 cells at 72 h of treatment. Even 1 μM of berberine suppressed the growth by 96 h. However, 10 μM of palmatine did not show any growth inhibition on ERMS1 cells ()). Microscopic observation also displayed a berberine-dependent reduction of the ERMS1 cell number. There was no other obvious alteration, such as morphological change or cell death by berberine or palmatine ()). Cell cycle phases of the live ERMS1 cells treated by 10 μM of berberine or palmatine were monitored using the redox dye which stains mitotic cells at M phase in dark blue, pre-mitotic cells at S/G2 phase in green, and non-mitotic cells G1 phase in pale yellow. After 24 h of treatment, berberine but not palmatine dramatically increased the cells at G1 phase and inhibited to enter into S/G2 phase ()). It clearly indicated that berberine induces G1 cell cycle arrest in ERMS1 cells. The uptake of berberine or palmatine into ERMS1 cells was detected by the green fluorescence generated by berberine or palmatine ()). Berberine was incorporated into the ERMS1 cells within 24 h. Palmatine incorporation was similarly detected, but the intensity of the fluorescence was lower than that of berberine. It may be one of the reasons why the growth inhibitory effects of palmatine was relatively weaker than that of berberine.
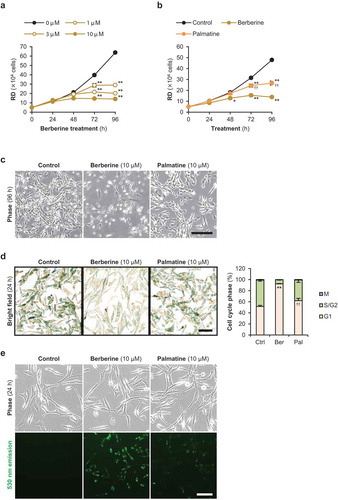
Figure 2. Effects of berberine and palmatine on ERMS1 cell growth.
(a) The number of ERMS1 cells treated with 1, 3, or 10 μM of berberine. * p < 0.05, ** p < 0.01 vs 0 μM at each time point (Williams’ test). n = 3. (b) The number of ERMS1 cells treated with 10 μM of berberine or palmatine. ** p < 0.01 vs control at each time point (Scheffe’s F test). n = 5. (c) Representative images of ERMS1 cells treated with 10 μM of berberine or palmatine for 96 h. Scale bar, 250 μm. (d) Representative images and the ratio of cell cycle phases of ERMS1 cells treated with 10 μM of berberine or palmatine for 24 h. Scale bar, 100 μm. ** p < 0.01 vs control, †† p < 0.01 vs berberine (Scheffe’s F test). n = 4. (e) Incorporation of berberine or palmatine into ERMS1 cells as 530 nm emission at 24 h after treatment at a concentration of 10 μM. Scale bar, 100 μm.
Berberine but not palmatine inhibits the growth of KYM1 cells
The KYM1 cells displayed small lymphocyte-like round shape with mild adhesion to the culture plates in 2D culture ()). Treatment of 100 μM of berberine or palmatine for 24 h did not alter the expression levels of BAX and BCL2L1 in KYM1 cells ()). However, berberine suppressed the growth of KYM1 cells in a dose-dependent manner ()). KYM1 cells were more sensitive to berberine as compared to the ERMS1 cells. The number of KYM1 cells was significantly reduced 48 h after berberine treatment for every dose. In particular, 10 μM of berberine completely arrested KYM1 cell growth. However, 10 μM of palmatine did not inhibit the expansion of KYM1 cells ()). In microscopic observation, the confluent KYM1 cells were attached to the culture plates tightly, but the berberine-treated KYM1 cells maintained the globular morphology probably because of the low-density of the cells ()). Cell cycle assays clearly showed that KYM1 cells were significantly arrested at G1 phase by berberine but not by palmatine ())). Berberine was incorporated into the KYM1 cells within 24 h, whereas palmatine was scarcely detected inside the cells ()).
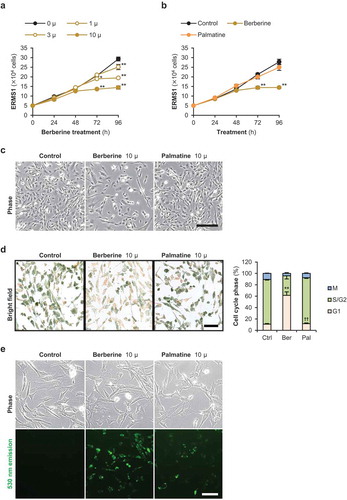
Figure 3. Effects of berberine and palmatine on KYM1 cell growth.
(a) The number of KYM1 cells treated with 1, 3, or 10 μM of berberine. * p < 0.05, ** p < 0.01 vs 0 μM at each time point (Williams’ test). n = 4. (b) The number of KYM1 cells treated with 10 μM of berberine or palmatine. ** p < 0.01 vs control at each time point (Scheffe’s F test). n = 4. (c) Representative images of KYM1 cells treated with 10 μM of berberine or palmatine for 72 h. Scale bar, 250 μm. (d) Representative images and the ratio of cell cycle phases of KYM1 cells treated with 10 μM of berberine or palmatine for 24 h. Scale bar, 100 μm. ** p < 0.01 vs control, †† p < 0.01 vs berberine (Scheffe’s F test). n = 4. (e) Incorporation of berberine or palmatine into KYM1 cells as 530 nm emission at 24 h after treatment at a concentration of 10 μM. Scale bar, 100 μm.
Berberine and palmatine inhibit the growth of RD cells
RD is a malignant ERMS cell strain having amplification of the MYC gene, p.Gln61His mutation on the NRAS gene, and c.248C>T homozygous mutation on the TP53 gene [Citation29–Citation31] ()). Although berberine and palmatine did not affect apoptotic gene expression ()), berberine inhibited the outgrowth of RD cells in a dose-dependent manner ()). The sensitivity of the RD cells to berberine was moderate; it significantly reduced the number of RD cells at 72 h after treatment in every dose. Intriguingly, 10 μM of palmatine markedly suppressed the RD cell growth ()). Although the inhibitory effect of palmatine was milder than that of berberine at the same dose, a reduced number of palmatine-treated cells was also observed by microscopy ()). In the berberine-treated RD cells, atrophic morphology was observed in addition to growth inhibition. 10 μM of berberine but not of palmatine rapidly induced G1 cell cycle arrest in RD cells within 24 h ()). Green fluorescent images indicated that both berberine and palmatine were incorporated into the RD cells within 24 h ()). As observed in the ERMS1 and KYM1 cells, the uptake of palmatine into the RD cells was fewer than that of berberine. These differences between berberine and palmatine at early stage of the treatment would be involved in their disparities of growth inhibitory effects.
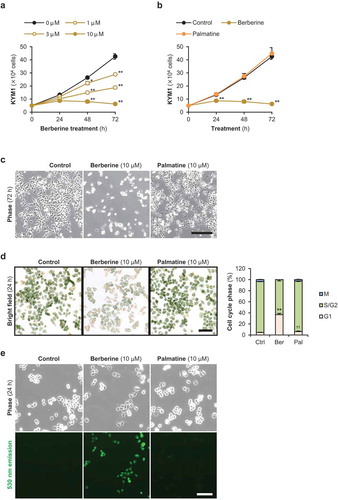
Figure 4. Effects of berberine and palmatine on RD cell growth.
(a) The number of RD cells treated with 1, 3, or 10 μM of berberine. ** p < 0.01 vs 0 μM at each time point (Williams’ test). n = 3. (b) The number of RD cells treated with 10 μM of berberine or palmatine. * p < 0.05 vs control, ** p < 0.01 vs control, †† p < 0.01 vs berberine at each time point (Scheffe’s F test). n = 4. (c) Representative images of RD cells treated with 10 μM of berberine or palmatine for 96 h. Scale bar, 250 μm. (d) Representative images and the ratio of cell cycle phases of RD cells treated with 10 μM of berberine or palmatine for 24 h. Scale bar, 100 μm. ** p < 0.01 vs control, †† p < 0.01 vs berberine (Scheffe’s F test). n = 4. (e) Incorporation of berberine or palmatine into RD cells as 530 nm emission at 24 h after treatment at a concentration of 10 μM. Scale bar, 100 μm.
Berberine modulates cyclin-related gene expression in the RMS cells
qPCR quantified the expression of proliferation marker Ki-67 (MKI67) and G1 phase-involved genes, cyclin D1 (CCND1) and cyclin-dependent kinase inhibitor 1C (p57Kip2) (CDKN1C), in the berberine- or palmatine-treated RMS cells ()). As well as the results of cell cycle assays, MKI67 levels were significantly decreased by berberine in KYM1 and RD cells. Berberine did not alter CCND1 levels in any RMS cells. While, by berberine treatment, CDKN1C levels were significantly upregulated in ERMS1 cells and tended to be induced in RD cells. Accordingly, protein level of p57Kip2 was markedly increased in the berberine-treated ERMS1 cells ()). On the other hand, expression levels of MKI67, CCND1, and CDKN1C were not altered at all by palmatine in any RMS cells. Both berberine and palmatine did not affect mRNA levels of BAX and BCL2L1. These data demonstrate that berberine inhibits RMS cell growth, in part, by modulating cell cycle-related gene expression.
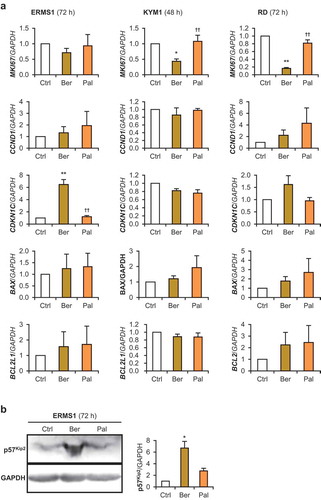
Figure 5.. Berberine inhibits cell cycle gene expression in RMS cells.
(a) qPCR results of gene expression in RMS cells treated with 10 μM of berberine or palmatine for 48 h (KYM1) or 72 h (ERMS1 and RD). The mean value in control RMS cells was set at 1.0 for each gene. * p < 0.05 vs control, ** p < 0.01 vs control, †† p < 0.01 vs berberine (Scheffe’s F test). n = 3–5. (b) Representative images of Western blotting and the quantified p57Kip2 protein levels in the ERMS1 cells treated with 10 μM of berberine or palmatine for 72 h. * p < 0.05 vs control (Scheffe’s F test). n = 3.
Berberine and palmatine inhibit the growth of 3d-cultured RD tumorspheres
To examine the effects of berberine analogs on the growth of tumorspheres in a xeno-free condition, we tried to establish a novel 3D culture method for RMS cells. To form initial aggregation, the drops containing 300 RD cells were subjected to hanging-drop culture for 3 days. The spheres formed in the drops (defined as day 0) were subsequently maintained in floating culture. These RD tumorspheres continued to grow at least for 12 days without medium exchange, and finally their diameters reached 0.5–1.0 mm ()). Although both berberine and palmatine were uptaken into RD tumorspheres within 24 h ()), incorporation of palmatine was fewer than that of berberine as observed in 2D culture ()). It demonstrates that this 3D culture system is applicable to investigate the effects of anti-tumor drugs. The growth ratio of the RD tumorspheres treated with 10 μM of berberine or palmatine was quantified as to their projected areas (). Both berberine and palmatine completely inhibited the growth of the spheres for 10 days without medium exchange. The projected areas were not different between berberine- and palmatine-treated tumorspheres. It is not corresponded to the results of 2D culture indicating that the inhibitory effect of palmatine was weaker than that of berberine ()). As shown in ), MKI67 expression in RD tumorspheres was significantly reduced by berberine but not by palmatine. Confusingly, palmatine treatment decreased the mRNA level of CDKN1C. Expression levels of BAX and BCL2L1 were not altered by berberine nor palmatine. These data suggests that palmatine did not arrest cell cycle and not induce apoptosis in 3D-cultured RD tumorsphere as well in 2D-cultured RD cells. These results demonstrate that berberine and palmatine were able to serve as growth inhibitors for RMS tumors but their mechanism of actions will be different.
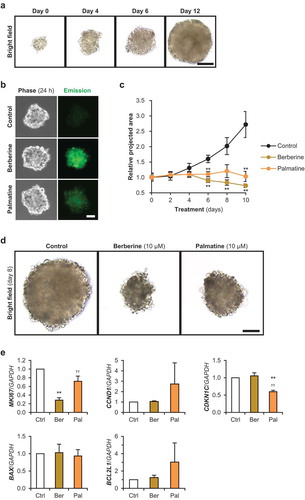
Figure 6. Effects of berberine and palmatine on RD tumorspheres.
(a) The growth of 3D-cultured RD tumorsphere. Scale bar, 200 μm. (b) Incorporation of berberine or palmatine into RD tumorspheres as 530 nm emission at 24 h after treatment at a concentration of 10 μM. Scale bar, 50 μm. (c) Projected areas of the RD tumorspheres treated with 10 μM of berberine or palmatine. The mean value of the control tumorspheres on day 0 was set at 1.0. ** p < 0.01 vs control (Scheffe’s F test). n = 4–8. (d) Representative images of the RD tumorspheres treated with 10 μM of berberine or palmatine for 8 days. Scale bar, 100 μm. (e) qPCR results of gene expression in RD tumorspheres treated with 10 μM of berberine or palmatine for 6 days. ** p < 0.01 vs control, †† p < 0.01 vs berberine (Scheffe’s F test). n = 3.
Discussion
This is the first study to report that berberine inhibits the growth of multiple ERMS cell lines; ERMS1, KYM1, and RD. Palmatine also suppressed the expansion of RD cells but not that of ERMS1 and KYM1 cells. Distinct effects between berberine and palmatine suggest that it is possible to develop more effective anti-tumor molecules through modifications of berberine. It has been reported that protoberberine-type alkaloids, such as palmatine, coptisine, and jatrorrhizine, exhibit similar bioactivities to berberine [Citation1]. Previous studies have reported the growth inhibitory effect of palmatine on prostate cancer [Citation32], that of coptisine on lung cancer [Citation33], and that of jatrorrhizine on melanoma cells [Citation34]. However, these actions of berberine analogs have not been directly compared. Precise differences of the anti-tumor effects among the berberine derivatives should be evaluated in further studies which will contribute to identifying the most effective molecule for each tumor.
Berberine analogs are water-soluble and cell-permeable small alkaloids (molecular weights; ~350). According to the results of absorption, distribution, metabolism, and excretion (ADME) parameter prediction [Citation35], there is not much difference between the consensus values of n-octanol/water partition coefficient (Consensus Log Po/w) of berberine (2.55) and palmatine (2.64). It suggests that berberine and palmatine have the same cell membrane permeability. However, this study showed that intracellular incorporation of palmatine was lower than that of berberine in every RMS cell line. Correspondingly, it has been reported that intracellular concentrations of palmatine is around one-sixth compared to that of berberine in the colon cancer Caco2 cells treated with 10 μM of berberine or palmatine for 1 h. Their intracellular amounts were significantly increased by the inhibitors of P-glycoprotein (P-gp) which is a member of ATP-binding cassette (ABC) transporter family [Citation36]. These data demonstrates that berberine analogs are P-gp substrates, and their different affinities to P-gp may affect ABC transporter-mediated uptake.
Cell cycle assays and MKI67 expression analyses clearly indicated that berberine treatment induces cell cycle arrest at G1 phase in every RMS cell line as observed in the other types of cells [Citation37]. Previous studies reported that berberine suppresses CCND1 in cholangiocarcinoma [Citation38] and hepatoma [Citation39], or induces CDKN1C in human mesenchymal stem cells [Citation40]. Berberine did not decrease CCND1 mRNA in any RMS cells but actually upregulated CDKN1C mRNA and p57Kip2 protein in ERMS1 cells. These results demonstrate that berberine inhibits RMS cell growth, in part, by inducing G1 cell cycle arrest.
Some molecules have been reported as the direct intracellular targets of berberine. A previous study performed computational screening and identified calmodulin, a Ca2+-binding protein, as a putative target of berberine [Citation7]. It has been reported that inhibition of calmodulin induces G1 cell cycle arrest in cancer cells [Citation41]. Indeed, berberine-induced G1 arrest in hepatoma cells was enhanced by cotreatment of calmodulin inhibitors [Citation7]. Our docking simulation also illustrated that berberine can fit into the pocket of the calmodulin structure ()). Similarly, palmatine fits within the same pocket of calmodulin with a binding score equal to that of berberine (ΔG = −6.7 kcal/mol) ()). However, the interactive positions relative to calmodulin are different between berberine and palmatine.
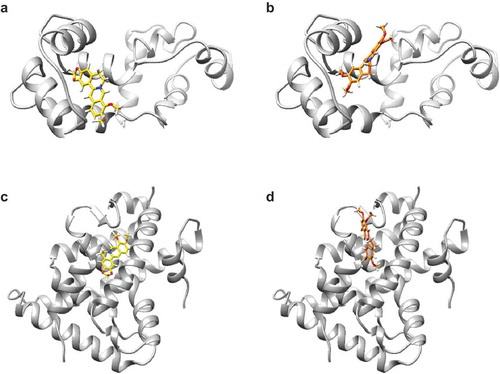
Figure 7. The simulated binding poses of berberine and palmatine on their target proteins.
(a,b) Molecular interactions between calmodulin and berberine analogs. The structures of calmodulin, berberine, and palmatine are colored in gray, yellow, and orange, respectively. (a) The methylenedioxybenzene moiety of berberine is buried in the pocket of calmodulin. (b) The dimethoxybenzene moiety of palmatine interacts with the same pocket as that of berberine. The isoquinoline moiety of palmatine is flipped relative to that of berberine in their bound forms. (c,d) Molecular interactions between RXRα-LBD and berberine analogs. The structures of RXRα-LBD, berberine, and palmatine are colored in gray, yellow, and orange, respectively. (c) Berberine binds to a pocket of RXRα in the vicinity of the other binding pocket for the genuine RXRα ligand. (d) Palmatine attaches to the same pocket that berberine does. The binding pose of palmatine is different from that of berberine.
Other study reported that berberine directly targets nuclear RXRα to promote interaction with β-catenin, which finally leads cell cycle arrest of colon cancer cells [Citation42]. Our docking simulation predicted that both berberine and palmatine can bind to RXRα-LBD with high affinities; the binding scores of berberine and palmatine are −9.6 and −8.0 kcal/mol, respectively. However, their binding poses on RXRα-LBD are different (). Their structural properties of binding poses affect the conformation of RXRα, which may be involved in RXRα activation toward β-catenin degradation.
These findings provide the viewpoint that structural and binding differences of berberine derivatives on their target proteins are closely related to their incorporations and anti-tumor effects. Thus, screening of natural or synthesized berberine derivatives will be a powerful strategy to develop novel RMS inhibitors for tailored chemotherapy. For this purpose, we tried to establish a xeno-free 3D culture method for RMS cells to evaluate the growth inhibitory effects of the drugs. Two recent studies have described the 3D culture systems for RMS cells based on cell sheet or collagen disk technology [Citation43,Citation44]. However, it has not been reported the formation of RMS tumorspheres in floating culture. It is generally considered that sphere culture selectively exploits inherent characters of stem cells including cancer stem cells [Citation45]. The present study successfully generated tumorspheres of RD cells by a hanging drop-based floating culture, which is a convenient and reproducible system to continuously evaluate the growth of RMS cells and the effects of their inhibitors in 3D condition for more than ten days. Using this system, we confirmed that both berberine and palmatine intensively inhibited the expansion of RD tumorspheres. It proves that our 3D culture is conceptually valid for drug screening. Incorporation of palmatine into RD tumorspheres was relatively lower than that of berberine as into the 2D-cultured RD cells. Although palmatine did not arrest cell cycle or not induce apoptosis, palmatine completely inhibited the growth of RD tumorspheres as berberine did. A recent study reported that palmatine inhibits reciprocal interaction between pancreatic stellate cells and cancer cells through suppressing activation of type 1 collagen, which is one of the components of tumor microenvironment [Citation46]. Dense intercellular interaction within the tumor microenvironment is essential for tumor cell survival and growth. As in pancreatic cells, palmatine might decrease collagen accumulation, interfere extracellular matrix formation, and finally inhibit growth of RD tumorspheres. It will be a possible mechanism that palmatine showed graded growth inhibitory effects among RMS cell lines or between 2D and 3D culture systems.
Growing evidences have been showing that the 2D-cultured cells deviate from physiological responses under some circumstances by its own cell bioactivities. 3D culture systems are considered to be better to mimic in vivo condition [Citation45]. In our study, sensitivities of palmatine to RD cells were actually differ between 2D and 3D culture systems. Establishing robust 3D culture methods for screening will contribute to explore the molecules which have appropriate drug efficacies in vivo. Unfortunately, tumorspheres of ERMS1 and KYM1 cells have not been formed yet. The culture system should be optimized and improved to apply the method to various sarcoma cells. Reconstruction of the tumor microenvironment will be essentially important to recapitulate the actions of anti-tumor molecules, such as berberine analogs in vitro.
Author contributions
TT designed the study. TT and KU wrote the manuscript. SS, SN, and YN performed the experiments. KU performed the docking simulation. All authors have read and approved the final manuscript.
Disclosure statement
No potential conflict of interest was reported by the authors.
Additional information
Funding
References
- Meng FC, Wu ZF, Yin ZQ, et al. Coptidis rhizoma and its main bioactive components: recent advances in chemical investigation, quality evaluation and pharmacological activity. Chin Med. 2018;13:13.
- Cheng YT, Yang CC, Shyur LF. Phytomedicine-modulating oxidative stress and the tumor microenvironment for cancer therapy. Pharmacol Res. 2016;114:128–143.
- Mantena SK, Sharma SD, Katiyar SK. Berberine, a natural product, induces G1-phase cell cycle arrest and caspase-3-dependent apoptosis in human prostate carcinoma cells. Mol Cancer Ther. 2006;5:296–308.
- Yan K, Zhang C, Feng J, et al. Induction of G1 cell cycle arrest and apoptosis by berberine in bladder cancer cells. Eur J Pharmacol. 2011;661:1–7.
- James MA, Fu H, Liu Y, et al. Dietary administration of berberine or Phellodendron amurense extract inhibits cell cycle progression and lung tumorigenesis. Mol Carcinog. 2011;50:1–7.
- Chidambara Murthy KN, Jayaprakasha GK, Patil BS. The natural alkaloid berberine targets multiple pathways to induce cell death in cultured human colon cancer cells. Eur J Pharmacol. 2012;688:14–21.
- Ma C, Tang K, Liu Q, et al. Calmodulin as a potential target by which berberine induces cell cycle arrest in human hepatoma Bel7402 cells. Chem Biol Drug Des. 2013;81:775–783.
- Liu Z, Liu Q, Xu B, et al. Berberine induces p53-dependent cell cycle arrest and apoptosis of human osteosarcoma cells by inflicting DNA damage. Mutat Res. 2009;662:75–83.
- Eo SH, Kim JH, Kim SJ. Induction of G2/M arrest by berberine via activation of PI3K/Akt and p38 in human chondrosarcoma cell line. Oncol Res. 2014;22:147–157.
- Sun X, Guo W, Shen JK, et al. Rhabdomyosarcoma: advances in molecular and cellular biology. Sarcoma. 2015;2015:232010.
- Kikuchi K, Tsuchiya K, Otabe O, et al. Effects of PAX3-FKHR on malignant phenotypes in alveolar rhabdomyosarcoma. Biochem Biophys Res Commun. 2008;365:568–574.
- Jothi M, Nishijo K, Keller C, et al. AKT and PAX3-FKHR cooperation enforces myogenic differentiation blockade in alveolar rhabdomyosarcoma cell. Cell Cycle. 2012;11:895–908.
- Rubin BP, Nishijo K, Chen HI, et al. Evidence for an unanticipated relationship between undifferentiated pleomorphic sarcoma and embryonal rhabdomyosarcoma. Cancer Cell. 2011;16:177–191.
- Yang L, Takimoto T, Fujimoto J. Prognostic model for predicting overall survival in children and adolescents with rhabdomyosarcoma. BMC Cancer. 2014;14:654.
- Nishimura R, Takita J, Sato-Otsubo A, et al. Characterization of genetic lesions in rhabdomyosarcoma using a high-density single nucleotide polymorphism array. Cancer Sci. 2013;104:856–864.
- Sekiguchi M, Shiroko Y, Suzuki T, et al. Characterization of a human rhabdomyosarcoma cell strain in tissue culture. Biomed Phamacother. 1985;39:372–380.
- McAllister RM, Melnyk J, Finkelstein JZ, et al. Cultivation in vitro of cells derived from a human rhabdomyosarcoma. Cancer. 1969;24:520–526.
- Guo Y, Chen Y, Wei Y, et al. Label-free fluorescent aptasensor for potassium ion using structure-switching aptamers and berberine. Spectrochim Acta A Mol Biomol Spectrosc. 2015;136:1635–1641.
- Mi R, Tu B, Bai XT, et al. Binding properties of palmatine to DNA: spectroscopic and molecular modeling investigations. Luminescence. 2015;30:1344–1351.
- Lu J, Zhang Q, Tan D, et al. GABA A receptor π subunit promotes apoptosis of HTR-8/SVneo trophoblastic cells: implications in preeclampsia. Int J Mol Med. 2016;38:105–112.
- Yosef R, Pilpel N, Tokarsky-Amiel R, et al. Directed elimination of senescent cells by inhibition of BCL-W and BCL-XL. Nat Commun. 2016;7:11190.
- Kumari S, Puneet, SB P, et al. Cyclin D1 and cyclin E2 are differentially expressed in gastric cancer. Med Oncol. 2016;33:40.
- Ueberberg S, Tannapfel A, Schenker P, et al. Differential expression of cell-cycle regulators in human beta-cells derived from insulinoma tissue. Metabolism. 2016;65:736–746.
- Sharma V, Harafuji N, Belayew A, et al. DUX4 differentially regulates transcriptomes of human rhabdomyosarcoma and mouse C2C12 cells. PLoS One. 2013;8:e64691.
- Wang J, Wang W, Kollman PA, et al. Automatic atom type and bond type perception in molecular mechanical calculations. J Mol Graph Model. 2006;25:247–260.
- Wang J, Wolf RM, Caldwell JW, et al. Development and testing of a general amber force field. J Comput Chem. 2004;25:1157–1174.
- Wang J, Cieplak P, Kollman PA. How well does a restrained electrostatic potential (RESP) model perform in calculating conformational energies of organic and biological molecules? J Comput Chem. 2000;21:1049–1074.
- Fukunishi F, Mikami Y, Nakamura H. Similarities among receptor pockets and among compounds: analysis and application to in silico ligand screening. J Mol Graph Model. 2005;24:34–45.
- Hinson ARP, Jones R, Crose LES, et al. Human rhabdomyosarcoma cell lines for rhabdomyosarcoma research: utility and pitfalls. Front Oncol. 2013;3:183.
- Felix CA, Kappel CC, Mitsudomi T, et al. Frequency and diversity of p53 mutations in childhood rhabdomyosarcoma. Cancer Res. 1992;52:2243–2247.
- Miyachi M, Kakazu N, Yagyu S, et al. Restoration of p53 pathway by nutlin-3 induces cell cycle arrest and apoptosis in human rhabdomyosarcoma cells. Clin Cancer Res. 2009;15:4077–4084.
- Hambright HG, Batth IS, Xie J, et al. Palmatine inhibits growth and invasion in prostate cancer cell: potential role for rpS6/NFκB/FLIP. Mol Carcinog. 2015;54:1227–1234.
- Rao PC, Begum S, Sahai M, et al. Coptisine-induced cell cycle arrest at G2/M phase and reactive oxygen species-dependent mitochondria-mediated apoptosis in non-small-cell lung cancer A549 cells. Tumor Biol. 2017;39:1010428317694565.
- Liu R, Cao Z, Pan Y, et al. Jatrorrhizine hydrochloride inhibits the proliferation and neovascularization of C8161 metastatic melanoma cells. Anticancer Drugs. 2013;24:667–676.
- Daina A, Michielin O, Zoete O. SwissADME: a free web tool to evaluate pharmacokinetics, drug-likeness and medicinal chemistry friendliness of small molecules. Sci Rep. 2017;7:42717.
- Zhang X, Qiu F, Jiang J, et al. Intestinal absorption mechanisms of berberine, palmatine, jateorhizine, and coptisine: involvement of P-glycoprotein. Xenobiotica. 2011;41:290–296.
- Bailon-Moscoso N, Cevallos-Solorzano G, Romero-Benavides JC, et al. Natural compounds as modulators of cell cycle arrest: application for anticancer chemotherapies. Curr Genomics. 2017;18:106–131.
- He W, Wang B, Zhuang Y, et al. Berberine inhibits growth and induces G1 arrest and apoptosis in human cholangiocarcinoma QBC939 cells. J Pharmacol Sci. 2012;119:341–348.
- Wang N, Wang X, Tan HY, et al. Berberine suppresses cyclin D1 expression through proteasomal degradation in human hepatoma cells. Int J Mol Sci. 2016;17:E1899.
- Ke T, Deming X, Jian W, et al. Berberine promotes bone marrow-derived mesenchymal stem cells osteogenic differentiation via canonical Wnt/β-catenin signaling pathway. Toxicol Lett. 2016;240:68–80.
- Shim JS, Lee J, Kim KN, et al. Development of a new Ca2+/calmodulin antagonist and its anti-proliferative activity against cololectal cancer cells. Biochem Biophys Res Commun. 2007;359:747–751.
- Ruan H, Zhan YY, Hou J, et al. Berberine binds RXRα to suppress β-catenin signaling in colon cancer cells. Oncogene. 2017;36:6906–6918.
- Li M, Nagamori E, Kino-oka M. Disruption of myoblast alignment by highly motile rhabdomyosarcoma cell in tissue structure. J Biosci Bioeng. 2017;123:259–264.
- Moghadam AR, Da Silva Rosa SC, Samiei E, et al. Autophagy modulates temozolomide-induced cell death in alveolar rhabdomyosarcoma cells. Cell Death Discov. 2018;4:52.
- He J, Xiong L, Li Q, et al. 3D modeling of cancer stem cell niche. Oncotarget. 2018;9:1326–1345.
- Chakravarthy D, Munoz AR, Su A, et al. Palmatine suppresses glutamine-mediated interaction between pancreatic cancer and stellate cells through simultaneous inhibition of survivin and COL1A1. Cancer Lett. 2018;419:103–115.