
ABSTRACT
Slow skeletal muscle troponin T (TNNT1) has been reported to be correlated with several cancers, but there are no evidences proving that TNNT1 is required in colon adenocarcinoma (COAD). TNNT1 expression in COAD tissues and its prognostic significance were acquired from TCGA database. The proliferative, migratory, and invasive abilities of COAD cells were detected by CCK-8 and transwell assays, respectively. Correlations between TNNT1 and epithelial–mesenchymal transition (EMT)-related markers were determined using western blotting and Pearson’s analysis. Our results stated that TNNT1 expression was high-regulated in COAD tissues, which was related with unfavorable prognosis of COAD patients. Functional analyses suggested that TNNT1 promoted the cellular behaviors. Moreover, aberrant expression of TNNT1 affected the expression level of EMT-related proteins. And TNNT1 was negatively linked with E-cadherin. In conclusion, our findings indicated that TNNT1 may promote the progression of COAD, mediating EMT process, and thus shed a novel light on COAD therapeutic treatments.
Graphical abstract
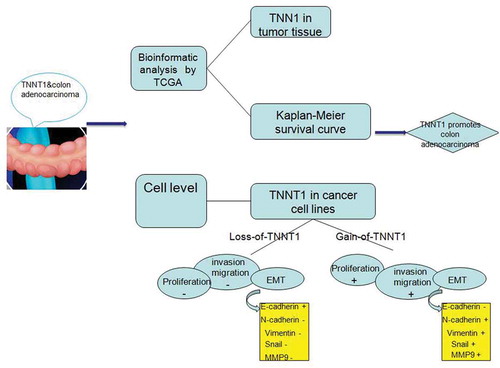
TNNT1 regulated cancer-related cellular behaviors following the elements of EMT process alteration and correlated with prognosis of colon adenocarcinoma patients.
Colorectal cancer (CRC) ranked as the third malignant tumor, which first occurs in large intestine and accounted for about 10% of tumor deaths [Citation1]. It is a leading cause of high cancer incidence in the world [Citation2]. And colon adenocarcinoma (COAD) is a subtype of CRC, which is extremely harmful to human health. Most of the reports demonstrated that the incidence of COAD is mainly attributed to age and dietary habits, partially genetic diseases [Citation3,Citation4]. Although current treatments containing chemotherapy and surgery have improved the survival rate of COAD patients, but the prognosis of patients with COAD still remains poor [Citation5,Citation6]. The use of reliable biomarkers and timely diagnosis of therapeutic targets can significantly improve mortality in COAD patients and reduce the incidence of COAD [Citation7–Citation9]. Therefore, it is urgent to identify novel biomarkers for the treatment of COAD.
Troponin T (TnT), a 30 ~ 35kDa protein including 220 ~ 300 amino acids, has three isoforms: TNNT1, TNNT2 and TNNT3 [Citation10]. They have conserved C-terminal regions but diverse N-terminal regions [Citation11]. Previous evidence suggested that these three homologous expressed in different regions especially, TNNT1 expressed in slow skeletal muscle, TNNT2 expressed in cardiac muscle and TNNT3 expressed in fast skeletal muscle [Citation12]. All the isoforms play important roles in muscle contraction and relaxation by calcium mediation. Besides, a number of analysts have identified common effects of them in the tumorigenesis, for instance, TNNT1 could contribute to cell proliferation in breast cancer [Citation13]; TNNT2 mutation was a cause of dilated cardiomyopathy and TNNT3 was required for cell growth and survival in mice [Citation14,Citation15]; the cell proliferation and migration were associated with TnT according to microarray assay [Citation16]. However, the function of TNNT1 in COAD has not been understood clearly.
To explore the potential effect of TNNT1, we detected the expression level of TNNT1 in COAD tissues and realized that high-regulation of TNNT1 was associated with poor prognosis of COAD patients. Loss-of-function and gain-of-function assays showed that TNNT1 could affect cell behaviors in SW1116 and HT29 cells, including proliferation, migration, and invasion. Aberrant expression of TNNT1 altered the expression of epithelial–mesenchymal transition (EMT)-related factors. Thus, we believed that understanding the functional role of TNNT1 in COAD would make a progress on targeted therapy of tumors.
Materials and methods
Data source
The profiles, derived from TCGA (https://cancergenome.nih.gov/) database including 41 healthy cases and 480 cancer cases, were used to assess the expression level of TNNT1 in COAD tissues.
Cell culture and transfection
Human intestinal fibroblasts (CCD-18Co) cells and COAD cell lines (HCT116, HT29, SW1116, and SW460) were all purchased from American Type Culture Collection (ATCC; Manassas, VA, USA). Cells were incubated in RPMI-1640 medium supplemented with 10% fetal bovine serum (FBS; Thermo Fisher Scientific, Inc., Waltham, MA, USA), 100 U/mL penicillin and 100 µg/mL streptomycin at 37°C and 5% CO2. Before proceeding to the next experiment, log-phase cells digested with trypsin into single-cell suspension.
When a monolayer cell over 80% confluence was generated, transfected experiments started to be implemented. Based on the manufacture’s instructions of Lipofectamine 2000 (Invitrogen; Thermo Fisher Scientific, Inc., Waltham, MA, USA), siRNAs (si-TNNT1#1 and si-TNNT1#2) were transfected into SW1116 cells to reduce the expression of TNNT1 and pcDNA3.1-TNNT1was utilized to increase the TNNT1 expression in HT29 cells. The sequences of siRNAs are as follows: si-TNNT1#1: 5ʹ-CTCTGGACATTGACTACAT-3ʹ, si-TNNT1#2: 5ʹ-GCGTTGACTTCGATGACAT-3ʹ; si-con: 5ʹ-AATTCTCCGAACGTGTCACGT-3ʹ.
RNA extraction and reverse transcription-quantitative polymerase chain reaction (RT-qPCR) analysis
Transfected cells were collected to isolate total RNA using Trizol reagent (Invitrogen; Thermo Fisher Scientific, Inc., Waltham, MA, USA) and then the SuperScript™ III with PlatinumTM Taq High Fidelity DNA polymerase (Invitrogen; Thermo Fisher Scientific, Inc., Waltham, MA, USA) was employed to reversely transcript RNA into cDNA. Then, the FastStart Universal SYBR Green Master (Roche, Basel, Switzerland) with the ABI 7500 system was applied to detect the relative expression of TNNT1. Primers were synthesized as follows: TNNT1: F: 5ʹ-ACATTTCGAGCAGCGGAAGA-3ʹ, R: 5ʹ-CTTCTCCTCCGCCAGCTTAG-3ʹ; GAPDH: F: 5ʹ-TCCAAAATCAAGTGGGGCGA-3ʹ, R: 5ʹ -TGATGACCCTTTTGGCTCCC-3ʹ. The condition of qRT-PCR is that: preheating at 95°C for 5 min, then 95°C for 30 s with 40 cycles, 60°C for 45 s, 72°C for 30 min. Each sample was explored in triple experiments independently. All the data were analyzed through 2−ΔΔCt method.
Cell proliferation assay
The CCK-8 assay was carried out to examine the function of TNNT1 in SW1116 and HT29 cells. Transfected cells for 24 h were seeded into 96 well plates with the seeding density of 1, 000 cells per well. Cell proliferation was measured at a set time point: 0 h, 24 h, 48 h, 72 h. Before detection, 10 µL of CCK-8 reagent was added into each well and cells were incubated at 37°C with 5% CO2 for an additional 2 h. Finally, the microplate reader measured the OD value with 450 nm excitation light and then a proliferation curve was plotted due to the OD values.
Transwell assays
The migratory and invasive capabilities were assessed using transwell chambers (Corning, Cambridge, MA, USA). For transwell invasion assay, the upper surface of transwell chambers was pre-coated with Matrigel (BD Bioscience, USA) and incubated at 37°C for 4 h to form the Matrigel layer. After indicated transfections for 24 h, 5,000 cells (for migration assay) or 1 × 10⁵ cells (for invasion assay) suspended in serum-free medium were seeded into the upper surface of transwell chambers. Five hundred microliters of FBS (10%) medium was put into the lower chamber in both transwell migration and invasion assays. After 24 h incubation, cells that did not migrate or invade through the membranes were removed using cotton swabs, while migrate and invade cells were fixed and stained for 30 min. The representative fields were imaged utilizing a microscope (Olympus, Japan).
Western blot analysis
Total proteins were isolated from transfected cells using RIPA lysate (with protease inhibitor) and concentration of proteins was determined by a BCA kit (Bio-Rad Laboratories Inc., Hercules, CA, USA). Then the equal amount of proteins about 20 μg was resolved in 12% SDS-PAGE, transferred onto PVDF membranes. To get the proteins band, PVDF membranes were cultured in 5% non-fat milk at room temperature for 1 h and blocked at 4°C with corresponding primary antibodies overnight. The primary antibodies contain anti-E-cadherin (1:1,000; Cell Signaling Technology, Danvers, MA, USA), anti-N-cadherin (1:1,000; Cell Signaling Technology, Danvers, MA, USA), anti-vimentin (1:1,000; Cell Signaling Technology, Danvers, MA, USA), anti-Snail (1:1,000; Cell Signaling Technology, Danvers, MA, USA), anti-MMP9 (1:1,000; Cell Signaling Technology, Danvers, MA, USA) and anti-GAPDH (1:1,000; Cell Signaling Technology, Danvers, MA, USA). Washing using TBST, PVDF membranes were incubated using secondary antibodies for 1 h at room temperature. All proteins were normalized to GAPDH. The gray values of proteins were scanned using QUANTITY ONE software independently.
Statistical analysis
Our results were interpreted with GraphPad Prism version 5.0 (GraphPad Software, Inc., La Jolla, CA, USA) and SPSS 22.0 software package (SPSS, Chicago, IL, USA). Kaplan–Meier method with the log-rank test was used to plot the overall survival curve of patients with COAD. Student’s t-test and ANOVA with Dunnett’s post hoc test were conducted to determine the differences in two or more groups. Pearson’s analysis was conducted to determine the correlation among TNNT1 expression and EMT-related genes, and when the absolute value of correlation coefficient > 0.3, the two variables can be considered to be correlated. All data were presented as the mean ± SD with P < 0.05.
Results
High-regulation of TNNT1 in COAD caused poor prognosis
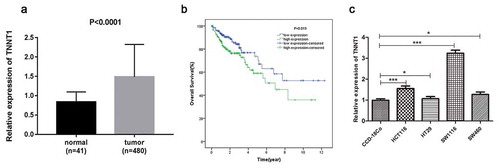
To investigate the function of TNNT1 in COAD, we downloaded the expression profiles from TCGA dataset. The qRT-PCR analysis showed that TNNT1 was highly regulated in COAD tissues (n = 480) when compared with human normal tissues (n = 41, ), P < 0.0001). We further studied the correlation of TNNT1 expression and prognosis of COAD patients. In accordance with the median value of TNNT1 expression, patients were divided into high or low TNNT1 expression group. As shown in ), we found that the group of patients with lower TNNT1 expression revealed a better prognosis than that of the group with higher TNNT1 expression (P = 0.019). Additionally, the expression levels of TNNT2 and TNNT3 in COAD tissues were indicated in Supplementary Figure S1(a,b): TNNT2 was up-regulated while TNNT3 was down-regulated (P < 0.05). Moreover, COAD patients with high TNNT2/TNNT3 expression have a poorer prognosis than that in low TNNT2/TNNT3 expression group (Supplementary Figure S1(c,d)). Subsequently, we examined the mRNA level of TNNT1 in four COAD cell lines and one human normal cell line CCD-18Co by the qRT-PCR method. As seen in ), TNNT1 expression was diverse in COAD cell lines (P < 0.05). In order to perform the subsequent experiments, SW1116 with highest TNNT1 expression and HT29 with lowest TNNT1 expression were selected.
Figure 1. The over-expression of TNNT1 in colon adenocarcinoma caused poor prognosis. (a) TNNT1 was up-regulated in colon adenocarcinoma tissues compared with human normal tissues. (b) The overall survival curve of patients with colon adenocarcinoma. (c) TNNT1 expression level in different cell lines through qRT-PCR method. The experiments were performed in three times and *P < 0.05, ***P < 0.001.
Knockdown of TNNT1 inhibited proliferation, migration, and invasion of SW1116 cells
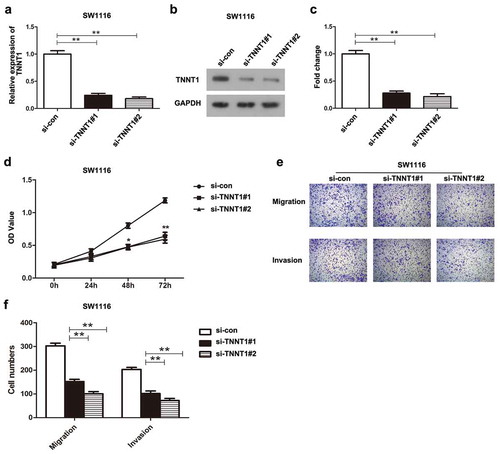
Transfection of si-TNNT1#1 and si-TNNT1#2 in SW1116 cells successfully induced the down-regulation of TNNT1, which was verified by qRT-PCR analysis and western blot (–), P < 0.01). Next, the effects of TNNT1 knockdown were assessed using CCK-8 assay and transwell migration and invasion assays. According to the result of CCK-8 assay, we found that the proliferative ability of SW1116 cells transfected with si-TNNT1#1 and si-TNNT1#2 was significantly suppressed compared to the si-con group. The obvious difference was observed particularly at 48 h and 72 h (), P < 0.05). Results of transwell assays suggested that the migratory and invasive potentials in si-TNNT1#1/si-TNNT1#2 groups were noticeably inhibited compared with a si-con group ()). Moreover, the number of migratory and invasive cells in ) exhibited the consistent results (P < 0.01). Taken together, these findings indicated that the down-regulation of TNNT1 repressed the cell proliferation, migration, and invasion in SW1116 cells.
Figure 2. Knockdown of TNNT1 inhibited proliferation, migration and invasion of SW1116 cells.
(a) The expression of TNNT1 was dramatically decreased after si-TNNT1#1/si-TNNT1#2 transfection using qRT-PCR analysis. (b) The protein expression of TNNT1 was impaired by si-TNNT1#1/si-TNNT1#2 compared with si-con group and (c) quantified. (d) The proliferative ability was examined by CCK-8 assay. (e) and (f) Cell migration and invasion were exhibited and the cell numbers were quantified. *P < 0.05 and **P < 0.01.
Overexpression of TNNT1 promoted the proliferative, migratory, and invasive abilities of HT29 cells
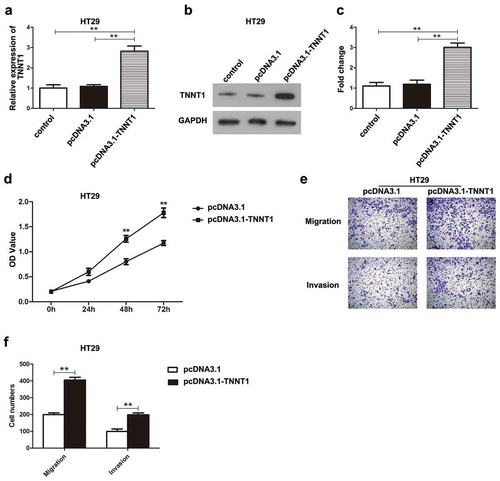
The transfection efficiency of pcDNA3.1-TNNT1 was assessed using qRT-PCR and western blotting assays. HT29 cells transfected with pcDNA3.1-TNNT1 showed a notably up-regulation of TNNT1 (–), P < 0.01). CCK-8 assay suggested that overexpression of TNNT1 had a promoting influence on the cell proliferation in HT29 cells compared with that in pcDNA3.1 empty vector group (), P < 0.01). Transwell migration and invasion analyses showed that high-regulation of TNNT1 remarkably elevated the cell migration and invasion of HT29 cells in contrast to those in pcDNA3.1 empty vector group (,)), P < 0.01). Therefore, overexpression of TNNT1 could promote the malignant behaviors of HT29 cells.
Figure 3. Overexpression of TNNT1 promoted the proliferative, migratory and invasive abilities of HT29 cells. (a) The expression of TNNT1 was significantly increased after pcDNA3.1-TNNT1 transfection by qRT-PCR analysis. (b) The protein expression of TNNT1 was up-regulated compared with control and pcDNA3.1 empty vector groups and (c) quantified. (d) The proliferative ability was detected by CCK-8 assay. (e) and (f) Cell migration and invasion were shown utilizing transwell assays and the cell numbers were quantified. **P < 0.01.
TNNT1 affected the expressions of EMT-related proteins in COAD cells
EMT process plays an important role on tumorigenesis. To further explore the correlating molecular mechanism, we made a thorough inquiry in EMT process. As shown in ), knockdown of TNNT1 was regarded as an inducer in E-cadherin protein level while played a suppressive role on N-cadherin, Vimentin, Snail, and MMP9 proteins expressions. On the basis of bar chart, the expression level of E-cadherin in si-TNNT1#2 group was three times higher than that of the si-con group (), P < 0.01). By the contrast, the N-cadherin, Vimentin, Snail and MMP9 were reduced by two-fold change approximately (), P < 0.01). On the other hand, TNNT1 overexpression significantly decreased the E-cadherin expression and increased the expression of N-cadherin and Vimentin in pcDNA3.1-TNNT1 group (,), P < 0.01). These findings stated that TNNT1 may have a regulatory effect on the EMT process in COAD. Additionally, the correlation among TNNT1 and EMT-related markers were performed by Pearson’s analyses (Supplementary Figure 2S, P < 0.05, | r | > 0.3). The analysis showed that TNNT1 expression was associated with E-cadherin in COAD while there was no significant correlations between TNNT1 expression and N-cadherin, Vimentin, Snail, MMP9. To identify whether TNNT2 has the same role as TNNT1 on EMT-related molecules, we also analyzed the correlations among TNNT2 and EMT-related molecules using Pearson’s analysis. As shown in Supplementary Figure 3S, TNNT2 had none closely correlations with EMT-related molecules (P < 0.05, | r | > 0.3). These data indicated that TNNT1 might play a more critical role than TNNT2 and TNNT3 in COAD development.
Figure 4. TNNT1 affected the expressions of epithelial–mesenchymal transition (EMT)-related proteins in colon adenocarcinoma cells (a) Si-TNNT1#2 was an inducer for E-cadherin and inhibitor for N-cadherin, Vimentin, Snail and MMP9 in SW1116 cells via western blot. (b) The gray value of protein bands was quantified. (c) Overexpression of TNNT1 inhibited E-cadherin whilst increased N-cadherin, Vimentin, Snail and MMP9. (d) The gray value of protein bands was analyzed. **P < 0.01.
Discussion
COAD is a common tumor with increasing incidence gradually. Recent evidence revealed that the development of COAD is linked with abnormal gene expression or specific structure [Citation17]. Thus, it is necessary to explore effective targets for therapeutic therapy of COAD. Wang et al. performed a investigation and found that eight miRNAs with related genes were closely correlated with COAD progression [Citation18]. Furthermore, TNNT1 mutation is enabled to induce coronary artery disease, nemaline body myopathy and participates in mouse brain metabolism [Citation19–Citation21]. In our present study, the expression of TNNT1 showed a higher level in COAD tissues than that of the normal tissues. Furthermore, those patients with high TNNT1 expression had poor outcomes while patients with low TNNT1 expression could recover very well.
Next, we examined the expression of TNNT1 in various COAD cell lines and used SW1116 cells and HT29 cells to carry out loss-of-function and gain-of-function assays. The oncogenic role of TNNT1 in COAD was verified by CCK-8 and transwell analyses. Moreover, according to the previous publications, the function of TNNT1 depended on the regulation of calcium (Ca2+), Ca2+ is involved in multiple cellular processes and closely associated with tumorigenesis [Citation10,Citation22]. It seems to provide a molecular theoretical basis for the function of TNNT1 in COAD. As far as we know, EMT has been identified to interact with cancer metastasis by regulating cell-cell adhesion, migratory and invasive capabilities [Citation23,Citation24]. In EMT process, loss of E-cadherin is regard as a basic event [Citation25], and our western blot result showed that E-cadherin was significantly elevated in SW1116 cell with down-regulation of TNNT1 and decreased in HT29 cell after overexpressing TNNT1. More importantly, the Pearson’s analysis of our study elucidated that TNNT1 expression was associated with E-cadherin expression in COAD tissues. Herein, we suspected that TNNT1 played a positive role on EMT process via regulating E-cadherin. Given mesenchymal-related transcription factors served as repressor of E-cadherin to further trigger EMT [Citation26], we also detected the expression of N-cadherin, Vimentin, Snail and MMP9 in COAD cells using western blotting and analyzed the relationship between TNNT1 expression and mesenchymal-related transcription factors (N-cadherin, Vimentin, Snail, and MMP9) based on the TCGA database. Results of western blotting revealed that the protein expression of N-cadherin, Vimentin, Snail, and MMP9 were positively associated with TNNT1 expression, but the Pearson’s analyses uncovered that there was no correlations between mesenchymal-related transcription factors (N-cadherin, Vimentin, Snail, and MMP9) and TNNT1 expression. In addition to TNNT1, we also detected the potential role of TNNT2 and TNNT3 in COAD and found that TNNT2 was highly regulated in COAD tissues and its high-regulation was linked with poor prognosis of COAD patients. TNNT3 was low-regulated in COAD tissues, while its high expression was related with unfavorable prognosis in COAD. Of note, Pearson’s analysis suggested that EMT-related genes had no significant correlation with TNNT2 expression. In summary, all these results strengthened the overview that TNNT1 might regulate the progression of COAD via mediating the EMT process, which might exert a more critical role than TNNT2 and TNNT3.
Although our results explained to some extent the relationship between TNNT1 and COAD, there are still a few limitations in this work. The experiments were only conducted in vitro and short of vivo explanations, which reduced the credibility of the study. Besides, strings of signaling pathways have been verified to mediate cellular processes with EMT transmission together, such as Wnt/beta-catenin pathway and Akt/PI3K pathway [Citation27,Citation28]. Hence, the future experiments should be implemented in vivo and the related pathway needs to be detected either.
Conclusion
In conclusion, we first demonstrated that TNNT1 was highly expressed in COAD tissues and the overall survival rates of COAD patients were associated with the expression of TNNT1. Loss-of-TNNT1 and gain-of-TNNT1 functions verified the tumor-promoting effect of TNNT1 in COAD. TNNT1 could promote cell proliferation, migration, and invasion and regulate the EMT-related factors, including E-cadherin, N-cadherin, Vimentin, Snail, and MMP9. Therefore, TNNT1 maybe serve as an important biomarker for COAD prognosis and provide with a novel therapeutic target in cancers.
Author contribution
Conception and design: H.Y.H and C.Y.Q; Development of methodology, acquisition of data: H.Y.H, Y.S.Y, and T.R.S. Analysis and interpretation of data: H.Y.H, Y.S.Y and T.R.S. Writing, review and/or revision of the manuscript: H.Y.H, Y.S.Y and C.Y.Q. All authors have reviewed and approved the final manuscript.
Supplementary_Figure_S3.pdf
Download PDF (1.7 MB)Supplementary_Figure_S2.pdf
Download PDF (1.2 MB)Supplementary_Figure_S1.pdf
Download PDF (1.1 MB)Supplementary_Figure_Legends.pdf
Download PDF (131.8 KB)Acknowledgments
Not applicable.
Disclosure statement
No potential conflict of interest was reported by the authors.
Supplementary material
Supplemental data for this article can be accessed here.
Additional information
Funding
Related Research Data
References
- Forman D, Ferlay J. The global and regional burden of cancer. World cancer report. 2014;1:16–53.
- Schetter AJ, Leung SY, Sohn JJ, et al. MicroRNA expression profiles associated with prognosis and therapeutic outcome in colon adenocarcinoma. JAMA. 2008;299:425–436.
- Watson AJ, Collins PD. Colon cancer: a civilization disorder. Dig Dis. 2011;29:222–228.
- Cunningham D, Atkin W, Lenz HJ, et al. Colorectal cancer. Lancet. 2010;375:1030–1047.
- Roncucci L, Mariani F. Prevention of colorectal cancer: how many tools do we have in our basket? Eur J Intern Med. 2015;26:752–756.
- Neri E, Faggioni L, Cini L, et al. Colonic polyps: inheritance, susceptibility, risk evaluation, and diagnostic management. Cancer Manag Res. 2010;3:17–24.
- Tsukuda K, Tanino M, Soga H, et al. A novel activating mutation of the K-ras gene in human primary colon adenocarcinoma. Biochem Biophys Res Commun. 2000;278:653–658.
- Tsimberidou AM. Targeted therapy in cancer. Cancer Chemother Pharmacol. 2015;76:1113–1132.
- Herzig DO, Tsikitis VL. Molecular markers for colon diagnosis, prognosis and targeted therapy. J Surg Oncol. 2015;111:96–102.
- Wei B, Jin JP. TNNT1, TNNT2, and TNNT3: isoform genes, regulation, and structure-function relationships. Gene. 2016;582:1–13.
- Jin JP, Zhang Z, Bautista JA. Isoform diversity, regulation, and functional adaptation of troponin and calponin. Crit Rev Eukaryot Gene Expr. 2008;18:93–124.
- Barton PJ, Townsend PJ, Brand NJ, et al. Localization of the fast skeletal muscle troponin I gene (TNNI2) to 11p15.5: genes for troponin I and T are organized in pairs. Ann Hum Genet. 1997;61:519–523.
- Shi Y, Zhao Y, Zhang Y, et al. TNNT1 facilitates proliferation of breast cancer cells by promoting G1/S phase transition. Life Sci. 2018;208:161–166.
- Ju Y, Li J, Xie C, et al. Troponin T3 expression in skeletal and smooth muscle is required for growth and postnatal survival: characterization of Tnnt3(tm2a(KOMP)Wtsi) mice. Genesis. 2013;51:667–675.
- Petropoulou E, Soltani M, Firoozabadi AD, et al. Digenic inheritance of mutations in the cardiac troponin (TNNT2) and cardiac beta myosin heavy chain (MYH7) as the cause of severe dilated cardiomyopathy. Eur J Med Genet. 2017;60:485–488.
- Kawabe S, Mizutani T, Ishikane S, et al. Establishment and characterization of a novel orthotopic mouse model for human uterine sarcoma with different metastatic potentials. Cancer Lett. 2015;366:182–190.
- Dean M. Cancer as a complex developmental disorder–nineteenth Cornelius P. Rhoads memorial award lecture. Cancer Res. 1998;58:5633–5636.
- Wang Y, Zhang J, Li L, et al. Identification of molecular targets for predicting colon adenocarcinoma. Med Sci Monit. 2016;22:460–468.
- Guay SP, Legare C, Brisson D, et al. Epigenetic and genetic variations at the TNNT1 gene locus are associated with HDL-C levels and coronary artery disease. Epigenomics. 2016;8:359–371.
- Abdulhaq UN, Daana M, Dor T, et al. Nemaline body myopathy caused by a novel mutation in troponin T1 (TNNT1). Muscle Nerve. 2016;53:564–569.
- Lowe XR, Lu X, Marchetti F, et al. The expression of troponin T1 gene is induced by ketamine in adult mouse brain. Brain Res. 2007;1174:7–17.
- Monteith GR, McAndrew D, Faddy HM, et al. Calcium and cancer: targeting Ca2+ transport. Nat Rev Cancer. 2007;7:519–530.
- Kong D, Li Y, Wang Z, et al. Cancer stem cells and Epithelial-to-Mesenchymal Transition (EMT)-phenotypic cells: are they cousins or twins? Cancers (Basel). 2011;3:716–729.
- Lamouille S, Xu J, Derynck R. Molecular mechanisms of epithelial-mesenchymal transition. Nat Rev Mol Cell Biol. 2014;15:178–196.
- Sciacovelli M, Frezza C. Metabolic reprogramming and epithelial-to-mesenchymal transition in cancer. FEBS J. 2017;284:3132–3144.
- Zhang Y, Weinberg RA. Epithelial-to-mesenchymal transition in cancer: complexity and opportunities. Front Med. 2018;12:361–373.
- Kalluri R, Weinberg RA. The basics of epithelial-mesenchymal transition. J Clin Invest. 2009;119:1420–1428.
- Zhang L, Huang G, Li X, et al. Hypoxia induces epithelial-mesenchymal transition via activation of SNAI1 by hypoxia-inducible factor −1alpha in hepatocellular carcinoma. BMC Cancer. 2013;13:108.