
 ?Mathematical formulae have been encoded as MathML and are displayed in this HTML version using MathJax in order to improve their display. Uncheck the box to turn MathJax off. This feature requires Javascript. Click on a formula to zoom.
ABSTRACT
Artocarpin has shown anti-inflammation and anticancer activities. However, the metabolism differences among different species have not been reported. In this work, we used liver microsomes to explore the metabolic characteristics and possible metabolites of artocarpin among different species. The structures of six metabolites were characterized by LC-MS/MS, and hydroxylated artocarpin was the main metabolite. Enzyme kinetics and depletion studies of artocarpin among different species proved that artocarpin metabolism exhibited significant species differences; rats and monkeys showed a great metabolic ability to artocarpin, and minipigs showed the highest similarity to humans. The in vivo hepatic clearances of artocarpin in rats and humans were predicted that artocarpin was classified as a high-clearance drug in humans and rats. The glucuronidation assay of artocarpin in different liver microsomes also proved that artocarpin metabolism showed significant species difference. These findings will support further pharmacological or toxicological research on artocarpin.
Abbreviations: UGT: UDP-glucuronosyltransferase; CYP: cytochrome P450; LC-MS/MS: liquid chromatography-tandem mass spectrometry; HPLC: high-performance liquid chromatography; HLMs: human liver microsomes; MLMs: monkey liver microsomes; RAMs: rabbit liver microsomes; RLMs: rat liver microsomes; DLMs: dog liver microsomes; PLMs: minipig liver microsomes; Vmax: maximum velocity; Km: Michaelis constant; CLint: intrinsic clearance; CLH: hepatic clearance; QH: hepatic blood flow
GRAPHICAL ABSTRACT
The metabolism of artocarpin exhibited significant species difference
Artocarpin, isolated from an agricultural plant Artocarpus communis (Moraceae family), showed antibacterial [Citation1], anti-oxidation, anti-inflammatory [Citation2] and anticancer [Citation3–Citation6] activities. Previous studies mainly focused on biological and pharmacological activities of artocarpin, but metabolic characteristics were rarely reported. Qu et al. reported that CYP2D6 played a vital role in catalyzing the metabolism of artocarpin [Citation7]. During the development process of drug, it is necessary to study the relevant pharmacology and toxicology properties in animals before human administration [Citation8]. One of challenges is to choose the optimal animal species as a model of metabolism in humans. Cytochrome P450 (CYPs) and UDP-glucuronosyltransferase (UGTs) are two important phases I and II enzymes, respectively. The catalytic roles of CYPs and UGTs in the same gene families are generally similar among different species, and there are relatively small differences in the primary amino acid sequences of the CYPs and UGTs across species. However, even small changes in the amino acid sequences of CYPs and UGTs can give rise to profound differences in substrate specificity and catalytic activity [Citation9]. The differences in CYP and UGT isoforms between species are a major cause of species differences in drug metabolism. Therefore, it is critical to select an animal model with similar metabolic characteristics to humans during the drug development.
In this study, we determined the metabolism characteristics of artocarpin in liver microsomes from six species (rat, minipig, rabbit, dog, monkey, and human) and confirmed which species best resembled the drug-metabolism capabilities of humans.
Materials and methods
Chemicals and reagents
Artocarpin was purchased (purity > 98%) from Yunan BioBioPha (Kunming, China). NADP+, Brij 58, glucose-6-phosphate dehydrogenase, and D-glucose-6-phosphate, Tris–HCl, 7-hydroxycoumarin, and uridine 5´-diphosphoglucuronic acid (UDPGA) (trisodium salt) were purchased from Sigma Aldrich (St. Louis, MO, USA). Acetonitrile (HPLC grade) was purchased from Merck Company (Darmstadt, Germany) and formic acid (HPLC grade) was purchased from Tedia Company Inc. (Fairfield, OH, USA). The other regents and solvents used were of analytical and HPLC grade.
Preparation and characterization of liver microsomes
Pooled liver microsomes from humans (HLMs), monkeys (MLMs), rabbits (RAMs), rats (RLMs), mouse (MOMs), dogs (DLMs) and minipigs (PLMs) were provided by the Research Institute for Liver Disease (Shanghai) Co., Ltd. (Shanghai, China). The HLMs were prepared from eleven individual human donor livers. MLMs, RAMs, RLMs, DLMs, and PLMs were prepared from 10 individual animal livers. Protein concentration was determined by bicinchoninic acid (BCA) Protein Assay Kit [Citation10].
The incubation systems with liver microsomes from different species
Artocarpin (20 μM) was incubated with HLMs, PLMs, DLMs, RLMs, RAMs, or MLMs, respectively. Incubation system and conditions were reported, previously [Citation7]. In brief, incubation system consisted of liver microsomes (0.5 mg/mL), 4 mM MgCl2, 10 mM glucose-6-phosphate and 1 unit/mL of glucose-6-phosphate dehydrogenase in the final volume of 200 μL of 0.1 M potassium phosphate buffer (pH 7.4). After pre-incubation at 37°C for 3 min, the reaction was initiated by adding NADPH (1 mM). The incubation time was set at 60 minutes in order to ensure linear formation of metabolites. Reaction was quenched by adding 200 μL ice-cold methanol (containing IS). After centrifuged at 20000 × g for 20 min at 4°C, an aliquot of the supernatant was injected into the HPLC system for analysis.
HPLC system
HPLC system (Shimadzu, Kyoto, Japan) has been described by Qu et al. [Citation7], which consisted of two LC‐20AB pumps, an SIL‐20A auto-injector and an SPD‐20A ultraviolet light (UV) detector. The separation of samples was achieved by a Hypersil BDS C18 column (4.6 × 150 mm, 5 μm, Dalian Elite Analytical Instruments Co., Dalian, China). Acetonitrile (A) and water containing 0.1% (v/v) formic acid (B) were used mobile phase, with the following gradient profile: 0–12 min, 50–5% B; 12.01–15 min, 5% B; 15.01–15.30 min, 5–50% B; 15.30–21.00 min, 50% B. The flow rate, column temperature, and wavelength were set as 1 mL/min, 40°C, and 280 nm, respectively. All the incubation experiments were performed in triplicate, and the data were expressed as mean ± standard deviation (SD).
Identifying the metabolites by LC-MS/MS
The analysis for artocarpin metabolites was conducted on an Ultra Performance Liquid Chromatography (UPLC) equipped with a Q-TOF SYNAPT G2-Si High Definition Mass Spectrometry (Waters Corporation, Milford, MA). After artocarpin was incubated with HLMs, DLMs, PLMs, RAMs, RLMs or MLMs (described in Section The incubation systems with liver microsomes from different species), 2 μL sample was injected into a Welch C18 column (1.7 mm × 100 mm, 1.7 μm, Milford, USA) and the column oven was maintained at 40°C. The mobile phase consisted of LC grade water with 0.1% formic acid (A) and LC grade acetonitrile (B) with the following gradient profile: 0.0 min 40% B; 10.0 min 60% B, 11 min 95% B, 12 min 95% B, 13 min 40% B; 15 min 40% B. Mass detection was performed in negative mode from m/z 100 to 1000. The parameters were optimized as follows: Collision gas is Argon; trap collision energies were 6 V (low energy) and 20–50 V (high energy); capillary and cone voltages were 2 kV and 40 V; source and desolvation temperatures were 120°C and 600°C; the cone and desolvation gas flows were 50 and 800 L·h−1, respectively.
Kinetic study
To estimate kinetic parameters, artocarpin (1–200 μM) was incubated with pooled RAMs, MLMs, DLMs, RLMs, PLMs or HLMs. The assay conditions were optimized to ensure that the formation of the metabolites was linear with respect to the concentration of protein and incubation time. The protein concentration in incubation systems was 0.5 mg/mL and incubation time was 60 min. The Km and Vmax (maximum velocity) values of artocarpin were calculated according to nonlinear regression from the Michaelis-Menten equation, and the results were graphically represented on Eadie-Hofstee plots (velocities versus ratios of velocities to substrate concentrations). Intrinsic clearance (CLint) was defined as Vmax/Km ratio. Due to the lack of available metabolite standards, quantification of the metabolites in the incubation mixtures was achieved using the standard curve for artocarpin. All incubations were carried out in three independent experiments. Kinetic constants were reported as mean ± standard deviation (SD).
Prediction of in vivo hepatic clearance
The following equations were employed to predict the in vivo hepatic clearance of artocarpin in rats, and humans [Citation11, Citation12].
where SF (scaling factor) represents the milligrams of microsomal protein per gram of liver multiplied by the grams of liver weight; CLint is the intrinsic metabolic clearance; CLH is hepatic clearance; fu is the free fraction in blood (there is no data of artocarpin; here fu was arbitrarily proposed to be 1); QH is the hepatic blood flow. The hepatic clearance of artocarpin was calculated using Equations (1) and (2) and (3), and the physiological parameters for calculating intrinsic clearance in rats, and humans were described by Naritomi et al. and as follows: microsomal protein for rat, and human were 44.8, and 48.8 mg of protein/g of liver; Liver weight per kilogram of body for rat, and human were 40, and 25.7 g; Liver blood flow for rat, and human were 55.2, and 20.7 mL/min/kg, respectively [Citation13].
Artocarpin depletion in different microsomes
The prototype degradation was evaluated because there may be some differences in the types of metabolic enzymes of different species [Citation14, Citation15]. Artocarpin (0.5, 1, 2.5, 5, 10, 25, 50, 100, and 200 μM) was incubated with pooled RAMs, MLMs, DLMs, RLMs, PLMs or HLMs. The reaction system was described under the section The incubation systems with liver microsomes from different species, and artocarpin was detected by HPLC system.
Glucuronidation assay of artocarpin in different liver microsomes
The incubation mixture, with a total volume of 200 μL, consisted of 50 mM Tris-HCl buffer (pH 7.4), 2 mM UDPGA, 5 mM MgCl2, Brij 58 (1 mg/mg protein), 0.1 mg/ml liver microsomes and 25 µM artocarpin. After preincubation at 37°C for 3 min, the reaction was initiated by adding an UDPGA-generating system; the reaction was incubated at 37°C in a shaking water bath for 1 h. The reaction was quenched by the addition of 200 μL of ice-cold acetonitrile, and then samples were centrifuged 20,000 g for 20 min at 4°C. Aliquots of supernatants were analyzed by HPLC-UV. The incubations without UDPGA, substrate or microsomes were performed to confirm that the metabolites produced were microsomes and UDPGA dependent.
Results
Analysis by HPLC
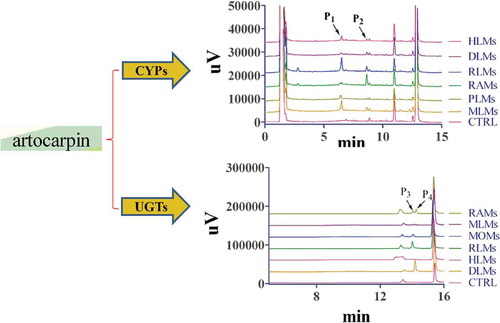
After artocarpin (20 μM) was incubated with HLMs, PLMs, MLMs, RLMs, RAMs, and DLMs (0.5 mg protein/mL), we first used HPLC to determine the amount of metabolites. Two new peaks (P1 and P2) in these samples were observed, and which were identified as artocarpin metabolites by comparison with the control group (CTRL) ( 1). The formation of metabolites was time-, NADPH-, and microsome-dependent. The retention times (Rt) of P1 and P2 were 6.52 and 8.72 min, respectively. As showed in 1, we found P1 was the main metabolite owing to its high peak area for rats, monkeys, humans, and minipigs. For dogs and rabbits, P2 was the most important metabolite with the higher peak area than P1.
Figure 1. Representative chromatogram of artocarpin and its metabolites incubated with HLMs, RLMs, DLMs, RAMs, PLMs, or MLMs in CYP system.
Artocarpin (20 μM) was incubated with liver microsomes (0.5 mg/mL) at 37°C for 30 min.
Structure characterization of metabolites by LC-MS/MS
We used LC-MS/MS to determine and infer the possible structures of artocarpin metabolites. Five metabolites of artocarpin from different species were identified based on direct comparison with the mass spectra of the blank samples. The LC-MS/MS system did not consist of UV detector. In order to distinguish the results detected by HPLC, we named the metabolites detected by LC-MS/MS as M1-M5. As shown in , we detected five (M1-M5), four (M1-M4), five (M1-M5), four (M1-M4), five (M1-M5) and four (M1-M3, and M5) metabolites of artocarpin in RLMs, MLMs, PLMs, RAM, HLMs, and DLMs, respectively. M1 and M2 were the most important metabolites with the largest area percentages. The possible metabolic pathways of artocarpin are shown in 2, and the MS/MS spectra of artocarpin and its metabolites are displayed in 3. The structural analysis of metabolites was based on MS/MS information.
Table 1. Accurate mass measurement for the protonated molecules of metabolites in rat, monkey, pig, rabbit, human and dog liver microsomes.
Figure 2. Proposed metabolic pathway of artocarpin in six species (rat, monkey, dog, rabbit, minipig, and human).
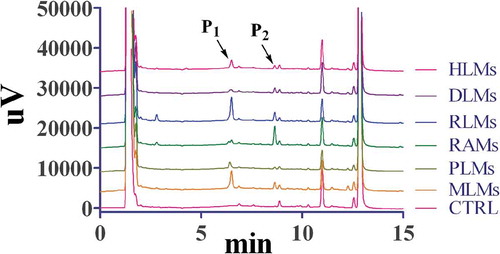
Figure 3. MS/MS spectra of artocarpin and its metabolites.
Parent compound
The formula of artocarpin was C26H28O6 (m/z 435.1811), and it produced seven key fragment ions at m/z 351.0882, 325.1449, 313.1452, 255.0686, 243.0676, 233.0829, and 175.0048 ()). Ring C of artocarpin was lost and formed the fragment ion at m/z 313.1452, and further produced the daughter ions at m/z 255.0686, 243.0676, and 175.0048. The fragment ion at m/z 233.0829 was formed by the retro-Diels-Alder (RDA) cleavage of the B-ring according to the RDA fragmentation pathway of flavonoids [Citation16].
M1, M2, and M3
M1 (Rt = 8.56 min), M2 (Rt = 8.87 min), and M3 (Rt = 9.02 min) were isomers with the same molecular formula of C26H28O7 (m/z 451) and different Rt. Three metabolites had m/z of 16 Da more than artocarpin, indicating that they were hydroxylated products of artocarpin. According to exact mass determination and the corresponding chemical composition, the hydroxyl group was added at C-16, C-20 and C-5′ for M1, M2, and M3, respectively. Fragment ion at m/z 146 was found in M1, M2, and M3 and was inferred to be the parent nucleus of artocarpin.
M4
M4 (m/z 449.1592) had m/z of 2 Da less than M1, suggesting that M4 was the cyclization product of M1. The cyclization reaction may occur between hydroxyl group and side chain in the ortho position [Citation17]. The MS/MS information proved that the cyclization reaction occurred at C-12 and C-14. The characteristic fragment ion at m/z 377.1023 was formed by transformation of phenolic hydroxyl to carbonyl at C-4′ and C-5′. It is prone for two adjacent phenolic hydroxyls to transform into two carbonyls [Citation18].
M5
M5 had m/z of 16 Da more than M2 and was identified as the hydroxylated product of M2. According to the characteristic fragment ions at m/z 379.0425, 335.0536, 291.0638, and 260.8780, we inferred the hydroxyl group was added at C-5′. The fragment ions were formed because phenolic hydroxyl groups at the C-4′ and C-5′ were combined and H2O was removed, and finally an ether bond was formed.
Enzyme kinetics study
P1 data was used to calculate kinetic parameter values (Km, Vmax, and CLint) in DLMs, RLMs, PLMs, RAMs, MLMs, and HLMs. The metabolism profiles of artocarpin (1–200 μM) from different species are shown in 4. The reaction velocities exhibited major concentration-dependent characteristics, and kinetic parameters for the species obeying typical monophasic Michaelis-Menten kinetics are summarized in .
Table 2. Kinetic parameters of P1 production from artocarpin in pooled RLMs, PLMs, MLMs, and HLMs.
Figure 4. Michaelis-Menten plots and Eadie-Hofstee plots of artocarpin in (a) DLMs, (b) MLMs, (c) PLMs, (d) RLMs, (e) HLMs, (f) RAMs.
Each data point represents the mean of triplicate determinations.
Figure 4. (Continued).
Prediction of in vivo hepatic clearance
The in vivo hepatic clearance (CLH) was calculated using the kinetic parameters of P1 in HLMs and RLMs. CLH values were 18.14 and 51.33 mL/min/kg body weight for humans and rats, respectively, and the percentages of CLH versus hepatic blood flow (QH) for them were 87.6% and 92.9%, respectively.
Concentration-dependent depletion of artocarpin in different liver microsomes
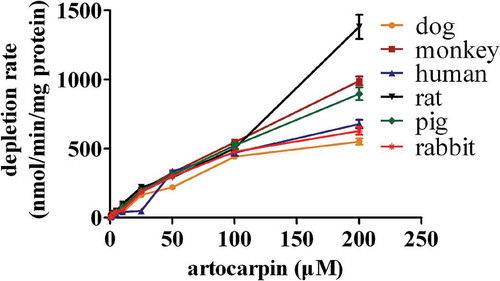
After different concentrations of artocarpin were incubated with HLMs, RLMs, DLMs, RAMs, MOMs, PLMs, or MLMs, Artocarpin was rapidly metabolized at all concentrations. The depletion profiles exhibited concentration dependent, and depletion curves are showen in 5.
Figure 5. The plasma concentration profiles after intravenous administration of artocarpin at a single dose of 2 mg/kg.
Data represent mean ± SD of six rats.
Confirmation of artocarpin glucuronides
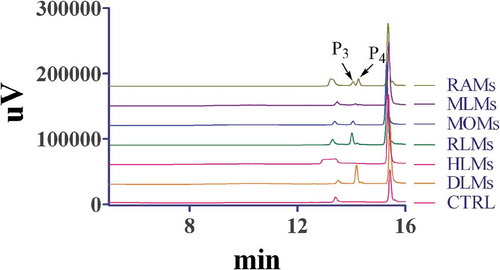
After incubation of artocarpin (25 μM) and liver microsomes (0.1 mg/ml) in the presence of UDPGA, the metabolites were confirmed by HPLC-UV, and the retention times of the two new peaks (P3 and P4) were 14.0 min and 14.2 min ( 6). These peaks were not detected in the control incubations without UDPGA, artocarpin, or microsomes. The artocarpin peak areas in DLMs, RLMs, PLMs, RAMs, MOMs and MLMs were 0.92-, 0.84-, 0.61-, 0.77-, 0.86- and 0.89-fold that for HLMs.
Figure 6. Representative chromatogram of artocarpin and its metabolites incubated with HLMs, RLMs, DLMs, RAMs, MOMs, PLMs, or MLMs in UGT system.
Artocarpin (25 μM) was incubated with liver microsomes (0.5 mg/mL) at 37°C for 30 min.
Discussion
It is perquisite to evaluate pharmacokinetics and toxicity in preclinical studies. The challenge is to identify the optimal animal species to model humans. Although the homology of CYP450 enzymes among species is rather high, minor differences in the amino acid sequences at the active sites of CYP450s can result in a wide variation in substrate specificity and response to chemical inhibitors [Citation11]. A good model should have similar metabolic behaviors including equivalent or similar metabolic enzymes and comparable catalytic efficiency as compared to humans [Citation19]. Consequently, we distinguished the in vitro metabolism behaviors of artocarpin using human, rat, rabbit, dog, minipig, and monkey liver microsomes and further predicted in vivo hepatic clearance to find optimal animal model.
HPLC was used to explore the metabolic characteristics after artocarpin was incubated with liver microsomes from different species. As shown in 1, P1 was the main metabolite of rats, monkeys, humans, and minipigs, and P2 was the most important metabolite of rabbits and dogs. The artocarpin metabolism showed significant species difference. Rats and monkeys showed great ability to catalyze the biotransformation of artocarpin. According to the HPLC chromatogram, minipigs had similar metabolic characteristics to humans. LC-MS/MS was used to identify the structures of artocarpin metabolites and find metabolic pathway. We found five artocarpin metabolites and the hydroxylated metabolites (M1 and M2) were two major metabolites with the largest percentage of the peak area (%) among the species. As in other compounds, the end of the side chain (C-17 and C-21, shown in 7) is readily added by the hydroxyl group [Citation20]. Due to the steric hindrance of the ring-C, C-21 was more difficult to interact with hydroxyl group than C-17. So the peak area (%) of M2 was smaller than that of M1. As shown in , peak area (%) of artocarpin in HLMs was similar to that in PLMs, which proved that the ability of minipigs to metabolize artocarpin was similar to that of humans.
Figure 7. Structure of artocarpin.
In order to measure the metabolic characteristics of artocarpin in different species, we determined the kinetic parameters including Km, Vmax, and CLint for the formation of P1. Our findings also revealed significant differences in the metabolism of artocarpin between species. The metabolism profiles of artocarpin for humans, rats, monkeys, and pigs obeyed typical monophasic Michaelis-Menten kinetics, which was further confirmed by Eadie-Hofstee plots, suggesting that artocarpin was metabolized by only one isozyme or two isozymes with the same Km value [Citation21]. On the contrary, the metabolism profiles of artocarpin for dogs and rabbits did not obey typical monophasic Michaelis-Menten kinetics, which obeyed biphasic kinetics. Biphasic kinetics may be observed when a reaction is carried out by more than one enzyme with different Km values [Citation22]. Analyzing the results shown in , we found that rats and monkeys have a greater ability to metabolize artocarpin as shown by the higher Clint value than other species. Humans and minipigs showed a similar metabolic ability to artocarpin due to similar CLint value. The results were consistent with the HPLC-UV and LC-MS/MS results that artocarpin metabolism was greatest in RLMs and MLMs, and minipigs had similar metabolic behaviors as compared to humans. In addition, the percentages of CLH versus QH for humans and rats were calculated to be 87.6% and 92.9%, respectively. Using the CLH predicted from the in vitro data, compounds can be classified as high-clearance drugs (>70% liver blood flow), low-clearance drugs (<30% liver blood flow), and intermediate-clearance drugs [Citation23]. Artocarpin was classified as a high-clearance drug in humans and minipigs.
In this study, we explored the difference of artocarpin elimination in liver microsomes from various species. As depicted in 5, comparable elimination abilities of artocarpin were observed when artocarpin was incubated with RAMs, DLMs, and HLMs, but these three species had a lower elimination ability for artocarpin than other species. Monkeys and minipigs showed elimination ability, while rat had the strongest elimination ability for artocarpin. CYP2D6 played a key role in metabolizing artocarpin in liver microsomes [Citation7]. CYP2D6 content and activity in monkeys and rats are higher than other species [Citation24], thus monkeys and rats demonstrated a great ability to catalyze the biotransformation of artocarpin. Due to three hydroxyl groups of artocarpin, it is prone to occur glucuronidation reaction for artocarpin clearance. As showed in 6, the glucuronidation reaction of artocarpin showed significant species difference and human possessed a lower metabolic capacity than other species.
In conclusion, the present study clearly demonstrated that artocarpin metabolism exhibited significant species difference, and humans showed lower elimination ability for artocarpin than other species.
Author Contribution
H. Jiang, X. Shi, and J. Yang designed this research, performed experiments, and wrote this manuscript. X. Meng performed experiments. All authors approved the final version of the manuscript.
Disclosure statement
No potential conflict of interest was reported by the authors.
Additional information
Funding
References
- Septama AW, Panichayupakaranant P. Synergistic effect of artocarpin on antibacterial activity of some antibiotics against methicillin-resistant Staphylococcus aureus, Pseudomonas aeruginosa, and Escherichia coli. Pharm Biol. 2016;54:686–691.
- Septama AW, Jantan I, Panichayupakaranant P. Flavonoids of Artocarpus heterophyllus Lam. heartwood inhibit the innate immune responses of human phagocytes. J Pharm Pharmacol. 2018;70:1242–1252.
- Lee CW, Hsu LF, Lee MH, et al. Extracts of artocarpus communis induce mitochondria-associated apoptosis via pro-oxidative activity in human glioblastoma cells. Front Pharmacol. 2018;9:411.
- Sun G, Zheng Z, Lee MH, et al. Chemoprevention of colorectal cancer by artocarpin, a dietary phytochemical from Artocarpus heterophyllus. J Agric Food Chem. 2017;65:3474–3480.
- Tsai MH, Liu JF, Chiang YC, et al. Artocarpin, an isoprenyl flavonoid, induces p53-dependent or independent apoptosis via ROS-mediated MAPKs and Akt activation in non-small cell lung cancer cells. Oncotarget. 2017;8:28342–28358.
- Lee CW, Chi MC, Chang TM, et al. Artocarpin induces cell apoptosis in human osteosarcoma cells through endoplasmic reticulum stress and reactive oxygen species. J Cell Physiol. 2019;234:13157–13168.
- Qu W, Liu X. Identification of cytochrome P450 isoforms involved in the metabolism of artocarpin and assessment of its drug-drug interaction. Biomed Chromatogr. 2018;32:e4149.
- Kishino Y, Hasegawa T, Yamoto T, et al. Species differences in micronucleus induction of the clastogenic compounds associated with drug metabolic profile. J Toxicol Sci. 2019;44:701–709.
- Nishimuta H, Nakagawa T, Nomura N, et al. Species differences in hepatic and intestinal metabolic activities for 43 human cytochrome P450 substrates between humans and rats or dogs. Xenobiotica. 2013;43:948–955.
- Smith PK, Krohn RI, Hermanson GT, et al. Measurement of protein using bicinchoninic acid. Anal Biochem. 1985;150:76–85.
- Shi X, Yang S, Zhang G, et al. The different metabolism of morusin in various species and its potent inhibition against UDP-glucuronosyltransferase (UGT) and cytochrome p450 (CYP450) enzymes. Xenobiotica. 2016;46:467–476.
- Zhang YY, Liu Y, Zhang JW, et al. C-7 configuration as one of determinants in taxanes metabolism by human cytochrome P450 enzymes. Xenobiotica. 2009;39:903–914.
- Naritomi Y, Terashita S, Kimura S, et al. Prediction of human hepatic clearance from in vivo animal experiments and in vitro metabolic studies with liver microsomes from animals and humans. Drug Metab Dispos. 2001;29:1316–1324.
- Li S, Teng L, Liu W, et al. Interspecies metabolic diversity of harmaline and harmine in in vitro 11 mammalian liver microsomes. Drug Test Anal. 2017;9:754–768.
- Liu Z, Yang Y, Sheng L, et al. Interspecies variation of in vitro stability and metabolic diversity of YZG-331, a promising sedative-hypnotic compound. Front Pharmacol. 2017;8:527.
- Bao KD, Li P, Qi LW, et al. Characterization of flavonoid metabolites in rat plasma, urine, and feces after oral administration of Semen Ziziphi Spinosae extract by HPLC-diode-array detection (DAD) and ion-trap mass spectrometry (MS(n)). Chem Pharm Bull (Tokyo). 2009;57:144–148.
- Shan L, Zhang G, Guo Z, et al. In vitro investigation of permeability and metabolism of licoricidin. Life Sci. 2019;234:116770.
- Vacek J, Papouskova B, Vrba J, et al. LC-MS metabolic study on quercetin and taxifolin galloyl esters using human hepatocytes as toxicity and biotransformation in vitro cell model. J Pharm Biomed Anal. 2013;86:135–142.
- Ma XC, Ning J, Ge GB, et al. Comparative metabolism of cinobufagin in liver microsomes from mouse, rat, dog, minipig, monkey, and human. Drug Metab Dispos. 2011;39:675–682.
- Wang Q, Qiao X, Liu CF, et al. Metabolites identification of glycycoumarin, a major bioactive coumarin from licorice in rats. J Pharm Biomed Anal. 2014;98:287–295.
- Ma Z, Shi X, Zhang G, et al. Metabolism and metabolic inhibition of xanthotoxol in human liver microsomes. Evid Based Complement Alternat Med. 2016;2016:5416509.
- Seibert E, Tracy TS. Different enzyme kinetic models. Methods Mol Biol. 2014;1113:23–35.
- Li XQ, Bjorkman A, Andersson TB, et al. Identification of human cytochrome P(450)s that metabolise anti-parasitic drugs and predictions of in vivo drug hepatic clearance from in vitro data. Eur J Clin Pharmacol. 2003;59:429–442.
- Shimada T, Mimura M, Inoue K, et al. Cytochrome P450-dependent drug oxidation activities in liver microsomes of various animal species including rats, guinea pigs, dogs, monkeys, and humans. Arch Toxicol. 1997;71:401–408.