
ABSTRACT
Alzheimer’s disease (AD) is a progressive neurodegenerative disorder that mostly strikes the elderly. However, the exact molecular and cellular pathogenesis of AD, especially the dynamic changes of neurons during disease progression, remains poorly understood. Here we used single-nucleus RNA sequencing (snRNA-seq) to access the transcriptional changes of hippocampal neurons in APP23 mouse model of AD. We performed snRNA-seq using a modified Smart-seq2 technique on 3,280 neuronal nuclei from the hippocampus of young and aged APP23 and control mice and identified four distinct subpopulations. Comparative transcriptional analysis showed multiple changes in different subtypes of hippocampal neurons of APP23 mice in comparison to control mice, as well as the transcriptional changes in these neurons during disease progression. Our findings revealed multiple neuronal subtype-specific transcriptional changes that may lead to targets for future studies of AD.
Graphical abstract
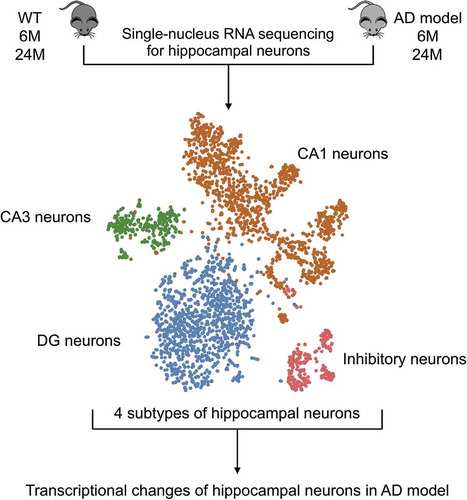
Single-nucleus RNA-seq for identifying the transcriptional changes in hippocampal neurons of an Alzheimer’s disease mouse model.
Alzheimer’s disease (AD) is a progressive neurodegenerative disorder of the central nervous system. As the most common cause of dementia, AD mostly strikes the elderly over 65, starting with mild memory loss and progressively develops into broad, severe cognitive impairment and behavioral disturbances [Citation1,Citation2]. A major pathological hallmark of AD is the accumulation of amyloid plaques in the brain. Amyloid plaques are extracellular deposits of Aβ peptide, which is produced via cleavage of amyloid precursor protein (encoded by APP gene) subsequently by β-secretase and γ-secretase. Aβ has been shown to play a critical role in AD pathogenesis [Citation2–Citation5], and multiple AD mouse models with Aβ pathology were constructed, among which APP23 is a well-characterized model. APP23 mice overexpresses human APP751 gene harboring the Swedish mutation (KM670/671NL) under the murine Thy1 promoter by sevenfold [Citation6]. Consequently, APP23 mice exhibit extensive amyloid pathology in an age-dependent manner. In APP23 mice, Aβ deposits gradually increase in size and number with aging, until occupying an extensive area of the cortex and hippocampus at 24 months [Citation7], along with deficits in learning and memory. These characteristics make APP23 mice a useful tool for investigating the progression of Aβ pathology in AD.
Brain-tissue transcriptomic studies have revealed multiple changes in the AD brain [Citation8–Citation11]. However, “bulk” sequencing is likely to mask the complex transcriptional changes across various cell types. Single-cell RNA sequencing (scRNA-seq), and single-nucleus RNA sequencing (snRNA-seq), on the other hand, are well suited for studying the transcriptome of cell types in complex tissues by profiling thousands of cells and characterizing the transcriptomic state of each cell. Therefore, scRNA-seq and snRNA-seq became widely used in transcriptomic analyses of the brain [Citation12–Citation15].
The hippocampus, which is one of the earliest and most severely affected brain regions in AD [Citation16], plays a major role in learning and memory [Citation17]. However, the transcriptional changes during AD in the hippocampus, especially in different subtypes of hippocampal neurons, remain unclear. Here we used brain samples from APP23 transgenic mice and wild-type (WT) control mice to perform isolation of neuronal nuclei from the hippocampus, followed by a modified Smart-seq2 [Citation13] technique to better understand the transcriptional changes in different subtypes of hippocampal neurons in AD. Our results revealed transcriptional patterns of different subtypes of hippocampal neurons in APP23 mice, as well as transcriptional changes in these neurons during disease progression.
Materials and methods
Animals
All animal experiments were carried out in full compliance with regulations of Institutional Animal Care and Use Committee of University of Science and Technology of China. Wild type (C57BL/6J) and APP23 transgenic mice (B6. Cg-Tg (Thy1-APP)3Somm/J) were fed ad libitum and maintained a regular light-dark cycle of 12 h. All experimental animals (male and female) were randomized according to their genotype.
Tissue harvesting
Mice were anesthetized with 2% pentobarbital sodium solution. Brain was removed from the skull after perfusion, the left hemisphere immediately placed on dry ice, and the right hemisphere immediately dissected for the hippocampus. All tissue harvested were transferred to −80°C freezer for long-term storage.
Immunofluorescence
Left Hemispheres of WT and APP23 mice were fixed in 4% paraformaldehyde (PFA) at 4°C, followed by dehydration in 30% sucrose solution. Coronal cryosections (30 μm thickness) were permeabilized with 0.5% Triton X-100 in phosphate-buffered saline (PBS) and blocked in blocking buffer (3% natural goat serum and 0.1% Triton X-100 in PBS) at room temperature. Primary antibody: anti-Aβ (4G8) antibody (Biolegend, 800702). Primary antibody was diluted in blocking buffer and incubated at 4°C on a shaking table overnight. Binding of the primary antibody was visualized using Alexa Fluor 555 fluorophore-conjugated secondary antibody (Cell Signaling Technologies). Nuclei of the cells were stained with DAPI (Life Technologies, D1306). Images were collected using a ZEISS LSM 800 Confocal Laser Scanning Microscope.
RNA extraction from mouse brain tissue
Total RNA was extracted from frozen mouse brain tissue using TRIzol (Invitrogen, 15596026). Briefly, tissue was grinded into powder in liquid nitrogen, then TRIzol reagent was added to the tissue for lysis. Chloroform was added to the sample for phase separation. The water phase was collected, precipitated with ice-cold isopropanol, and the RNA pellet was washed in cold 70% ethanol. Nuclease-free water was added to the pellet to dissolve RNA, and the RNA was incubated for 2 min at 70°C. The denatured RNA was immediately transferred to −80°C freezer.
Isolation of neuronal nuclei from frozen mouse hippocampus
The protocol for neuronal nuclei isolation from frozen mouse hippocampus was adapted from Krishnaswami et al. [Citation18]. All procedures were carried out on ice or at 4°C. Briefly, the hippocampus was first lysed and homogenized in 4 mL EZ lysis buffer (Sigma, NUC101) with 0.4 U/μL RNasin Plus Ribonuclease inhibitor (Promega, N2615) and 0.2 U/μL SUPERase In RNase inhibitor (Life Technologies, AM2696) in a 7 mL Dounce tissue grinder to release the nuclei. The homogenized tissue was then filtered through a 40 μm cell strainer, washed, and blocked with staining buffer (PBS containing 0.5% BSA and 0.2 U/μL RNasin Plus Ribonuclease inhibitor (Promega, N2615)) then stained using Rabbit recombinant monoclonal NeuN antibody (Abcam, EPR12763, 1:2000) and DAPI (Life Technologies) for neuronal nuclei and all nuclei, respectively. Both NeuN antibody and DAPI were diluted in staining buffer. The nuclei were then washed with staining buffer, re-suspended in 1 mL staining buffer, and proceeded directly to FACS in the dark.
Single-nucleus RNA-seq
Single neuronal nuclei were directly sorted into 2 μL cell lysis buffer containing barcoded primer using a MoFlo Astrios EQ Cell Sorter (Beckman Coulter). For single-nucleus RNA-seq, reverse transcription of single-nucleus mRNA and cDNA amplification were performed using the Smart-seq2 protocol with modifications [Citation13]. In brief, the nuclei were vortexed for 90 s and incubated at 72°C for 3 min to release all RNAs. The mRNAs were captured with barcoded reverse transcription primers with oligo-dT and UMIs and reverse-transcribed into first-strand cDNAs. The cDNAs were amplified using PCR, and products with different barcodes were pooled together. The index sequence with biotin was added to the 3ʹ ends of the pooled cDNA using PCR amplification. Following cDNA fragmentation using Covaris S220 Focused-ultrasonicator, Dynabeads MyOne Streptavidin C1 (Invitrogen, 65002) was used to capture the 3ʹ cDNAs and the sequencing libraries were constructed with Kapa Hyper Prep Kit (Kapa Biosystems, KK8505). The libraries were sequenced using the Illumina Hiseq-PE150 platform.
Nucleic acid fragment analysis
Total RNA fragment analysis was performed on Agilent 2100 Bioanalyzer Instrument using Agilent RNA 6000 Nano Kit (5067–1511). DNA fragment analysis was performed on the Fragment Analyzer by Agilent formerly Advanced Analytical (AATI).
Processing of single-nucleus RNA-seq data
Raw single-nucleus RNA-seq reads were processed to remove the poly A tail sequence, TSO primer sequence, reads with adaptor contaminants and bases with low quality. After filtering, the clean reads were aligned to the mouse genome (mm10 from UCSC) with TopHat [Citation19]. Uniquely mapped reads were then counted using HTSeq [Citation20], and duplicated transcripts with the same UMI of each gene were removed for each nucleus; therefore, the number of UMIs for each gene is counted as the copy number for transcripts. Gene expression levels of each nucleus were quantified with transcripts per million (TPM), then normalized by log2((TPM/10) +1) for downstream analysis. Single nuclei with mapping rate > 20%, number of genes detected > 500, and number of transcripts > 4,000 were selected for further analysis.
Identification of neuronal subtypes and differentially expressed genes (DEGs)
All 3,280 neuronal nuclei that passed the quality control criteria were combined into one dataset, and the Seurat package [Citation21] was used to identify different neuronal subtypes. Principal component analysis (PCA) was performed using the function RunPCA from Seurat [Citation21] to project the dataset into a 10-dimensional space, where the main sources of heterogeneity were conserved. Then, the dataset was further processed using t-distributed stochastic neighbor embedding (t-SNE) algorithm. tSNE was performed on the first 10 principal components (PCs) using the function RunTSNE [Citation21] from R package Seurat by setting dims.use = 1:10. PROX1, MPPED1, MNDAL, and GAD1 were used as markers to identify different subtypes of neurons in the mouse hippocampus: DG neurons, CA1 neurons, CA3 neurons, and inhibitory neurons, respectively. For differentially expressed genes (DEGs), the FindAllMarkers function from Seurat was used based on normalized TPM by setting only.pos = TRUE, min.pcs = 0.25, in order to identify cluster-specific marker genes. After each analysis for differentially expressed genes, genes on the X and Y chromosomes were removed from the results.
Pathways analysis
Gene Ontology (GO) enrichment analyses were performed with Metascape [Citation22], using the adjusted p-value-ranked gene lists as input.
Data availability
The data discussed in this publication have been deposited in NCBI’s Gene Expression Omnibus [Citation23] and are accessible through GEO Series accession number GSE141044 (https://www.ncbi.nlm.nih.gov/geo/query/acc.cgi?acc= GSE141044).
Results
Single-nucleus RNA-seq profiling of APP23 mice hippocampal neurons
In order to observe the transcriptional changes of hippocampal neurons in AD, we selected 6 young (6-month-old, 3 WT and 3 APP23) and 6 old (24-month-old, 3 WT and 3 APP23) mice. Before sample preparation, we validated the Aβ pathology in APP23 and control mice by immunofluorescence (Figure S1). As expected, no amyloid plaque was present in WT control mice. In 6-month-old APP23 mice, no apparent Aβ plaque was observed. Conversely, 24-month-old APP23 mice developed obvious and extensive amyloid plaques in the hippocampus.
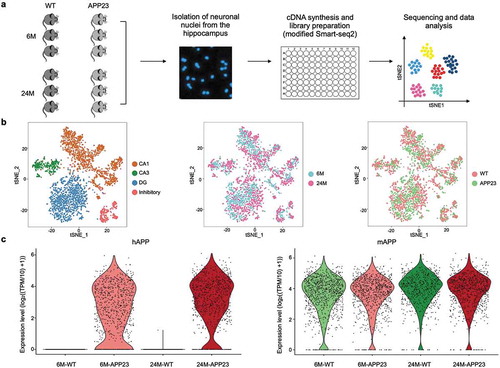
We generated snRNA-seq libraries using the Smart-seq2 technique with minor modifications for neuronal nuclei from the hippocampus of 12 mice ()). Nuclei profiles with < 500 genes, < 4,000 transcripts detected or a mapping rate of <20% were removed from the dataset and the remaining nuclei profiles were further processed. After filtration of the snRNA-seq data, the remaining dataset contains 3,280 neuronal nuclei profiles, with 1,674 neuronal nuclei from APP23 mice hippocampus and 1,606 neuronal nuclei from WT mice hippocampus. The data from one 24-month-old WT mouse were deleted from the dataset completely because of its low quality. In each neuronal nucleus (sequenced at 34,791 reads per nucleus), an average of 3,658 detected genes and 37,502 transcripts was detected (Figure S2a). In order to classify the neuronal subtypes in the mouse hippocampus, after amending the batch effect, we performed principal components analysis (PCA) on the filtered data and used the t-SNE algorithm for dimensionality reduction and visualization. We identified the four major subtypes of hippocampal neurons by interrogating the patterns of marker gene expression: DG neurons (marked by PROX1), CA1 neurons (marked by MPPED1), CA3 neurons (marked by MNDAL) and inhibitory neurons (marked by GAD1) (), Figure S3). These cell types and markers matched previous DroNc-seq dataset for mouse hippocampus [Citation12], are consistent in 6-month-old and 24-month-old groups, and are applicable in both APP23 and WT mice hippocampal neurons ()). Moreover, human APP mRNA could only be detected in APP23 mouse hippocampal neurons, while mouse APP mRNA could be detected in most of the neurons ()), which further confirmed the reliability of our data.
Figure 1. Single-nucleus RNA-seq of 6-month-old and 24-month-old WT and APP23 mice hippocampal neurons. (a) Workflow of sample preparation. (b) Cell-type clusters. tSNE embedding of 3,280 single nucleus transcriptional profiles from 6-month-old and 24-month-old WT and APP23 hippocampal neurons. Cells were distinguished by subtype, age and genotype. (c) Violin plots showing the expression level of human APP gene and mouse APP gene in all neuronal nuclei. hAPP, human APP; mAPP, mouse APP.
Differential expression analysis reveals neuronal subtype-specific alterations in young and aged APP23 mice hippocampus
We identified the four major subtypes of hippocampal neurons using the marker genes stated above in 1,792 6-month-old mice neuronal nuclei (), Figure S4a) and compared the gene expression levels of APP23 hippocampal neurons versus WT hippocampal neurons by subtype. Forty-seven unique differentially expressed genes (DEGs) which implicate all four subtypes of neurons were identified (Table S1). Most of the DEGs were up-regulated in APP23 hippocampal neurons, especially in CA1 and DG neurons ()). The number of DEGs for CA3 neurons and inhibitory neurons were smaller, which likely represents less active transcriptional changes in response to Aβ pathology. ACTB (encodes β-actin) was shown to be down-regulated in DG neurons in 6-month-old APP23 mice. β-actin is an important composition of the neuronal cytoskeleton, which is required for the morphogenesis of dendritic spines and synaptic plasticity [Citation24,Citation25]. Down-regulation of ACTB could indicate damage of the cytoskeleton in DG neurons, which may, in turn, contribute to cognitive dysfunction in APP23 mice.
Figure 2. Classification of 6-month-old and 24-month-old mouse hippocampal neurons. (a) Cell-type clusters of 6-month-old mice hippocampal neurons. tSNE embedding of 1,792 6-month-old APP23 and WT mice hippocampal neurons. Cells were distinguished by subtype and genotype. (b) Number of DEGs between 6-month-old APP23 versus WT hippocampal neurons across subtypes. CA1, CA1 neurons; CA3, CA3 neurons; DG, DG neurons; In, Inhibitory neurons. (c) Cell-type clusters of 24-month-old mice hippocampal neurons. tSNE embedding of 1,488 24-month-old APP23 and WT mice hippocampal neurons. Cells were distinguished by subtype and genotype. (d) Number of DEGs between 24-month-old APP23 versus WT hippocampal neurons across subtypes. CA1, CA1 neurons; CA3, CA3 neurons; DG, DG neurons; In, Inhibitory neurons.
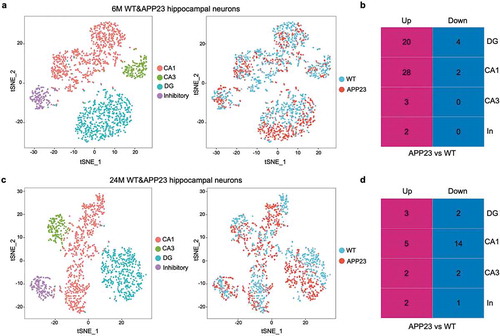
We also identified the four subtypes of neurons in 1,488 24-month-old mice neuronal nuclei (), Figure S4b). Differentially expressed gene analysis revealed 21 DEGs, 6 of which were up-regulated and 15 were down-regulated in 24-month-old APP23 hippocampal neurons, potentially showing attenuated transcriptional activity in these neurons (Table S2). Most of the DEGs were found in CA1 neurons and DG neurons, and few transcriptional changes were found in CA3 neurons and inhibitory neurons ()). MSMO1 and HMGCR, two genes that play important roles in cholesterol biosynthesis, were shown to be up-regulated in 24-month-old APP23 mice CA1 neurons versus WT CA1 neurons. In addition, RASAL1 (encodes Ras protein activator like 1) and TALGN3 (encodes transgelin 3) are shown to be down-regulated in 24-month-old APP23 mice CA1 neurons. Ras protein is responsible for the regulation of actin, while transgelin 3 acts as an actin filament binding protein [Citation26]. Down-regulation of these genes could indicate dysfunction of the regulation of neuronal cytoskeleton, which potentially reflects the deterioration of synaptic functions in 24-month-old APP23 mice CA1 neurons.
Neuronal subtype-specific alterations during AD progression
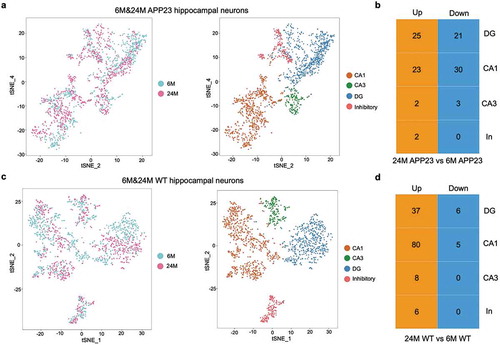
We next aimed to identify the neuronal subtype-specific transcriptional changes during early versus late courses of AD in the hippocampus, as well as the differences between AD progression and normal aging. We performed clustering and differential expression analysis to compare the gene expression levels for 24-month-old APP23 mice hippocampal neurons versus 6-month-old APP23 mice hippocampal neurons by subtype (,)). Then, we repeated the analyses in WT mice hippocampal neurons (,)). In both groups, few transcriptional changes were observed in CA3 neurons and inhibitory neurons, indicating that these neurons may be less affected by aging as well as progression of AD pathology (Tables S3 and S4). In addition, more DEGs were up-regulated in CA1 and DG neurons of 24-month-old WT mice versus 6-month-old WT mice, while the number of DEGs up-regulated and down-regulated were relatively even between 24-month-old and 6-month-old APP23 mice (,)).
Figure 3. Classification of APP23 and WT mice hippocampal neurons. (a) Cell-type clusters of APP23 hippocampal neurons. tSNE embedding of 1,674 6-month-old and 24-month old APP23 mice hippocampal neurons. Cells were distinguished by age and subtype. (b) Number of DEGs between 24-month-old versus 6-month-old APP23 hippocampal neurons across subtypes. CA1, CA1 neurons; CA3, CA3 neurons; DG, DG neurons; In, Inhibitory neurons. (c) Cell-type clusters of WT hippocampal neurons. tSNE embedding of 1,606 6-month-old and 24-month-old WT mice hippocampal neurons. Cells were distinguished by age and subtype. (d) Number of DEGs between 24-month-old versus 6-month-old WT hippocampal neurons across subtypes. CA1, CA1 neurons; CA3, CA3 neurons; DG, DG neurons; In, Inhibitory neurons.
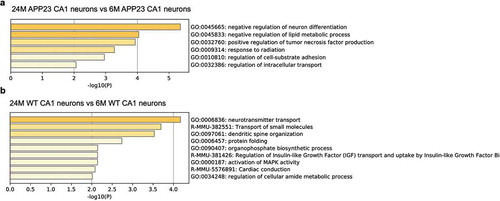
Particularly, Gene ontology (GO) analysis [Citation22] revealed that genes involved in the biological processes of negative regulation of lipid metabolism and positive regulation of tumor necrosis factor (TNF) production were up-regulated in 24-month-old APP23 mouse CA1 neurons, comparing to 6-month-old APP23 mouse CA1 neurons ()). However, genes involved in these processes weren’t up-regulated in WT CA1 neurons during normal aging, potentially indicating transcriptional changes uniquely presented during the progression of Aβ pathology in APP23 mice CA1 neurons. In addition, GO results indicate that genes related to regulation of synaptic plasticity and regulation of vesicle-mediated transport were up-regulated in 24-month-old APP23 mouse CA1 neurons versus 6-month-old APP23 mouse CA1 neurons ()), while genes related to neurotransmitter transport, dendritic spine organization, and protein folding were up-regulated in 24-month-old WT mouse CA1 neurons comparing to 6-month-old WT mouse CA1 neurons ()), potentially suggesting other different transcriptional changes between AD progression and normal aging in CA1 neurons.
Figure 4. Gene Ontology (GO) analysis of APP23 and WT mice CA1 neurons during disease progression and aging. (a) Enriched gene ontology terms show the biological processes related to the up-regulated genes in 24-month-old APP23 CA1 neurons versus 6-month-old APP23 CA1 neurons. (b) Enriched gene ontology terms show the biological processes related to the up-regulated genes in 24-month-old WT CA1 neurons versus 6-month-old WT CA1 neurons.
Discussion
In this study, we report 3,280 single hippocampal neuronal nuclei transcriptomes from young and old APP23 and WT mice. Whereas previous studies on AD transcriptomics mostly rely on bulk RNA sequencing, which masks the heterogeneity of cells in the brain, and existing single-nucleus study on AD brains focuses on the prefrontal cortex or parietal lobes [Citation27,Citation28], we provide neuronal subtype-specific transcriptional changes in response to AD pathology across 4 major subtypes of hippocampal neurons-DG, CA1, CA3 and inhibitory neurons on a single-cell level, as well as neuronal subtype-specific transcriptional changes during AD progression.
Our results reveal multiple DEGs between APP23 and WT mouse hippocampal neurons, including genes related to cytoskeleton regulation (ACTB was down-regulated in 6-month-old mice APP23 DG neurons, RASAL1, and TALGN3 were down-regulated in 24-month-old APP23 mice CA1 neurons) and cholesterol biosynthesis (MSMO1 and HMGCR were up-regulated in 24-month-old APP23 mice CA1 neurons), which may indicate potential disruption of these biological processes in APP23 mice. Previous bulk RNA-seq study using APP23 mice has shown that genes related to the “axon guidance” pathway were generally down-regulated in the forebrain [Citation8]. Our results may further underline the important role of actin cytoskeleton impairment in the pathogenesis of AD in the DG and CA1 neurons of the hippocampus. Moreover, dysregulation of cholesterol homeostasis is known to be associated with multiple neurological disorders, including AD [Citation29]. Membrane increase of cholesterol in primary neurons has been shown to reproduce early changes of AD [Citation30]. Moreover, cholesteryl esters (CE) were recently identified as upstream regulators of phosphorylated tau (P-tau) proteostasis, and its effects on P-tau proteostasis were correlated with Aβ and APP [Citation31]. Although cholesterol biosynthesis has been shown to be less active in neurons comparing to astrocytes [Citation32], our results suggest a potential contribution of neuronal cholesterol biosynthesis to AD pathology in CA1 neurons of the hippocampus.
We also observed transcriptional changes of hippocampal neurons during disease progression, including genes related to negative regulation of lipid metabolism and positive regulation of TNF production, which were up-regulated during aging in APP23 mice CA1 neurons but not significantly changed during normal aging. Prevailing studies suggest that impaired lipid metabolism influences the metabolism and deposition of Aβ as well as tau hyperphosphorylation and aggregation [Citation33], which contributes to AD pathogenesis. The pro-inflammatory cytokine TNF-α has also shown to play a central role in AD pathophysiology [Citation34]. TNF-α could increase the production of other pro-inflammatory cytokines, which could participate in the progression of chronic neuroinflammation [Citation35]. Elevated TNF-α levels may promote the production of Aβ, inhibit Aβ clearance, and contribute to synapse loss [Citation34], which leads to cognitive decline in AD. Anti-inflammatory strategies have been shown to result in a reduction of AD pathology and improvement of cognitive function in AD models [Citation35]. Our results further suggest the important role of lipid metabolism and neuroinflammation during AD progression in CA1 hippocampal neurons.
In summary, our results suggest multiple genes and biological processes affected in different subtypes of hippocampal neurons in AD, which could contribute to the discovery of potential targets for future investigations. Meanwhile, snRNA-seq studies with increased nuclei input and sequencing depth are required for distinguishing more precise transcriptional changes in different subtypes of cells during AD pathogenesis.
Author contributions
F. G., ZL. C. and Y.S. conceived the idea for this study. S. Z., YX. Z., J. Z., XL. Y. and SM. F. performed the experiments. S. Z. and MD. W. analyzed the data. S. Z., DL.B., ZL. C. and Y.S. wrote the main manuscript. All authors reviewed and approved the contents of the final manuscript.
Supplementary_Tables.pdf
Download PDF (283.1 KB)Supplementary_Figures.pdf
Download PDF (1.8 MB)Disclosure statement
No potential conflict of interest was reported by the authors.
Supplementary material
Supplemental data for this article can be accessed here.
Additional information
Funding
References
- Isik AT. Late onset Alzheimer’s disease in older people. Clin Interv Aging. 2010;5:307.
- Hardy J, Selkoe DJ. The amyloid hypothesis of Alzheimer’s disease: progress and problems on the road to therapeutics. Science. 2002;297(5580):353–356.
- Forloni G, Artuso V, La Vitola P, et al. Oligomeropathies and pathogenesis of Alzheimer and Parkinson’s diseases. Mov Disord. 2016;31(6):771–781.
- Shankar GM, Li S, Mehta TH, et al. Amyloid-β protein dimers isolated directly from Alzheimer’s brains impair synaptic plasticity and memory. Nat Med. 2008;14(8):837.
- Jin M, Shepardson N, Yang T, et al. Soluble amyloid β-protein dimers isolated from Alzheimer cortex directly induce Tau hyperphosphorylation and neuritic degeneration. Proc Nat Acad Sci. 2011;108(14):5819–5824.
- Sturchler-Pierrat C, Abramowski D, Duke M, et al. Two amyloid precursor protein transgenic mouse models with Alzheimer disease-like pathology. Proc Nat Acad Sci. 1997;94(24):13287–13292.
- Van Erum J, Van Dam D, Sheorajpanday R, et al. Sleep architecture changes in the APP23 mouse model manifest at onset of cognitive deficits. Behav Brain Res. 2019;373:112089.
- Janssen L, Dubbelaar ML, Holtman IR, et al. Aging, microglia and cytoskeletal regulation are key factors in the pathological evolution of the APP23 mouse model for Alzheimer’s disease. Biochim Biophys Acta Mol Basis Dis. 2017;1863(2):395–405.
- Kim KH, Moon M, Yu SB, et al. RNA-Seq analysis of frontal cortex and cerebellum from 5XFAD mice at early stage of disease pathology. J Alzheimers Dis. 2012;29(4):793–808.
- Landel V, Baranger K, Virard I, et al. Temporal gene profiling of the 5XFAD transgenic mouse model highlights the importance of microglial activation in Alzheimer’s disease. Mol Neurodegener. 2014;9(1):33.
- López-González I, Schlüter A, Aso E, et al. Neuroinflammatory signals in Alzheimer disease and APP/PS1 transgenic mice: correlations with plaques, tangles, and oligomeric species. J Neuropathol Exp Neurol. 2015;74(4):319–344.
- Habib N, Avraham-Davidi I, Basu A, et al. Massively parallel single-nucleus RNA-seq with DroNc-seq. Nat Methods. 2017;14(10):955.
- Zhong S, Zhang S, Fan X, et al. A single-cell RNA-seq survey of the developmental landscape of the human prefrontal cortex. Nature. 2018;555(7697):524.
- Hu P, Fabyanic E, Kwon DY, et al. Dissecting cell-type composition and activity-dependent transcriptional state in mammalian brains by massively parallel single-nucleus RNA-seq. Mol Cell. 2017;68(5):1006–1015. e7.
- Habib N, Li Y, Heidenreich M, et al. Div-Seq: single-nucleus RNA-Seq reveals dynamics of rare adult newborn neurons. Science. 2016;353(6302):925–928.
- Braak H, Braak E, Bohl J. Staging of Alzheimer-related cortical destruction. Eur Neurol. 1993;33(6):403–408.
- Squire LR. Memory and the hippocampus: a synthesis from findings with rats, monkeys, and humans. Psychol Rev. 1992;99(2):195.
- Krishnaswami SR, Grindberg RV, Novotny M, et al. Using single nuclei for RNA-seq to capture the transcriptome of postmortem neurons. Nat Protoc. 2016;11(3):499.
- Trapnell C, Pachter L, Salzberg SL. TopHat: discovering splice junctions with RNA-Seq. Bioinformatics. 2009;25(9):1105–1111.
- Anders S, Pyl PT, Huber W. HTSeq—a Python framework to work with high-throughput sequencing data. Bioinformatics. 2015;31(2):166–169.
- Butler A, Hoffman P, Smibert P, et al. Integrating single-cell transcriptomic data across different conditions, technologies, and species. Nat Biotechnol. 2018;36(5):411.
- Zhou Y, Zhou B, Pache L, et al. Metascape provides a biologist-oriented resource for the analysis of systems-level datasets. Nat Commun. 2019;10(1):1523.
- Edgar R, Domrachev M, Lash AE. Gene Expression Omnibus: NCBI gene expression and hybridization array data repository. Nucleic Acids Res. 2002;30(1):207–210.
- Schubert V, Dotti CG. Transmitting on actin: synaptic control of dendritic architecture. J Cell Sci. 2007;120(2):205–212.
- Sekino Y, Kojima N, Shirao T. Role of actin cytoskeleton in dendritic spine morphogenesis. Neurochem Int. 2007;51(2–4):92–104.
- Mori K, Muto Y, Kokuzawa J, et al. Neuronal protein NP25 interacts with F-actin. Neurosci Res. 2004;48(4):439–446.
- Mathys H, Davila-Velderrain J, Peng Z, et al. Single-cell transcriptomic analysis of Alzheimer’s disease. Nature. 2019;1. DOI:10.1038/s41586-019-1195-2.
- Del-Aguila JL, Li Z, Dube U, et al. A single-nuclei RNA sequencing study of Mendelian and sporadic AD in the human brain. Alzheimers Res Ther. 2019;11(1):71.
- Vance JE. Dysregulation of cholesterol balance in the brain: contribution to neurodegenerative diseases. Dis Model Mech. 2012;5(6):746–755.
- Potier MC, Marquer C, Lainé J, et al. Increasing membrane cholesterol of neurons in culture recapitulates Alzheimer’s disease early phenotypes. Neurodegenerative Dis. 2015;15. DOI:10.1186/1750-1326-9-60.
- van der Kant R, Langness VF, Herrera CM, et al. Cholesterol metabolism is a druggable axis that independently regulates tau and amyloid-β in iPSC-derived Alzheimer’s disease neurons. Cell Stem Cell. 2019;24(3):363–375. e9.
- Tambini MD, Pera M, Kanter E, et al. ApoE4 upregulates the activity of mitochondria‐associated ER membranes. EMBO Rep. 2016;17(1):27–36.
- Liu Q, Zhang J. Lipid metabolism in Alzheimer’s disease. Neurosci Bull. 2014;30(2):331–345.
- Chang R, Yee KL, Sumbria RK. Tumor necrosis factor α inhibition for Alzheimer’s disease. J Cent Nerv Syst Dis. 2017;9:1179573517709278.
- Decourt B, Lahiri DK, Sabbagh MN. Targeting tumor necrosis factor alpha for Alzheimer’s disease. Curr Alzheimer Res. 2017;14(4):412–425.