
ABSTRACT
In this study, the 1975 type Japanese diet was prepared and its effects and related mechanism were examined in mice. Mice were assigned to three experimental groups, the CD group fed a control diet, the MD group fed a modern Japanese diet (MD), and the JD group fed the 1975 type Japanese diet (JD) for 4 weeks. MD and JD were low protein, high fat, and high carbohydrate diets compared to the CD. Total white adipose tissue weights were significantly increased in the MD group compared to those in the CD group and were decreased in the JD group compared to those in the MD group. In the JD group, adipocyte hypertrophy was inhibited and Hsl mRNA expression was enhanced in epididymal adipose tissue and the number of bacteria associated with the production of short chain fatty acids was increased. Therefore, the JD inhibits lipid accumulation in white adipose tissue.
Abbreviations
Actb: β-actin; ALT: alanine aminotransferase; ANOVA: analyses of variance; AST: aspartate aminotransferase; Fas: fatty acid synthase; G6pdx: glucose 6-phosphate dehydrogenase; HE: hematoxylin and eosin; HOMA-IR: Homeostatic model assessment for insulin resistance; Hsl: hormone-sensitive lipase; JD: 1975 type Japanese diet; Leptin: leptin; MD: modern Japanese diet; Me: malic enzyme; NEFA: non-esterified fatty acids; PL: phospholipids; Pparδ: peroxisome proliferator-activated receptor delta; Pparγ: peroxisome proliferator-activated receptor gamma; qRT-PCR: quantitative reverse transcriptase polymerase chain reaction; SAMP8: senescence-accelerated prone 8; SEM: standard error of the mean; Srebp1c: Sterol regulatory element binding protein 1c; TBARS: thiobarbituric acid reactive substance; TC: total cholesterol; TG: Triacylglycerol; V3: variable regions 3
Graphical abstract
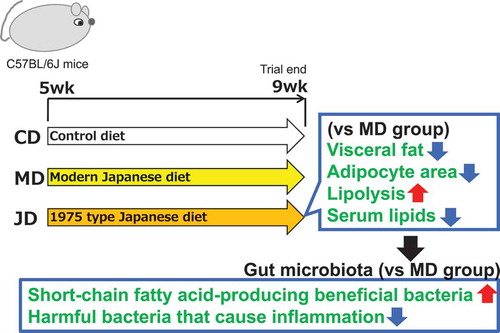
To investigate the mechanism of effects of the 1975 type Japanese diet in humans, this study investigated variations in lipid metabolism and intestinal microflora in mice.
Japan has the highest life expectancy compared to that of other countries in the world Citation[1,Citation2]. Factors contributing to this increased average life expectancy include advances in medical technology, improvements in the standard of living, and the influence of diet. Daily dietary intake has a significant impact on lifespan and is important for the maintenance of a healthy body and mind. When compared with the Western diet, the Japanese diet is low in calories comprising a higher portion of seafood such as fish, shellfish, and seaweeds, fermented foods, green tea, vegetables, fruits, and soybeans, all of which have important health benefits. Of late, global research has focused on the Japanese diet and the potential health benefits of the characteristic food ingredients included in this diet [Citation3,Citation4]. However, few studies have examined the impact of the “whole Japanese diet” including multiple ingredients. Typically, the Japanese diet incudes various food ingredients consumed at the same time leading to an intricate interaction between diverse ingredients. Accordingly, the “whole Japanese diet” was used as a test diet to evaluate its health benefits. Results of our previous study revealed that the modern Japanese diet is healthier than the modern American diet[Citation5]. However, the content of the Japanese diet has significantly changed over the past 50 years because of westernization [Citation6]. Accordingly, there has been an increase in the incidence of lifestyle-related diseases in Japan [Citation7]. Previously, to identify the Japanese diet with the best health benefit, ICR mice were fed test diets that reproduced the Japanese diet of 1960, 1975, 1990, and 2005. The ICR mice group fed the 1975 type Japanese diet showed a decrease in white adipose tissue and the activation of carbohydrate/lipid metabolism[Citation8]. Further, in the senescence-accelerated prone 8 (SAMP8) mouse, an accelerated aging model, long-term consumption of the 1975 type Japanese diet significantly enhanced the lifespan and delayed aging, indicating its potential health benefits [Citation9,Citation10].
The health characteristics of the 1975 type Japanese diet were divided into five components as described by us previously [Citation11,Citation12]. The first component comprised variety, indicating the diverse ingredients used in this diet. The second component involved the nature of cooking, as boiled, steamed, and uncooked foods were used frequently. The third component considered the composition of the foodstuff that was made from a higher proportion of soy products, seafood, vegetables, fruits, green tea, seaweed, and mushrooms. The fourth component was the common use of condiments such as soup stock and fermented seasoning (soy sauce, miso, vinegar, mirin, and liquor). The fifth component involved the form, wherein the use of cooked rice and soup was increased. The diet formulated with these characteristics was prepared as the 1975 type Japanese diet and the effectiveness was also tested in humans. There was a significant reduction in the body fat mass of healthy subjects consuming the 1975 type Japanese diet compared to that in individuals consuming the modern Japanese diet [Citation13]. In a -week randomized controlled trial, consumption of the 1975 type Japanese diet by obese subjects resulted in a significant reduction in abdominal fat and the prevention of arteriosclerosis [Citation14]. However, the comprehensive mechanism involved in this process has not yet been elucidated.
The human intestine is inhabited by approximately 100 trillion microorganisms [Citation15]. Alterations to the gut microbial flora due to diet [Citation16] and lifestyle [Citation17] have a substantial effect on the host. The association between gut microbiota and obesity and related metabolic diseases has been reported recently [Citation18]. Consequently, the gut microbial flora is considered one of the regulatory factors associated with obesity. Results of our recent study demonstrated the modifications to the human gut microflora and the associated health benefits by the 1975 type Japanese diet [Citation19]. Based on the health benefits of the 1975 type Japanese diet observed in human trials, the present study aimed to investigate the variations in lipid metabolism and intestinal bacterial flora and to elucidate the mechanism involved in vivo using mice.
Materials and methods
Preparation of test diets
The test diets used in the present study were as described previously for the human study[Citation14]. The modern Japanese diet (MD) was prepared based on the guidelines of the National Health and Nutrition Survey (NHNS) 2015 and a previous study[Citation5]. The diet with features of the Japanese diet from 1975 was prepared as the 1975 type Japanese diet (JD). The MD and JD menus were prepared for 28 days (84 servings) with the guidance of a registered nutritionist (Supplemental Tables 1 and 2). All prepared test meals (84 meals) were freeze-dried in a vacuum freeze-dryer (FD-550 R; Tokyo Rikakikai, Tokyo, Japan), homogenized by grinding and stirring, vacuum packed, and frozen at −30°C until further use. The prepared powdered sample was fed as a test feed to mice. The nutritional composition (fat, protein, water, ash, carbohydrates, and energy) of the prepared test diets was measured using the following methods: protein content by combustion, lipid by acid decomposition, moisture by vacuum oven drying, ash by direct ashing, and carbohydrates by subtracting the fat, protein, moisture, and ash contents from the total amount. Energy content was calculated using Atwater’s energy conversion factor (4, 9, and 4 kcal/g for protein, fat and carbohydrates, respectively)[Citation20].
Animals
All animal experiments were performed in accordance with the Animal Experiment Guidelines of Tohoku University (Miyagi, Japan) and the protocols were approved by the Tohoku University Animal Care and Use Committee (approval number: 2018AgA-015). Four-week-old male C57BL/6 J mice (n = 36) purchased from Japan CLEA Co., Ltd. (Tokyo, Japan) were used in the present study. The mice were housed, six per cage, in a breeding room at a room temperature of 24 ± 1°C with a 12-h light/12-h dark cycle. After 1 week of conditioning with the basal CE2 diet (Japan CLEA Co., Ltd.), mice were divided into three groups (n = 12 per group, the average body weight of mice being similar in all groups). Mice belonging to the MD group were fed the modern Japanese diet, group JD was fed the 1975 type Japanese diet, and group CD was fed the control diet (CE2). Mice had free access to their respective diet and distilled water. Body weight and food intake were measured once per week and once every 3 days, respectively. At 9 weeks of age, 12-h fasted mice were sacrificed by decapitation. Blood samples were collected and centrifuged at 3000 rpm for 15 min at 5 °C to obtain serum. The brain, heart, lungs, liver, spleen, pancreas, kidneys, and white adipose tissue were excised and weighed to determine the relative weights of the organs. The serum and organs were stored at −80°C until further use.
Biochemical analysis of serum and liver
Measurements of biochemical parameters in serum and liver samples were carried out as described previously [Citation8,Citation21]. Triacylglycerol (TG) and total cholesterol (TC) content in serum and liver samples were measured using a triglyceride E-test Wako (Wako Pure Chemical Industries, Osaka, Japan) and a total cholesterol E-test Wako (Wako Pure Chemical Industries), respectively, as per the manufacturer’s instructions. Serum phospholipids (PLs), free fatty acids or non-esterified fatty acids (NEFAs), glucose, alanine aminotransferase (ALT), and aspartic acid aminotransferase (AST) were measured using a phospholipids C-test Wako, NEFA C-test Wako, Glucose C II Test Wako, and a Transaminase C II Test Wako (Wako Pure Chemical), respectively. Serum insulin, leptin, and adiponectin were measured using a mouse insulin measuring kit (Morinaga Institute of Biological Science), mouse/rat leptin measuring kit (Morinaga Institute of Biological Science), and mouse/rat adiponectin enzyme-linked immunosorbent assay (ELISA) kit (Otsuka Pharmaceutical), respectively. Levels of PL in the liver samples were measured as described previously [Citation22]. The homeostatic model assessment for insulin resistance (HOMA-IR) ratio was calculated using the formula: fasting insulin (µU/L) × fasting glucose (nmol/L)/22.5 [Citation23]. Levels of thiobarbituric acid reactive substance (TBARS) in serum and liver samples were measured as described previously [Citation24]. The absorbance and fluorescence were measured using a microplate reader (Infinit F 200, Tecan Japan).
Histological analysis of white adipose tissue
Epididymal white adipose tissues were fixed in 10% formalin and embedded in paraffin. Vertical sections (4 µm) were cut, mounted on a glass slide, stained with hematoxylin and eosin (HE), and observed using a microscope (BZ-9000; Keyence, Osaka, Japan)[Citation25]. Adipocyte size was calculated by counting the number of cells in a constant view selected at random (10 images per mouse) [Citation26].
RNA extraction and mRNA expression analysis
Total RNA was isolated from epididymal white adipose tissue using an RNeasy lipid tissue mini kit (Qiagen, Valencia, CA, USA) as described previously [Citation24,Citation26]. The isolated RNA was eluted with 40 μL of RNase-free water and stored at −80°C until further use. quantitative reverse transcriptase polymerase chain reaction (qRT-PCR) was performed using a Thermal Cycler Dice Real Time System® (Takara Bio, Otsu, Japan) to quantify the mRNA expression levels of the following genes in white adipose tissue: β-actin (Actb), fatty acid synthase (Fas), glucose 6-phosphate dehydrogenase (G6pdx), hormone-sensitive lipase (Hsl), leptin (Leptin), malic enzyme (Me), peroxisome proliferator-activated receptor delta (Pparδ), peroxisome proliferator-activated receptor gamma (Pparγ), and sterol regulatory element binding protein 1 c (Srebp1 c). This system allows for the real-time quantitative detection of PCR products by measuring the increase in fluorescence caused by the binding of SYBR green to double-stranded DNA [Citation27,Citation28]. Briefly, cDNA was prepared from the extracted total RNA (epididymal white adipose tissue) using Prime Script® RT Master Mix (Perfect Real Time; Takara Bio) as per the manufacturer’s instructions. The cDNA was subjected to PCR amplification using SYBR® Premix Ex TaqTM (Perfect Real Time; Takara Bio) and gene-specific primers for Fas, G6pdx, Hsl, Leptin, Me, Pparδ, Pparγ, and Srebp1 c, and Actb. The primer sequences are presented in Supplemental Table 3. For each gene, the PCR amplification was performed as follows: activation at 95°C for 10 s, followed by 40 cycles at 95°C for 5 s and 60°C for 31 s, dissociation at 95°C for 15 s, 60°C for 30 s, and 95°C for 15 s. Following each reaction, melting curve analyses were performed to confirm the presence of a single reaction product. The threshold cycle (Ct) represented the PCR cycle at which an increase in reporter fluorescence above the baseline signal was first detected. The mRNA expression of each sample was normalized to that of Actb in test samples.
Analysis of gut microbiota
Intestinal bacterial DNA was extracted from mouse feces collected daily during the last week of the study period using the QI Amp DNA stool mini kit (Qiagen, Hilden, Germany). The isolated DNA from each group was pooled and quantified. The gene encoding 16 S rRNA was amplified by PCR. The composition of intestinal bacteria present in feces was examined by meta 16 S analyses as described previously [Citation19,Citation29]. Briefly, a 16 S rRNA gene amplicon sequencing PCR-reaction was prepared in a total volume of 25 µL containing 10 ng of DNA, 10 µM each of barcoded forward and reverse primer, 2× Gflex PCR buffer (Mg2+, dNTP plus; Takara Bio), and Tks Gflex DNA polymerase (Takara Bio). The forward and reverse primers used in the present study to target the 16 S rRNA variable regions 3 (V3) and V4 were as follows: 341 F (5’-TCGTCGGCAGCGTCAGATGTGTATAAGAGACAGCCTACGGGNGGCWGCAG-3’) and reverse primer 806 R (5’-GTCTCGTGGGCTCGGAGATGTGTATAAGAGACAGGGACTACHVGGGTWTCTAAT-3’), respectively. PCR conditions were as follows: 94°C for 1 min, followed by 28 cycles of 98°C for 10 s, 50°C for 15 s, and 68°C for 15 s. PCR products (10 ng of DNA each) were tagged using the Nextera XT index kit (Illumina, San Diego, CA, USA) to distinguish sample IDs. The reaction mixture contained Nextera XT index primer1, Nextera XT index primer2, 2× Gflex PCR buffer (Mg2+, dNTP plus), and Tks Gflex DNA polymerase (Takara Bio) in a total volume of 25 µL. The reaction conditions were as follows: 94°C for 1 min, followed by eight cycles of 98°C for 10 s, 60°C for 15 s, and 68°C for 15 s. Final PCR products were mixed to obtain 2 ng of DNA from each sample and were subjected to metagenomic analyses at Takara Bio.
Statistical analysis
Results are expressed as the mean ± standard error of the mean (SEM). Data were analyzed using one-way analyses of variance (ANOVA) with a Tukey-Kramer post hoc-test, where applicable. Statistical analyses were performed using BellCurve for Excel (Social Survey Research Information Co., Ltd., Tokyo, Japan) and results were considered significant when α = 0.05 (P < 0.05).
Results
Test diets
The MD prepared based on the guidelines of the 2015 NHNS and the JD incorporating five characteristic components of the Japanese diet pertaining to the year 1975 are represented in Supplemental Tables 1 and 2. Variety represented by the number of foodstuffs was 1.26-fold higher in the JD than in the MD. Cookery represented by the frequency of boiling, steaming, and raw dishes was 1.28-fold higher in the JD than in the MD. Foodstuff represented by the content of soy products, fish, shellfish, vegetables (pickles), fruits, green tea, seaweed, and mushrooms was 1.75-fold higher in the JD than in the MD. Condiments represented by the use of soup and fermented seasoning (soy sauce, miso, vinegar, mirin, and liquor) was 1.99-fold higher in the JD than in the MD. Form represented by the form of rice and soup was 1.45-fold higher in the JD than in the MD. The component composition and energy quantities of the MD and JD are summarized in . The MD and the JD were lower in protein content per 100 g, higher in fat, and higher in carbohydrates compared to those of the CD (). The JD had a significantly lower fat content per 100 g, higher protein, and enhanced carbohydrates compared to those in the MD.
Table 1. Nutritional composition of test diets (kcal %).
The effect of JD on visceral fat accumulation
Growth parameters of mice belonging to the MD, JD, and CD groups were recorded and the effect of JD consumption on body and organ weights is represented in . There was no significant difference in body weights among the three groups. Food consumption was significantly lower in the MD and JD groups compared to that in the CD group (p = 0.0000093 and p = 0.0000095, respectively). Significant differences were not detected in food consumption between the MD and JD groups. Energy intake was significantly lower in the JD group than in the CD group (p = 0.035). There was no difference in energy intake between the MD and JD groups. Weights of the brain, heart, lung, spleen, and small intestine were similar in all three experimental groups. However, weights of the liver were significantly lower in the JD group than in the CD and MD groups (p = 0.0003, p = 0.020, respectively). The weights of the pancreas and kidneys were significantly lower in the MD group than in the CD group (p = 0.011, p = 0.001, respectively) However, there was no significant difference in the weights of the pancreas and kidneys between the MD and JD groups. Weights of mesenteric adipose tissue, peri-renal adipose tissue, epididymal adipose tissue, and total white adipose tissue were significantly higher in the MD group than in the CD group (p = 0.0001, p = 0.0001, p = 0.002, and p = 0.0002, respectively) and were significantly lower in the JD group than in the MD group (p = 0.00003, p = 0.000003, p = 0.0001, and p = 0.00001, respectively). Our results indicate that consumption of the JD reduced visceral fat accumulation compared to that in the MD. However, significant differences were not detected in visceral fat accumulation between the CD and JD groups.
Table 2. Body weights, food intake and tissue weights.
Effect of the JD on adipocyte hypertrophy
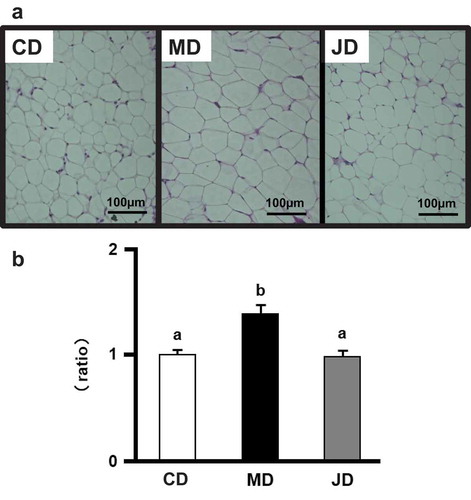
Since significant differences in weight were observed in white adipose tissue and particularly in epididymal adipose tissue, this tissue was stained with hematoxylin and eosin to visualize adipocytes. Adipocytes were larger in the MD group than in the CD and JD groups ()). The calculated adipocyte area was significantly larger in the MD group compared to the smaller area seen in the CD and JD groups (p = 0.0001 and p = 0.0001, respectively; )). Collectively, our results indicate the inhibitory effect of the JD on adipocyte hypertrophy in adipose tissue, as. compared to that with the MD.
Figure 1. Effects of the test diet on white adipose tissue in mice. (a) Epididymal adipose tissue sections from representative mice of each group (hematoxylin and eosin, scale bar = 100 µm). (b) Average sizes of adipocytes in epididymal adipose tissue. Values are shown as relative ratios with the average size of the control diet (CD) group as 1 and are represented as the mean ± standard error of the mean (SEM), n = 12. Different letters indicate significant differences between respective means at p < 0.05.
Effect of the JD on mRNA expression of genes associated with lipid metabolism
The differences in weight detected in epididymal adipose tissue and adipocyte size between the experimental groups prompted further analyses of mRNA expression of genes associated with lipid metabolism (). There was no significant difference in the mRNA expression of Fas, G6pdx, Me, and Srebp-1 c, which are associated with fatty acid synthesis, among the three groups. The mRNA expression of Hsl, associated with neutral lipolysis, was significantly higher in the JD group than in the CD and MD groups (p = 0.003, p = 0.041, respectively). Pparδ and Pparγ are involved in the regulation of adipocyte differentiation and proliferation. The mRNA expression of Pparδ was similar among the three groups. However, Pparγ mRNA was significantly increased in the JD group compared to that in the CD group (p = 0.011). The mRNA expression of Leptin was significantly higher in the MD group than in the CD group (p = 0.027). Taken together, these results suggest the differentiation and proliferation of adipocytes and the promotion of neutral lipolysis by the JD.
Table 3. mRNA expression level of lipid metabolism related gene in epididymal adipose tissue.
Effect of the JD on lipid levels in serum and liver
To investigate the effect of the JD on serum lipid and glucose levels, biochemical parameters in serum were analyzed (). Serum TG, TC, and PL were significantly higher in the MD group than in the CD group. The serum levels of these lipids were significantly lower in the JD group than in the MD group (TG, p = 0.001; TC, p = 0.025; PL, p = 0.011). Further, serum NEFA levels were significantly lower in the JD group than in the MD group (p = 0.043). The levels of serum glucose, insulin, and HOma-IR (indicators of insulin resistance) were similar among the three groups. Serum leptin was significantly higher in the MD group than in the CD group. However, a significant difference was not detected in serum leptin between the JD and CD groups. Serum TBARS and adiponectin concentrations were similar among the three groups. Serum ALT and AST (markers of hepatic injury) were significantly lower in the MD and JD groups than in the CD group (ALT, p = 0.000002 and p = 0.000002, respectively; AST, p = 0.036 and p = 0.041). These results suggest a greater reduction of serum lipids induced by the JD, as compared to that with the MD.
Table 4. Biochemical parameter in serum and liver.
To study the effect of the JD on liver function, biochemical parameters of the liver were analyzed and the results are summarized in . The concentrations of TG, TC, and TBARS in the liver were significantly higher in the MD and JD groups than in the CD group (TG, p = 0.00003 and p = 0.007, respectively; TC, p = 0.0002 and p = 0.042, respectively; TBARS, p = 0.0004 and p = 0.0005, respectively). There was no significant difference in the levels of TG, TC, and TBARS between the MD and JD groups. The concentrations of PL in the liver were similar among the three groups. Thus, there was no significant difference in the effects on liver lipid accumulation between the JD and the MD.
Gut microbiota analysis
The influence of the JD on the gut microflora was analyzed to the level of the phylum and the results are summarized in . The relative abundance of the phylum Firmicutes, known to increase with the consumption of a high fat diet, was decreased in the MD and JD groups compared to that in the CD group. However, the relative abundances of these bacteria were lower in the JD group than in the MD group. The relative abundance of the phylum Bacteroidetes, known to decrease with the consumption of a high fat diet, was increased in the MD group compared to that in the CD group. The relative abundances of these bacteria were increased in the JD group compared to those in the MD group. Thus, these results suggest a decrease in Firmicutes and an increase in Bacteroidetes induced by the JD.
Table 5. Relative abundance of the phylum level in each group.
Further analyses revealed the number of the genera to be 86. To investigate the types of bacteria that were influenced by the different test diets, the bacterial genus types were narrowed down by focusing on the genera for which the occupancy rate was more than 2-fold or less than ½-fold in the JD group compared to that in the MD group. Accordingly, 16 genera were identified (). Ten different genera were increased in the JD group compared to levels in the MD group, of which six were identified. The highest value in the JD group versus the MD group was that of the genus Bacillus, followed by AF12, Bacteroides, Dorea, Prevotella, and Dehalobacterium. Six different genera were decreased in the JD group compared to levels in the MD group and all genera were identified. The lowest value in the JD group versus the MD group was that of. the genus Bifidobacterium, followed by Allobaculum, Jeotgalicoccus, Ruminococcus, Akkermansia, and Anaerotruncus. Thus, analyses at the genus level confirmed an increase in the occupancy rate of genera that are beneficial to the host, as they produce short chain fatty acids, with the JD. In addition, the JD decreased the genera that are positively correlated with visceral fat accumulation. Therefore, our results suggested that the beneficial effect of the JD was mediated by the improved gut environment.
Table 6. Relative abundance of the genus level in each group.
Discussion
In the present study, the JD with proven health benefits for humans [Citation14] was compared with the MD and the related mechanism was elucidated by in vivo analyses of mice. Our results indicated that compared to that with the MD, the JD inhibited the accumulation of fat in the white adipose tissue of mice. The mechanism involved the ability of the JD to decrease adipocyte size and serum lipid levels, both of which were suggested to be associated with altered intestinal bacterial flora.
Although significant differences were not detected in body weight, visceral fat weight was significantly decreased in the JD group compared to that in the MD group. Thus, similar to that in humans, consumption of the JD reduced visceral fat in mice compared to that with the MD. In addition, there was a significant decrease in the size of adipocytes in white adipose tissue in the JD group compared to that in the MD group. To elucidate the mechanism involved in the health benefits associated with the JD, the mRNA expression of genes associated with lipid metabolism in epididymal adipose tissue was analyzed. PPARγ promotes adipocyte proliferation and inhibits hypertrophy [Citation30]. The activation of PPARγ in mice decreases hypertrophied adipocytes and the miniaturization of adipocytes [Citation3]. In this study, it was thought that the activation of Pparγ was one of the mechanisms associated with the inhibition of adipocyte hypertrophy induced by the JD. PPARγ has previously been reported to regulate HSL [Citation31]. HSL is a major fat lipase that catalyzes the hydrolysis of neutral fats[Citation32]. Hsl mRNA expression was enhanced in the JD group compared to that in the MD and CD groups. Accordingly, enhanced Hsl mRNA expression might have been caused by the increased expression of Pparγ.
Leptin mRNA expression and serum leptin levels were increased in the MD group but not in the JD group. Leptin is produced by adipocytes and signals satiety [Citation33]. The hypertrophy of adipocytes is positively correlated with Leptin mRNA expression [Citation34,Citation35]. In the JD group, reduced adipocyte areas were responsible for the inhibition of leptin production. Further, serum TG, TC, PL, and NEFA were significantly lower in the JD group than in the MD group. Thus, consumption of the JD decreased serum lipids compared to that with the MD.
Intestinal bacterial flora of the host is altered by the influence of the surrounding environment including diet [Citation16], antibiotics [Citation36], pathogens [Citation37], and lifestyle [Citation17]. The association between the intestinal bacterial flora and obesity and metabolic diseases has been reported recently [Citation18]. Members of the phylum Bacteroidetes and Firmicutes dominate the intestinal bacterial flora. In obese subjects, there is a decrease in Bacteroidetes and an increase in Firmicutes [Citation38]. In this study, consumption of the JD decreased the number of Firmicutes and increased Bacteroidetes with a decrease in the weight of the white adipose tissue, as compared to those with the MD. It was suggested that the altered balance of the intestinal bacterial flora is one factor responsible for the inhibition of fat accumulation observed in the JD group.
Analyses at the genus level revealed that the highest value in the JD group versus the MD group was that of the genus Bacillus. The genus Bacillus includes Bacillus subtilis (natto) [Citation39]. Hence, it is speculated that enhanced natto in the JD compared to that in the MD was one factor responsible for the increase in the genus Bacillus detected in the JD group. The consumption of oligosaccharides and branched chain amino acids increases the number of bacteria belonging to the genus AF12 in mice [Citation40,Citation41]. Bananas and onions are rich in oligosaccharides[Citation41], and branched chain amino acids are found in tuna, bonito, horse mackerel, saury, soybean, egg, cheese, beef, and chicken [Citation42]. In the present study, the prepared JD contained many foodstuffs rich in branched chain amino acids and oligosaccharides and might have contributed to the increased number of bacteria of the genus AF12 seen in the JD group. In addition, in the JD group, there was an increase in the number of unclassified bacteria belonging to the RF32 family. Previous studies have reported an increase in the number of bacteria belonging to the family RF32 in rats fed barley malt, which positively correlated with the concentration of butyric acid in the cecum [Citation43]. Short chain fatty acids such as butyric acid activate energy metabolism through receptor-mediated signaling. The activated short chain fatty acid receptor GPR41 activates sympathetic nerves and enhances energy expenditure [Citation44]. Moreover, the activated short chain fatty acid receptor GPR43 inhibits obesity by inhibiting the accumulation of fat [Citation44]. Bacteria belonging to the family RF32 promote the production of butyric acid. Thus, the inhibition of fat accumulation in the JD group might have been mediated by the JD-induced increase in the number of bacteria belonging to the family RF32. The genus Bacteroides includes bacteria that can degrade dietary fibers present in seaweed and is a part of the gut microflora of Japanese individuals who consume seaweed regularly [Citation45]. A decreased number of bacteria belonging to the genus Bacteroides has been reported in obese subjects [Citation46], and this increases with intervention tests in which obese people are subjected to calorie-restricted diet and exercise [Citation17]. Thus, it was suggested that the increased number of bacteria belonging to the genus Bacteroides in the JD group was associated with the seaweed present in the consumed JD and is responsible for the inhibition of fat accumulation. Bacteria belonging to the genus Dorea are increased in lean human subjects and increased with the consumption of dietary fibers such as arabinogalactan and inulin [Citation47]. One of the factors responsible for the increased number of bacteria belonging to the genus Dorea in the JD group was an increase in dietary fiber present in the JD. Bacteria belonging to the family Erysipelotrichaceae have been shown to have low occupancy in patients with type 2 diabetes [Citation48], suggesting a reduced risk of type 2 diabetes in the JD group. Bacteria belonging to the family Rikenellaceae are increased by the administration of oligosaccharides in constipated mice [Citation40]. The increase in the number of bacteria belonging to the family Rikenellaceae seen in the JD group was associated with the consumption of foods rich in oligosaccharides such as onions present in the JD. Bacteria belonging to the genus Prevotella are enterotypes of humans, which increase with the increased consumption of carbohydrates [Citation49] and decrease with restricted carbohydrate consumption [Citation50]. The increased content of carbohydrates present in the JD was responsible for the increased number of bacteria belonging to the genus Prevotella in the JD group. Bacteria belonging to the family F16 were increased in mice fed branched chain amino acids [Citation51]. The increase in the number of bacteria belonging to the F16 family in the JD group was associated with the consumption of food rich in branched chain amino acids such as bean, saury, soybean, egg, cheese, and beef, which are present in the JD [Citation42]. A high fat diet decreases the number of bacteria belonging to the genus Dehalobacterium in an atherosclerosis mouse model (ApoE−/- mice) and is negatively correlated with the risk of arteriosclerotic heart disease [Citation52]. It was suggested that an increase in the number of bacteria belonging to the genus Dehalobacterium is responsible for the decreased serum lipid levels in the JD group, which reduces the risk of arteriosclerosis.
The lowest value in the JD group was that of the genus Anaerotruncus. Bacteria that decreased in the JD group compared to levels in the MD group belonged to the genus Anaerotruncus. A high fat diet was found to increase the number of bacteria belonging to the genus Anaerotruncus compared to that in rats fed a normal diet [Citation53]. Bacteria belonging to the genus Anaerotruncus are significantly decreased in mice fed diets supplemented with short chain fatty acid salts compared to numbers in those fed a high fat diet [Citation54]. The decrease in bacteria of the genus Anaerotruncus in the JD group might indicate an increase in short chain fatty acids in the intestinal tract. Bacteria cultured in mucin as the sole nutrient source belong to the genus Akkermansia[Citation55]. Leptin stimulates the production of mucin, a viscous substance covering the mucosal surface of the stomach and intestines [Citation56]. In leptin-deficient mice, the occupancy of Akkermansia muciniphila is markedly low [Citation57], suggesting the involvement of the members of this genus in leptin-mediated mucin production. Leptin is primarily produced by adipocytes [Citation35]. Thus, the decreased white adipose tissue in the JD group resulted in decreased leptin production and associated bacteria. The genus Ruminococcus is positively correlated with body weight and BMI [Citation58] and negatively with the consumption of fruits and whole wheat [Citation59]. It was suggested that enhanced fruits and dietary fiber present in the JD decrease the number of bacteria belonging to the genus Ruminococcus in the JD group and are responsible for the reduction in visceral fat. Staphylococci belonging to the genus Jeotgalicoccus are decreased in mice fed the antioxidant polyphenol lignan [Citation60]. The greater amount of polyphenol in the JD lowered the number of bacteria belonging to the genus Jeotgalicoccus in the JD group. The number of bacteria belonging to the genus Allobaculum was found to be decreased in mice fed a high fat diet and tea (green tea, black tea, oolong tea) compared to that in animals fed a high-fat diet and was positively correlated with body weight, white adipose tissue weight, serum glucose, TC, TG, LDL-C, and HDL-C [Citation61]. It was suggested that the decreased fat accumulation seen in the JD group is related to the decreased number of bacteria belonging to the genus Allobaculum.
Bifidobacterium is widely studied and is known to lower intestinal toxins and to improve the mucosal barrier function [Citation62,Citation63]. In this study, this bacterium was significantly decreased in the JD group. In humans, calorie restriction and exercise intervention trials reported a decrease in the number of Bifidobacterium bifidum and Bifidobacterium breve and an increase in Bifidobacterium catenulatum[Citation17]. In addition, a positive correlation was seen with serum leptin in rats [Citation64]. It was suggested that the calorie restriction-like effect of the JD [Citation8,Citation10] and reduced serum leptin seen in the JD group are associated with the decrease in the number of bacterial belonging to the genus Bifidobacterium. Thus, the number, composition, and activity of diversified intestinal bacteria, together, might mediate the anti-obesity effect of the JD.
To determine what food components are important, we calculated the nutrient contents of the JD and MD (Supplemental Table 4). These values were calculated based on the Standard Tables of Food Composition in Japan −2015- (Seventh Edition). The mineral and vitamin contents of the test diets were higher in the JD than in the MD. Fish, fruits, vegetables, seaweed, soybean foods, soup stock, and fermented seasoning contain many of the aforementioned components. The significant health benefits associated with the intake of diets with enhanced levels of these foodstuffs have been demonstrated[Citation11]. Therefore, our study’s findings might be a reflection of the results of these studies. The present study identified the mechanism associated with the health benefits of JD. The consumption of JD increased the number of useful bacteria in the host and was effective in reducing the weight of white adipose tissue, miniaturizing adipocytes, and decreasing the levels of serum lipids.
Authors’ Contributions
MA, and TT formulated the research question. MA, and TT designed the study. FN, EN, MA and TT performed the experiments. MA, and TT analyzed the data and wrote the manuscript. All authors read and approved the final manuscript.
Ethics approval and consent to participate
Protocols for the animal experiment were approved by the Animal Use Committee of the Faculty of Agriculture, The Tohoku University (permit no: 2018AgA-015).
Supplemental_Tables.pdf
Download PDF (302.5 KB)Acknowledgments
We gratefully acknowledge the work of past and present members of our laboratory.
Disclosure statement
The authors declare that they have no competing interests.
Supplementary material
Supplemental data for this article can be accessed here.
Additional information
Funding
References
- Minister of Health, Labour and Welfare. 2015 abridged life table International ratio of life expectancy [WWW document]; 2016. Available from: http://www.mhlw.go.jp/toukei/saikin/hw/life/life15/index.html
- Minister of Health, Labour and Welfare. 2015 abridged life table. [WWW document]. Available from: http://www.mhlw.go.jp/toukei/saikin/hw/life/life15/index.html
- Sakamoto Y, Naka A, Ohara N, et al. Daidzein regulates proinflammatory adipokines thereby improving obesity-related inflammation through PPARγ. Mol Nutr Food Res. 2014;58:718–726.
- Shimizu T, Mori K, Ouchi K, et al. Effects of dietary intake of japanese mushrooms on visceral fat accumulation and gut microbiota in mice. Nutrients. 2018 May 14;10(5):E610. .
- Tsuduki T, Takeshika N, Nakamura Y, et al. DNA microarray analysis of rat liver after ingestion of Japanese and American food. J Jpn Soc Nutr Food Sci. 2008;61:255–264.
- Ministry of Agriculture, Forestry and Fisheries. Food balance sheet; 2015.
- Ministry of Agriculture, Forestry and Fisheries. Patients survey. [WWW document].
- Kitano Y, Honma T, Hatakeyama Y, et al. Effects of historical differences in components of the Japanese diet on the risk of obesity in mice. Nippon Eiyo Shokuryo Gakkaishi. 2014;67:73–85.
- Yamamoto K, S E, Hatakeyama Y, et al. The Japanese diet from 1975 delays senescence and prolongs life span in SAMP8 mice. Nutrition. 2016;32:122–128.
- Honma T, Kitano Y, Kijima R, et al. Comparison of the health benefits of different eras of Japanese foods: lipid and carbohydrate metabolism focused research. Nippon Shokuhin Kagaku Kogaku Kaishi. 2013;60:541–553.
- Iwagaki Y, Sakamoto Y, Sugawara S, et al. Identification of characteristic components and foodstuffs in healthy Japanesediet and the health effects of a diet with increased use frequency of thesefoodstuffs. Mol Nutr Food Res. 2017 Dec;61(12):DOI:10.1002/mnfr.201700430
- Tsuduki T. Influence of Japanese food on senility and health maintenance. Yakugaku Zasshi. 2015;135(1):57–65.
- Sugawara S, Kushida M, Iwagaki Y, et al. The 1975 type Japanese diet improves lipid metabolic parameters in youngeradults: A randomized controlled trial. J Oleo Sci. 2018;67(5):599–607.
- Asano M, Kushida M, Yamamoto K, et al. Abdominal fat in overweight individuals reduced by the consumption of a1975 Japanese diet: a randomized controlled trial. Obesity (Silver Spring). 2019 Jun;27(6):899–907. .
- Gill SR, Mihai Pop RT, Deboy PB, et al. Metagenomic analysis of the human distal gut microbiome. Nature. 2015;299:1874–1877.
- Murphy EF, Cotter PD, Healy S, et al. Composition and energy harvesting capacity of the gut microbiota: relationship to diet, obesity and time in mouse models. Gut. 2010. DOI:10.1136/gut.2010.215665
- Santacruz A, Marcos A, Wärnberg J, et al. Interplay between weight loss and gut microbiota composition in overweight adolescents. Obesity. 2009;17:1906–1915.
- Tehrani AB, Nezami BG, Gewirtz A, et al. Obesity and its associated disease: A role for microbiota? Neurogastroenterol Motil. 2012;24:305–311.
- Kushida M, Sugawara S, Asano M, et al. Effects of the 1975 Japanese diet on the gut microbiota in younger adults. J Nutr Biochem. 2019Feb;64:121–127.
- Mizowaki Y, Sugawara S, Yamamoto K, et al. Comparison of the effects of the 1975 Japanese diet and the modern Mediterranean diet on lipid metabolism in mice. J Oleo Sci. 2017;66:507–519.
- Iwagaki Y, Sugawara S, Huruya Y, et al. The 1975 Japanese diet has a stress reduction effect in mice: search for physiological effects using metabolome analysis. Biosci Biotechnol Biochem. 2018 Apr;82(4):709–715. .
- Rouser G, Fleischer S, Yamamoto A. Two dimensional thin layer chromatographic separation of polar lipids and determination of phospholipids by phosphorus analysis of spots. Lipids. 1970;5:494–496.
- Matthews DR, Hosker JP, Rudenski AS, et al. Homeostasis model assessment: insulin resistance and β-cell function from fasting plasma glucose and insulin concentrations in man. Diabetologia. 1985;28:412–419.
- Yamamoto K, Iwagaki Y, Watanabe K, et al. Effects of a moderate-fat diet enriched with fish oil on intestinal lipidabsorption in a senescence-accelerated prone mouse model. Nutrition. 2018Jun;50:26–35.
- Ishikawa H, Guo X, Sugawara S, et al. Effect of the Japanese diet during pregnancy and lactation or post-weaningon the risk of metabolic syndrome in offspring. Biosci Biotechnol Biochem. 2018 Mar;82(3):515–524. .
- Tsuduki T, Yamamoto K, Shuang E, et al. High dietary fat intake during lactation promotes the development of social stress-induced obesity in the offspring of mice. Nutrients. 2015;7:5916–5932.
- Shuang E, Kijima R, Honma T, et al. 1-Deoxynojirimycin attenuates high glucose-accelerated senescence in human umbilical vein endothelial cells. Exp Gerontol. 2014;55:63–69.
- Honma T, Shinohara N, Ito J, et al. High-fat diet intake accelerates aging, increases expression of Hsd11b1, and promotes lipid accumulation in liver of SAMP10 mouse. Biogerontology. 2012;13:93–103.
- Kushida M, Okouchi R, Iwagaki Y, et al. Fermented soybean suppresses visceral fat accumulation in mice. Mol Nutr Food Res. 2018 Sep;62(17):e1701054.
- Majithia AR, Flannick J, Shahinian P, et al. Rare variants in PPARG with decreased activity in adipocyte differentiation are associated with increased risk of type 2 diabetes. Proc Natl Acad Sci. 2014;111:13127–13132.
- Shen WJ, Yu Z, Patel S, et al. Hormone-sensitive lipase modulates adipose metabolism through PPARγ. Biochim Biophys Acta - Mol Cell Biol Lipids. 2011;1811:9–16.
- Schweiger M, Schreiber R, Haemmerle G, et al. Adipose triglyceride lipase and hormone-sensitive lipase are the major enzymes in adipose tissue triacylglycerol catabolism. J Biol Chem. 2006;281:40236–40241.
- Soukas A, Cohen P, Socci ND, et al. Leptin-specific patterns of gene expression in white adipose tissue. Genes Dev. 2000;14:963–980.
- Zhang Y, Guo K-Y, Diaz PA, et al. Determinants of leptin gene expression in fat depots of lean mice. Am J Physiol - Regul Integr Comp Physiol. 2002;282:R226–R234.
- Rosenbaum MLR. The role of leptin in human physiology. N Engl J Med. 1999;341:913–915.
- Ferrer M, VAP MDS, SJ O, et al. Gut microbiota disturbance during antibiotic therapy: A multi-omic approach. Gut Microbes. 2014;5:64–70.
- Nelson AM, Walk ST, Taube S, et al. Disruption of the human gut microbiota following norovirus infection. PLoS One. 2012;7:e48224.
- Ley RE, Turnbaugh PJ, Klein S, et al. Human gut microbes associated with obesity. Nature. 2006;444:1022.
- Nakamura T, Yamagata Y, Ichishima E. Nucleotide sequence of the subtilisin NAT Gene, aprN, of bacillus subtilis (natto). Biosci Biotechnol Biochem. 1992;56:1869–1871.
- Wang L, Pan M, Li D, et al. Metagenomic insights into the effects of oligosaccharides on the microbial composition of cecal contents in constipated mice. J Funct Foods. 2017;38:486–496.
- Soni MG, Tsai H GRAS notification for Fructooligosaccharides; 2016.
- Japan Society of Nutrition and Food Science. Free amino acid content table of food [WWW document]; 2018. Available from: http://www.jsnfs.or.jp/database/database_aminoacid.html
- Zhong Y, Nyman M, Fåk F. Modulation of gut microbiota in rats fed high-fat diets by processing whole-grain barley to barley malt. Mol Nutr Food Res. 2015;59:2066–2076.
- Kimura I. Host energy regulation via SCFAs receptors, As dietary nutrition sensors, By gut microbiota. Yakugaku Zasshi. 2014;134:1037–1042.
- Hehemann JH, Correc G, Barbeyron T, et al. Transfer of carbohydrate-active enzymes from marine bacteria to Japanese gut microbiota. Nature. 2010;464:908–912.
- Liu R, Hong J, Xu X, et al. Gut microbiome and serum metabolome alterations in obesity and after weight-loss intervention. Nat Med. 2017;23:859–868.
- Aguirre M, De Souza CB, Venema K. The gut microbiota from lean and obese subjects contribute differently to the fermentation of arabinogalactan and inulin. PLoS One. 2016;11:1–18.
- Inoue R, Ohue-Kitano R, Tsukahara T, et al. Prediction of functional profiles of gut microbiota from 16S rRNA metagenomic data provides a more robust evaluation of gut dysbiosis occurring in Japanese type 2 diabetic patients. J Clin Biochem Nutr. 2017;61:217–221.
- Wu GD, Chen J, Hoffmann C, et al. Linking long-term dietary patterns with gut microbial enterotypes. Science. 2011;334:105–109.
- Durbán A, Abellán JJ, Latorre A, et al. Effect of dietary carbohydrate restriction on an obesity-related prevotella-dominated human fecal microbiota. Metagenomics. 2013;2:1–4.
- Yang Z, Huang S, Zou D, et al. Metabolic shifts and structural changes in the gut microbiota upon branched-chain amino acid supplementation in middle-aged mice. Amino Acids. 2016;48:2731–2745.
- Chan YK, Brar MS, Kirjavainen PV, et al. High fat diet induced atherosclerosis is accompanied with low colonic bacterial diversity and altered abundances that correlates with plaque size, plasma A-FABP and cholesterol: a pilot study of high fat diet and its intervention with Lactobacillus rhamno. BMC Microbiol. 2016;16:1–13.
- Bortolin RC, Vargas AR, Gasparotto J, et al. A new animal diet based on human Western diet is a robust diet-induced obesity model: comparison to high-fat and cafeteria diets in term of metabolic and gut microbiota disruption. Int J Obes (Lond). 2018;42:525–534.
- Lu Y, Fan C, Li P, et al. Short chain fatty acids prevent high-fat-diet-induced obesity in mice by regulating g protein-coupled receptors and gut Microbiota. Sci Rep. 2016;6:1–13.
- Derrien M, Vaughan EE, Plugge CM, et al. Akkermansia municiphila gen. nov., sp. nov., a human intestinal mucin-degrading bacterium. Int J Syst Evol Microbiol. 2004;54:1469–1476.
- El HM, Ducroc R, Claustre J, et al. Leptin modulates the expression of secreted and membrane-associated mucins in colonic epithelial cells by targeting PKC, PI3K, and MAPK pathways. Am J Physiol Liver Physiol. 2007;293:G365–G373.
- Ellekilde M, Krych L, Hansen CHF, et al. Characterization of the gut microbiota in leptin deficient obese mice - Correlation to inflammatory and diabetic parameters. Res Vet Sci. 2014;96:241–250.
- Upadhyaya B, McCormack L, Fardin-Kia AR, et al. Impact of dietary resistant starch type 4 on human gut microbiota and immunometabolic functions. Sci Rep. 2016;6:1–12.
- Pallister T, Jackson MA, Martin TC, et al. Hippurate as a metabolomic marker of gut microbiome diversity: modulation by diet and relationship to metabolic syndrome. Sci Rep. 2017;7:1–9.
- Cho SY, Kim J, Lee JH, et al. Modulation of gut microbiota and delayed immunosenescence as a result of syringaresinol consumption in middle-aged mice. Sci Rep. 2016;6:1–15.
- Liu Z, Chen Z, Guo H, et al. The modulatory effect of infusions of green tea, oolong tea, and black tea on gut microbiota in high-fat-induced obese mice. Food Funct. 2016;7:4869–4879.
- Arunachalam K, Gill HS, Chandra RK. Enhancement of natural immune function by dietary consumption of Bifidobacterium lactis (HN019). Eur J Clin Nutr. 2000;54:263–267.
- Ewaschuk JB,Diaz H, Meddings L, et al. Secreted bioactive factors from bifidobacterium infantis enhance epithelial cell barrier function. Am J Physiol Gastrointest Liver Physiol. 2008;295:G1025–G1034.
- Queipo-Ortuño MI, Seoane LM, Murri M, et al. Gut microbiota composition in male rat models under different nutritional status and physical activity and its association with serum leptin and ghrelin levels. PLoS One. 2013;8:e65465.