
Abstract
The traditional method to measure release of components from CLs is a vial containing a static volume of PBS (phosphate buffered saline). However, this model does not simulate physiologically relevant tear volume and natural tear flow, air exposure, and mechanical rubbing. These factors can significantly impact release kinetics. We have developed an in vitro eye model (OcuFlow) that simulates these parameters. The aim of the study was to measure the release of PEG (polyethylene glycol), and HPMC (hydroxypropyl methylcellulose) from a daily disposable hydrogel contact lens material (nelfilcon A; Dailies AquaComfort PLUS; DACP;) over 24 hrs using the OcuFlow platform. The elution of PEG and HPMC from DACP lenses was analyzed using LCMS (liquid chromatography mass spectrometry). The release of all wetting agents from the lenses followed a burst release pattern, which occurred within the first 1.5 hrs (P < 0.05). The release of PEG was greater than that of HPMC (P < 0.05). The amount of PEG and HPMC released at any given time was less than 1% of the amount in the blister pack solution. Our results suggest that HPMC and PEG are rapidly released from the CL.
Introduction
Contact lens discomfort (CLD) continues to be a major driver of contact lens (CL) dropout [Citation1–3], and as a consequence there is a demand to increase comfort with new CL materials to limit the numbers of wearers who cease lens wear [Citation4]. One strategy is to design materials that can release moisturizing agents over time to continuously provide comfort throughout the day [Citation5–10]. The release of a wetting agent, PVA (polyvinyl alcohol), from a CL was first noted in the original Focus Dailies product, which is based on nelfilcon A [Citation10]. This led to the second generation product, Focus DAILIES with AquaRelease/AquaComfort, which was specifically designed to contain five times more unbound PVA available for release [Citation6,Citation9]. A further upgrade brought about the third and current commercial version, Alcon Dailies AquaComfort PLUS (DACP), in which two additional moisturizing agents were added for increased comfort on insertion and across the day [Citation10,Citation11]. In this latest version, HPMC (hydroxypropyl methylcellulose) is added to the packaging solution in the foil blister pack in which the lens is shipped, to provide enhanced comfort on insertion. In addition, PEG (polyethylene glycol) is also added to the packing solution and associates with PVA molecules within the lens matrix, prolonging its presence in the lens [Citation11]. Information from the manufacturer suggests that HPMC lubricates on insertion, PEG releases early in the day into the tear film, and PVA releases through a blink-activated mechanism all day, in an attempt to improve comfort across the entire day, with a particular aim of improving end-of-day comfort [Citation11].
Drug delivering contact lens materials have attracted much attention over the last decade [Citation12–16] and this concept of a slow release, “drug-delivery” lens material that can slowly deliver wetting agents to enhance comfort and reduce CLD could be applied to the development of other lens materials. However, to-date there is very limited data available on the release profile of these wetting agents from the DACP lens [Citation10], and this sole publication examined the release of PVA alone as it occurred prior to the introduction of the latest commercial material.
There are two significant challenges in understanding the underlying release mechanism of these wetting agents from the lens material. The first is being able to detect them with a high degree of sensitivity and specificity. Regrettably, these polymers do not contain a UV chromophore, so simple spectrophotometric detection is not possible [Citation17–19]. More sophisticated analytical methods, such as electrospray ionization coupled to liquid chromatography mass spectrometry (ESI-LCMS) are required to detect PEG and HPMC. The second challenge is to develop a model capable of suitably simulating the ocular environment in which the lenses reside when on-eye. The methods described by Winterton and colleagues [Citation10] show that the nelfilcon A lenses were extracted in volumes of fluid that ranged from 100µL to 5 mL, which are much larger than the very small amount of tear fluid in which CL typically reside, with the tear fluid volume being typically in the range of 7 ± 2 µL [Citation20], and the measured physiological flow-rate of tears is between 0.95 and 1.55 µL/min (1.4–2.2mL/day) [Citation21].
The traditional method to measure release kinetics of drugs from CLs is a vial containing a static volume of PBS (phosphate buffered saline) [Citation22–27]. However, this model does not simulate appropriate tear volume and natural tear flow [Citation20,Citation21], air exposure, and mechanical rubbing, which are factors which can significantly impact release kinetics. We have recently developed an in vitro model (OcuFlow) that allows lenses to be examined on a corneal-shaped profile that exposes the lens to a blink-actuator that mimics the action of the lid blinking, mimics the inter-blink period, and also flows an artificial tear fluid over the lens at physiologically relevant rates of replenishment and quantity, and permits any elute from the lens to be captured and subsequently analysed [Citation22,Citation28–32].
Given the technical challenges of investigating the release of these wetting agents from soft lens materials, the aim of this study was to measure the progressive release of PEG and HPMC from DACP over 24 hrs using the recently developed in vitro blink platform. Understanding these release rates would provide valuable information for the future development of CL-releasing drug delivery platforms and CL materials that could release comfort-enhancing agents. The release of PVA using this platform will be the topic for another manuscript.
Materials and methods
Reagents
PEG and HPMC are polymers of variable molecular weights (MW). The information on the MW of these polymers for DACP is proprietary, so representative commercial standards were chosen. All reagents and commercial standards of PEG (polyethylene glycol) MW = 200, 600, 1500 Da and HPMC (hydroxypropyl methylcellulose) MW = 22 kDA were obtained from Sigma Aldrich (St. Louis, Missouri).
Contact lenses
DACP (nelfilcon A, Alcon) lenses, containing PEG and HPMC, were tested in this study. The lenses were obtained in their original packaging, expiry date 2019, with a dioptric power of −3.00 and base curve of 8.6 mm. Solutions taken from 1-Day Acuvue Moist (etafilcon A, Johnson & Johnson) and Biomedics 1 Day (ocufilcon B, CooperVision) blister packages were used as negative controls. The known properties of the CLs and their blister pack solutions are listed in . Before testing, the lenses were removed from the blister pack, rinsed lightly for 1 second with Milli-Q water and gently dabbed on the edge of the lens on lens paper to remove excess solution.
Table 1. Properties of the lens materials used in the study.
LCMS analysis of PEG and HPMC
ESI-LCMS experiments were carried out at the mass spectrometry (MS) facility at the University of Waterloo. ESI-MS of PEG and HPMC were performed on the Thermo Scientific Q-Exactive Orbitrap (Waltham, Massachusetts) using the built-in LCMS software interface (Excalibur). Standard samples of PEG and HPMC were characterized by infusion at 10 µL/min to optimize the in-source collision-induced dissociation (CID) approach and to characterise the resulting fragment ions. For MS, the scanning parameters was set to full MS with a scan range between 100.0 and 750 m/z. In-source CID was set to 25 eV (low), polarity positive, with a mass resolution at 70, 000. The electrospray source was heated to 300 °C.
The separation was carried out using 12 minute HPLC run on a polystyrene-divinylbenzene column (PLRP-S 100A, 2.1 × 50 mm, 5 µm, Agilent Technologies) with an water-acetonitrile (0.1% formic acid) mobile phase. Samples were injected into a 100% water mobile phase (0.5 minute hold) and eluted upon ramping to 80% ACN over 6 minutes followed by a 2 minute hold at this mobile phase composition. The column was re-equilibrated at the initial conditions for 3.5 minutes prior to the next injection. The first 1.5 and last 3.25 minutes were diverted to waste. Full MS analysis was carried out between 1.5 and 8.5 minutes over which the analytes eluted from the column. The area under the curve and retention time for each MS peak was determined using Genesis (Excalibur’s built in algorithm software).
Standard curve generation
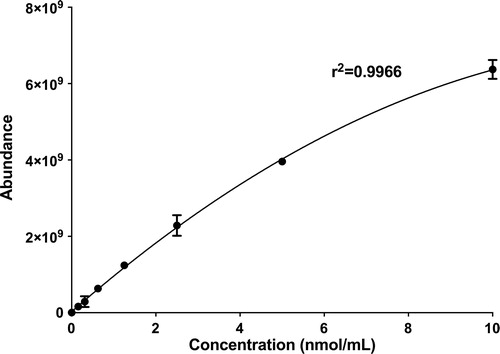
Commercial standards of PEG (200 Da), and HPMC (22 kDA) were used to generate the two standard curves for each wetting agent in this study, one for each unique fragment ion. Each wetting agent was prepared to a stock concentration of 10 nmol/mL in Milli-Q water. This stock concentration was then serially diluted to 10, 5, 2.5, 1.25, 0.625, 0.3125, 0.15625 nmol/mL in Milli-Q water to generate the standard curve for each respective wetting agent (n = 3). For sample analysis, all samples were diluted to the concentration range of the standard curve (0–10 nmol/mL). The 177.13 m/z ion of PEG and 155.071 m/z ion of HPMC were used to calculate the concentrations of PEG and HPMC respectively.
OcuFlow system and parameters
The overall setup of the OcuFlow platform is shown in . The system is composed of eye and eyelid pieces which are mounted on a blink platform, consisting of two mechanical actuators. The eyelid piece moves laterally to simulate the intermittent air exposure produced between blinks. When the eyelid component comes in contact with the eyepiece, the second motor rotates the corneal eyepiece in a circular fashion to simulate the mechanical wear generated during blinking. The OcuFlow platform is coupled to a microfluidic syringe pump (PHD UltraTM, Harvard Apparatus, Holliston, Massachusetts, US) which infuses the eyelid piece with artificial tear fluid. Similar to an actual eye, the tear fluid enters the eyelid through tubing positioned superiorly in the eyelid. As a consequence, the lateral and circular motions generated by the eyelid and corneal eyepiece spread the tear fluid evenly over the eyepiece. The platform is controlled by an Arduino electronic board, which can be programmed to specify the desired air exposure time and rate of rotations. The flow-through fluid is collected in a standard 12-well plate placed below the eyepiece construction for subsequent analysis [Citation29]. In this study, for compatibility with MS, Milli-Q water was used as the flow-through fluid.
Figure 1. Features of the OcuFlow in vitro eye model: A corneal eyepiece and lid housing the contact lens B Inlet for tear flow C lateral motion to simulate air exposure D rotational motion to generate frictional wear E 12-well collecting plate.
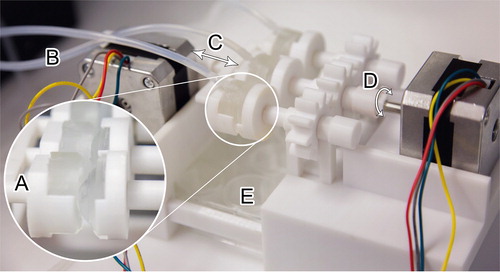
In this study, the flow rate was set to 6.9 µL/min (10 mL/day). The collection time intervals were between 0–0.5, 1–1.5, 4–4.5, and 23–23.5 hrs, in which 100 µL of solution was collected between these time intervals. The measured physiological flow-rate in tears is between 0.95 and 1.55 µL/min (1.4–2.2mL/day) [Citation21]. However, due to humidity and evaporation, to be able to obtain similar flow rates on the OcuFlow, the input flow rate was set at 6.9 µL/min (10 mL/day), which translates to approximately 5 mL/day of collectable fluid. The higher flow rate was also necessary to be able to collect enough sample volume for analysis. The cycle for air exposure and mechanical rubbing was set to 6.5 times/minute. The average physiological blink rate is between 11 and 19 blinks/min, but this rate is too fast for the current system [Citation33].
Statistical analysis
Statistical analysis was performed using Statistica 8 software (StatSoft, Tulsa, OK). All data are reported as mean ± standard deviation, unless otherwise stated. Repeated measures analysis of variance (RM-ANOVA) were performed to determine the differences across various time-points. An ANOVA was conducted to determine the differences between wetting agents at each time-point. Post-hoc Tukey multiple comparison tests were used when necessary. In all cases, statistical significance was considered significant for a P value of <0.05. Graphs were plotted using GraphPad Prism version 7.0 (GraphPad Software, La Jolla, CA).
Results
ESI-LCMS experiments with PEG and HPMC showed distinctive peaks representative of the polymer. As shown in , PEG polymers produce ions with m/z 133.0862 and 177.1124, while HPMC produces unique fragments of m/z 155.0705 and 173.0812. These ions were used to detect and quantify these polymers during the ESI-LCMS analysis. These characteristic ions from PEG and HPMC () were formed irrespective of the MW distribution of the polymer analyzed, that is, all PEG polymer oligomers form these ions.
Figure 2. Representative ESI-MS spectra for A PEG 1.5 kDA and B HPMC 22 kDA at 10 nmol/mL.
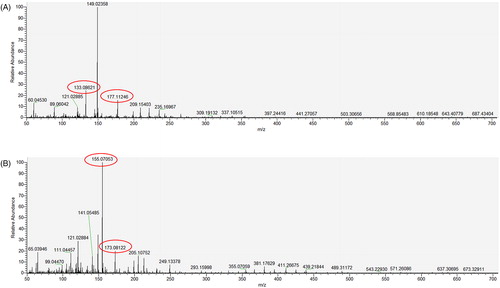
Table 2. Fragment ions of PEG and HPMC at CID =25 eV.
LC was used to estimate the MW of PEG and HPMC within the DACP blister pack. According to the chromatograms, shown in , the elution time of the HPMC in the blister pack is fairly similar to that of the HPMC 22 kDA. The chromatogram for PEG in the blister pack suggests that it is likely a mixture of different MWs PEG between 200 and 600 Da. The standard curves for PEG and HPMC are shown in and .
Figure 3. Representative LCMS chromatograms of A HPMC 22 kDA (m/z 155.0705) B PEG 600 (m/z 133.0862) C PEG 200 (m/z 133.0862) at 10 nmol/mL and D DACP blister pack 5x diluted (m/z 133.0862 for PEG, m/z 155.0705 for HPMC).
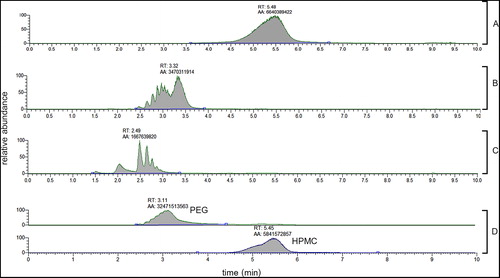
Figure 4. Standard curve for PEG 200 (m/z177.1124) with standard deviation for n = 3.
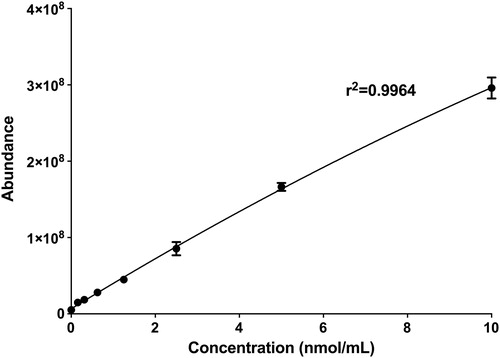
Figure 5. Standard curve for HPMC (m/z 155.0705) with standard deviation for n = 3.
Based on the standard curves, the total amounts (µg) of each wetting agent (PEG and HPMC) calculated to be contained in the CL blister packs are shown in . The amount of PEG in the blister pack solution is approximately 24X higher than HPMC. Only trace amounts of PEG was detected in the other blister pack solutions.
Table 3. Total amount of PEG and HPMC in blister packs for ocufilcon B (1 mL), etafilcon A (0.8 mL) and nelfilcon A (0.8 mL).
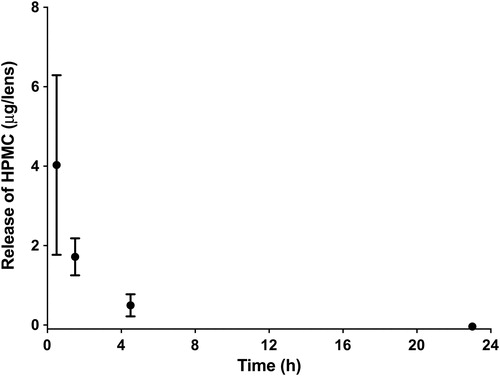
and shows the release of these wetting agents from the nelfilcon A lenses when exposed to the OcuFlow system over 24 hrs. The amount of wetting agent released is significantly different at all time-points (P < 0.05). PEG release was higher than HPMC (P < 0.05). The release of both wetting agents follows a burst release pattern, which occurred within the first 1.5 hrs (P < 0.05). The amount of wetting agent released at any given time was less than 1% of the amount in the blister pack solution. The total amounts of HPMC was very low, less than 5 µg released, at any measured time-point. Refer to the appendix for detailed calculations.
Figure 6. Release of PEG from DACP using the OcuFlow over 24 hrs. The values plotted are the mean ± standard deviation for n = 5.
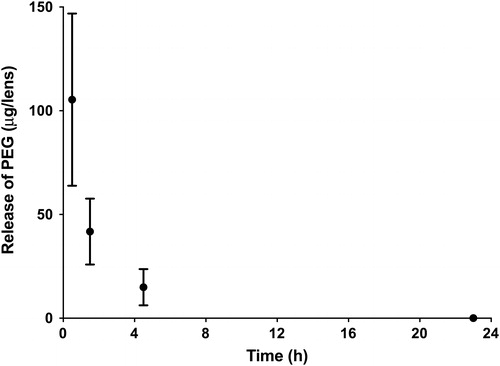
Figure 7. Release of HPMC from DACP using the OcuFlow over 24 hrs. The values plotted are the mean ± standard deviation for n = 5.
Discussion
The detection and quantification of PEG and HPMC by ESI-LCMS was fairly routine. PEG and HPMC are polymers with varying MWs. Nonetheless, using the proper in-source CID, it is possible to generate similar fragments of molecular ions in the gas phase. In other words, even compounds with different MWs within the same polymer family will yield similar unique fragments. These fragments are characteristic of that particular family of compound, and can be monitored and correlated to the relative amount of the compound in the sample.
The ionization of a standard PEG molecule in ESI-MS with in-source CID produces unique fragment ions spaced 44.03 units apart. The observed peaks (m/z 133.0862, 177.1124) in the ESI-MS spectra for PEG are in agreement with theoretical predictions and reported literature [Citation34,Citation35]. The fragmentation of HPMC is more complex due to the highly variable structure of this polymer. To our knowledge, the fragment ions in the low m/z range for HPMC have not been reported for ESI-MS. In this case, the unique m/z values for HPMC were determined experimentally through ESI-MS infusion experiments. The m/z 155.0705 and 173.0812 were only found in samples containing HPMC, and the intensity correlated with increasing HPMC concentration.
Examination of suggests that the release of HPMC and PEG follows a burst release pattern, which mainly occurs within the first 1.5 hrs. PEG had a higher total release compared to HPMC. Based on the LCMS studies, the MW of PEG in the DACP blister pack is between 200 and 600 Da, which is low enough to be incorporated in high amounts within the lens material, following its placement into the blister pack [Citation11]. However, the small molecular size also results in a faster release of the agent from the CL and this typical observation of burst release kinetics has been extensively reported for release of drugs from CLs [Citation22,Citation23,Citation28].
In contrast, the release of HPMC from the tested DACP lenses occurred at very low levels. This is not surprising as the concentration of HPMC in the blister pack solution is approximately 24 times lower than that of PEG. For this reason, we would expect that the release of HPMC from DACP would also be approximately 24 times lower than PEG. Furthermore, the absorption of HPMC into the bulk CL material, due to its higher MW, may be restricted by the lens pore size [Citation36]. As a result, there may be a smaller reservoir of HPMC in the lens available to be released on the eye.
The values reported in this study for the amount of wetting agent released are estimates of actual concentrations, as the standard curves used to derive these values were generated using commercially available versions of the wetting agents. The assumption is that the MWs of the commercial wetting agents are reflective of the actual wetting agents found in DACP blister packs. Since the information on DACP is proprietary, and without the information on the exact MWs of these polymers, it is not possible to accurately determine the exact quantity of these wetting agents.
The quantification of PEG and HPMC in the blister pack solutions of DACP, 1-Day Acuvue Moist (etafilcon A) and Biomedics 1Day (ocufilcon B) help depict the overall trend for release kinetics of these wetting agents. The total amounts of PEG and HPMC in the blister pack were 18,427 ± 1522 and 760 ± 22 µg respectively. Only PEG was detected in trace amounts in the other two blister packs. These results suggest that the method of quantifications for these wetting agents are specific. Furthermore, the results also indicate that the amount of wetting agent released from DACP at any given time is very small compared with that determined in the blister pack, at less than 1% of the amount found in the blister.
The conventional method to measure release of components from CLs (typically for drug-release studies) is a static vial-based model [Citation22–27]. When there is a large enough volume of fluid in the vial, it is proposed to model infinite sink conditions. Under these parameters, the release of components from CLs often follows a rapid burst release profile [Citation22–27]. For this reason, if a vial model was used in this study, we predict that the release of PEG and HPMC would even be faster than those we report, releasing rapidly within the first hour. The rationale behind using the infinite sink model to model the eye is that the cornea and the conjunctiva may create infinite sink conditions [Citation29]. However, in reality, there are likely to be diffusion barriers for the eluted compound of interest into these tissues. Furthermore, the dissolution of the compound from the CL into the post-lens tear film, located between the CL and cornea [Citation37], may be another important bottleneck. Under these circumstances, a flow system, such as the OcuFlow system utilised in this study, may be a better model to predict actual conditions found in the eye during normal wear. The release of components from CLs is much slower under a flow system, and is affected by tear volume and flow rate [Citation22,Citation28,Citation32,Citation38]. However, for very hydrophilic compounds such as PEG and HPMC, the release may still be rapid.
To compensate for evaporation over the course of the sampling time, the input flow rate for the OcuFlow was set at 6.9 µL/min to collect enough sample for analysis at each time-point. Since elution of compounds from CLs is affected by tear flow rate [Citation22], a faster flow rate will inevitably lead to a faster burst release. In addition, in this study Milli-Q water was used to measure the release rates of the compounds instead of an artificial tear fluid. In a previous study evaluating the release of a hydrophilic molecule, moxifloxacin, from CL using the OcuFlow, it was found that the release of the compound was faster in PBS than artificial tear fluid [Citation32]. Similarly, since PEG and HPMC are also hydrophilic, the release of these compounds may also be faster in Milli-Q water than in human tear fluid. However, while the slower tear flow-rate in vivo and tear fluid may lead to a slower release, there are other components not simulated on the OcuFlow (such as faster blinking rates [Citation33] and exposure to corneal and conjunctival cells) that may increase elution of the wetting agents from the CLs in vivo [Citation39]. Thus, we expect that overall release of these wetting agents in vivo would follow a similar release trend as that reported in this study.
The results for HPMC and PEG in this study are in agreement with previous claims for DACP [Citation11], in which HPMC is released from the lens surface mainly during lens insertion, and PEG is released within the first few hours to provide moisture in the early hours of wear [Citation11]. The OcuFlow device [Citation29] appears to be an ideal platform for investigating the release of both drugs [Citation22,Citation23,Citation28] and wetting agents/polymers from contact lens materials and should help to provide valuable data on the concept of developing future materials that deliver such agents to the ocular surface.
Disclosure statement
The authors Riederer, Lau, and Lorenz are employees of J&J. Jones and Subbaraman have received research support or lectureship honoraria from the following companies: Advanced Vision Research, Alcon, Allergan, Contamac, CooperVision, Essilor, GL Chemtec, Inflamax Research, J&J Vision, Menicon, Nature’s Way, Novartis, Ocular Dynamics, Oculus, Safilens, Santen, Shire, TearLab, TearScience. Jones is also a consultant and/or serves on an advisory board for Alcon, CooperVision, J&J Vision, Novartis and Ophtecs.
Additional information
Funding
References
- Young G, Veys J, Pritchard N, Coleman S. A multi-centre study of lapsed contact lens wearers. Ophthalmic Physiol Opt. 2002;22:516–27.
- Dumbleton K, Woods CA, Jones LW, Fonn D. The impact of contemporary contact lenses on contact lens discontinuation. ECL Sci Cli Pract. 2013;39:93–9.
- Pritchard N, Fonn D, Brazeau D. Discontinuation of contact lens wear: a survey. Int CL Clin. 1999;26:157–62.
- Jones L, Brennan NA, Gonzalez-Meijome J, Lally J, Maldonado-Codina C, Schmidt TA, Subbaraman L, Young G, Nichols JJ, members of the TIWoCLD. The TFOS International Workshop on Contact Lens Discomfort: report of the contact lens materials, design, and care subcommittee. Invest Ophthalmol Vis Sci. 2013;54:TFOS37–70.
- Nick J, Winterton L, Lally J. Enhancing comfort with a lubricating daily disposable. Optician. 2005;229:30–2.
- Nick J, Winterton L, Lally J, Long B. Lubricating lens focuses on patient comfort. CL Spectrum. 2006;21:40–1.
- Peterson RC, Wolffsohn JS, Nick J, Winterton L, Lally J. Clinical performance of daily disposable soft contact lenses using sustained release technology. CL Ant Eye. 2006;29:127–34.
- Fonn D. Targeting contact lens induced dryness and discomfort: what properties will make lenses more comfortable. Optom Vis Sci. 2007;84:279–85.
- Schwartz S, Nick J. Effectiveness of lubricating daily disposable lenses with different additives. Optician. 2006;231:22–6.
- Winterton LC, Lally JM, Sentell KB, Chapoy LL. The elution of poly (vinyl alcohol) from a contact lens: the realization of a time release moisturizing agent/artificial tear. J Biomed Mater Res B Appl Biomater. 2007;80:424–32.
- Pruitt J, Lindley K, Winterton L. Triple-action moisturisers for increased comfort in daily disposable lenses. Optician. 2007;234:27–8.
- Xinming L, Yingde C, Lloyd AW, Mikhalovsky SV, Sandeman SR, Howel CA, Liewen L. Polymeric hydrogels for novel contact lens-based ophthalmic drug delivery systems: a review. CL Ant Eye. 2008;31:57–64.
- Ciolino JB, Dohlman CH, Kohane DS. Contact lenses for drug delivery. Semin Ophthalmol. 2009;24:156–60.
- White CJ, Byrne ME. Molecularly imprinted therapeutic contact lenses. Expert Opin Drug Deliv. 2010;7:765–80.
- Bengani LC, Hsu KH, Gause S, Chauhan A. Contact lenses as a platform for ocular drug delivery. Expert Opin Drug Deliv. 2013;10:1483–96.
- Tashakori-Sabzevar F, Mohajeri SA. Development of ocular drug delivery systems using molecularly imprinted soft contact lenses. Drug Dev Ind Pharm. 2015;41:703–13.
- Porter RS, Chen TK. High-performance liquid chromatographic analysis of mupirocin in polyethylene glycols 400 and 3350 using dual ultraviolet and evaporative light scattering detection. J Chromatography A. 1996;732:399–402.
- Zerfa M, Brooks BW. Experimental investigation of PVA adsorption at the vinyl chloride water interface in monomer suspensions. Colloids Surf A: Physicochem Eng Aspects. 1998;132:267–73.
- Whelan MR, Ford JL, Powell MW. Simultaneous determination of ibuprofen and hydroxypropylmethylcellulose (HPMC) using HPLC and evaporative light scattering detection. J Pharm Biomed Anal. 2002;30:1355–9.
- Mishima S, Gasset A, Klyce SD, Baum JL. Determination of tear volume and tear flow. Invest Ophthalmol Vis Sci. 1966;5:264–76.
- Furukawa RE, Polse KA. Changes in tear flow accompanying aging. Am J Optom Physiol Opt. 1978;55:69–74.
- Bajgrowicz M, Phan CM, Subbaraman L, Jones L. Release of ciprofloxacin and moxifloxacin from daily disposable contact lenses from an in vitro eye model. Invest Ophthalmol Vis Sci. 2015;56:2234–42.
- Phan CM, Subbaraman L, Liu S, Gu F, Jones L. In vitro uptake and release of natamycin Dex-b-PLA nanoparticles from model contact lens materials. J Biomater Sci Polym Ed. 2014;25:18–31.
- Phan CM, Subbaraman LN, Jones L. In vitro uptake and release of natamycin from conventional and silicone hydrogel contact lens materials. Eye Contact Lens. 2013;39:162–8.
- Hui A. Contact lenses for ophthalmic drug delivery. Clin Exp Optom. 2017;100:494–512.
- Boone A, Hui A, Jones L. Uptake and release of dexamethasone phosphate from silicone hydrogel and group I, II, and IV hydrogel contact lenses. ECL Sci Cli Pract. 2009;35:260–7.
- Soluri A, Hui A, Jones L. Delivery of ketotifen fumarate by commercial contact lens materials. Optom Vis Sci. 2012;89:1140–9.
- Phan CM, Bajgrowicz M, Gao H, Subbaraman LN, Jones LW. Release of fluconazole from contact lenses using a novel in vitro eye model. Optom Vis Sci. 2016;93:387–94.
- Phan CM, Walther H, Gao H, Rossy J, Subbaraman L, Jones L. Development of an in vitro ocular platform to test contact lenses. J Vis Exp. 2016:e53907. DOI:10 3791/53907.
- Walther H, Phan C-M, Subbaraman LN, Jones L. Differential deposition of fluorescently tagged cholesterol on commercial contact lenses using a novel in vitro eye model. Transl Vis Sci Technol. 2018;7:18.
- Qiao H, Phan CM, Walther H, Subbaraman LN, Jones L. Depth profile assessment of the early phase deposition of lysozyme on soft contact lens materials using a novel in vitro eye model. ECL Sci Cli Pract. 2017. doi: 10.1097/ICL.0000000000000397. [Epub ahead of print]
- Phan CM, Bajgrowicz-Cieslak M, Subbaraman LN, Jones L. Release of moxifloxacin from contact lenses using an in vitro eye model: impact of artificial tear fluid composition and mechanical rubbing. Transl Vis Sci Technol. 2016;5:3.
- Sforza C, Rango M, Galante D, Bresolin N, Ferrario VF. Spontaneous blinking in healthy persons: an optoelectronic study of eyelid motion. Ophthalmic Physiol Opt. 2008;28:345–53.
- Varray S, Aubagnac JL, Lamaty E, Lazaro R, Martinez J, Enjalbal C. Poly(ethyleneglycol) in electrospray ionization (ESI) mass spectrometry. Analusis. 2000;28:263–8.
- Keller BO, Sui J, Young AB, Whittal RM. Interferences and contaminants encountered in modern mass spectrometry. Anal Chim Acta. 2008;627:71–81.
- Green JA, Phillips KS, Hitchins VM, Lucas AD, Shoff ME, Hutter JC, Rorer EM, Eydelman MB. Material properties that predict preservative uptake for silicone hydrogel contact lenses. ECL Sci Cli Pract. 2012;38:350–7.
- McNamara NA, Polse KA, Brand RJ, Graham AD, Chan JS, McKenney CD. Tear mixing under a soft contact lens: effects of lens diameter. Am J Ophthalmol. 1999;127:659–65.
- Ali M, Horikawa S, Venkatesh S, Saha J, Hong JW, Byrne ME. Zero-order therapeutic release from imprinted hydrogel contact lenses within in vitro physiological ocular tear flow. J Controlled Release. 2007;124:154–62.
- Mohammadi S, Jones L, Gorbet M. Extended latanoprost release from commercial contact lenses: in vitro studies using corneal models. PLoS One. 2014;9:e106653.
Appendix
The concentrations in nmol/mL are converted to µg/mL (or ppm) based on MW PEG = 200 g/mol and MW HPMC = 22 000 g/mol.
Table A1. PEG and HPMC concentration in DACP blister pack solution in µg/mL or ppm.
Table A2. Release of PEG from DACP on the OcuFlow in µg/mL or ppm.
Table A3. Release of HPMC from DACP on the OcuFlow in µg/mL or ppm.