Abstract
We have investigated the mode transition behavior from approximately half- to quarter-wavelength in typical F-band (90–140 GHz) TE11 to HE11 converters of varying corrugation depths. Simulations in which the number of slots in the corrugation is varied indicate that the optimal number of slots should be greater than two, which is in excellent agreement with the experimental results. The mode content was also analyzed with and without a quarter-wavelength depth-corrugated tapered section. The electric field pattern at the exit of a quarter-wavelength tapered transition connected to a half-wavelength to quarter-wavelength TE11 to HE11 mode converter is compared with that without a converter. Electric field patterns both with and without a half- to quarter-wavelength TE11 to HE11 mode converter show a highly Gaussian field pattern with less than 35 dB of cross-polarization. Simulated field patterns are in good agreement with the experimentally measured field patterns, with the measured and simulated electric field distributions matching approximately 96.5 and 97.5%, respectively, to a pure Gaussian distribution.
1. Introduction
Specific applications for corrugated waveguides in fields such as astronomical telescope manufacture, high power millimeter/terahertz wave delivery, and radar engineering have been developed for decades.Citation[1–10] A fundamental smooth cylindrical waveguide operating at hundreds of gigahertz or above will be on the order of a few millimeters or smaller in size; however, high power transmission at such frequencies will necessitate an oversized waveguide structure to mitigate the possibility of metallic waveguide breakdown and, as such, a fundamental smooth cylindrical waveguide is not a good choice for such frequencies. Instead, the HE11 mode of an overmoded corrugated waveguide is considered to be the best choice for applications such as those mentioned above. The waveguide for a typical overmoded corrugated waveguide will satisfy condition D/λ ≫ 1, where D and λ are the waveguide diameter and free space wavelength, respectively. In order to characterize a designed oversized corrugated waveguide prior to high power testing, a low power test should be performed on a laboratory bench. Typically, a low power test setup consisting of a network analyzer connected to a cylindrical fundamental waveguide that is connected in turn to a mode converter for transforming a TE11 mode (a fundamental cylindrical mode) into an HE11 mode (a fundamental corrugated waveguide mode) is required to transit to an oversized corrugated waveguide.
Mode conversion from TE11 to HE11 can be accomplished by designing a smooth depth transition from λ/2 to λ/4 into the waveguide surface.Citation[11] The resulting mode conversion can be analyzed through surface impedance formalism Citation[12]; as the surface reactance Z increases gradually from zero at the initial λ/2 corrugation depth to infinity at the λ/4 corrugation depth, the conversion can be approximately expressed as.Citation[11](1)
where w, p, d, and a are the slot width, corrugation period (pitch), corrugation depth, and waveguide radius, respectively, as depicted in Figure . The impedance relationship in Equation (1) is the most rigorous in cases where the pitch of the corrugation is small as compared to the wavelength.
Figure 1 Schematic drawing of a corrugated transition with a smoothly varying depth. The depth of the corrugation starts from λ/2 at an input radius of ain and decreases gradually to λ/4 at a final radius of aout.
Using a mode matching technique involving the determination of a scattering matrix at each discontinuous cross section, James et al. analyzed and designed a TE11 to an HE11 mode converter,Citation[11] discovering in the process that at least five corrugation slots are necessary in order to effectively convert from a TE11 to an HE11 mode. Most subsequent implementations of HE11 mode launchers with a gradual decrease in depth from λ/2 to λ/4 have used a moderate number of slots.Citation[13–20] However, a rigorous validation of the optimal λ/2 to λ/4 corrugated transition in terms of factors such as the effects on the beam pattern of the number of corrugations, the connection geometry of the λ/4 corrugated tapered section, and the input mode purity has, to the best of our knowledge, not yet been carried out or made accessible in the open literature.
In this study, we present a basic design scheme based on the beam patterns of a λ/2 to λ/4 converter with variations in terms of parameters such as the number of slots and the additional attachment of a λ/4 corrugated tapered section for oversizing. In addition, we also investigate the dependence of the final HE11 mode purity on the input mode of a λ/4 corrugated tapered section.
The rest of this paper is organized as follows. In Section 2, we introduce the analysis codes used in this study. We compare the results obtained from using these simulation algorithms with the experimental results presented in Section 3. Finally, we conclude and summarize this paper in Section 4.
2 Analysis method
In this section, we present formalisms of the analysis codes that were used in simulations.
2.1 Scattering matrix code
A mode-matching technique can be used to develop a scattering matrix formalism by expanding the transmitted and reflected waves at each discontinuous junction within a waveguide geometry as a series of modal solutions and then cascading these via scattering matrices.Citation[2,16] This mode-matching technique for determining scattering matrices is quite common, and we will outline its key components in the scattering matrix code used in the study – the commercially available CASCADE program.Citation[21]
At the junction of discontinuity between regions I and II, the transverse electric and magnetic fields in region I can be expressed as(2)
while the fields in region II can be expressed as(3)
where F and B are the amplitudes of the forward and backward waves in each region, respectively; Z is the characteristic impedance; and and
are the electric and magnetic eigenmodes of the waveguide. With proper boundary conditions given at the junction, the following equations for the modal amplitudes,
and
, are satisfied:
(4) where I, Z, and Y are the identity matrix, the modal impedance, and the admittance, respectively; and P is the mode coupling matrix given by
(5) where the surface integral is taken over the common aperture between the guides.
For the forward and the backward waves, the scattering matrix formulation can be expressed as(6) where
,
, and
.
By cascading these matrices, the mode-matching formulation expressed in Equation (4) can be reformulated using scattering matrix formalism.
As commercial software – the CASCADE code developed by Calabasas Creek Research (CCR) – has already been used to implement mode matching by means of the scattering matrix formulation; we used CASCADE in this study for obtaining the scattering parameters of a corrugated waveguide.
2.2 Surface integral equation analysis
We used commercial software (Surf3D) to evaluate the electric and magnetic field patterns at an arbitrary plane.Citation[22] Surf3D calculates radiation fields based on the electric field integral equation (EFIE), which is expressed as(7)
where is the unknown surface current,
is the incident waveguide source field, and
(8) where
is the free space Green’s function.
Reading arbitrary input waveguide modes, Surf3D discretizes the unknown surface current using the method of moments (MoM); based on this, the field pattern at any plane in a guided structure can be plotted, and the radiation pattern in a far field region can be determined. Owing to high memory requirements, simulating electric fields at high frequency over the large geometrical domain of an oversized structure is almost impossible using the finite element methods. However, given an adequate memory (∼12 GB) and a high enough mesh density (more than eight mesh cells per wavelength), the Surf3D code can be very useful for finding electric field patterns in an oversized structure, within an appropriate calculation time (i.e. 1 h). The Surf3D code has been used to benchmark effects in many oversized metallic structures, including diffractions occurring at the edge of metallic surfaces.Citation[23–26]
3 Results
The corrugated TE11 to HE11 mode converter used in this study is schematically depicted in Figure , which shows the gradual increase in depth from λ/2 to λ/4. For the simulation, the target frequency was set to 95 GHz, and the geometrical parameters of depth (d), pitch (p), width (w), and thickness (t) shown in Figure were set as d = λ/4, w = t = λ/6, and p = λ/3, respectively.
Figure 2 Axisymmetric corrugated λ/2 to λ/4 TE11 to HE11 transition profile for a wave propagating in the z direction. The input at z = 0 is fed by a TE11 mode. The number of slots of corrugation, Nslot, varies between (a) 15, (b) 5, and (c) 3. The input radius is 0.113 cm.
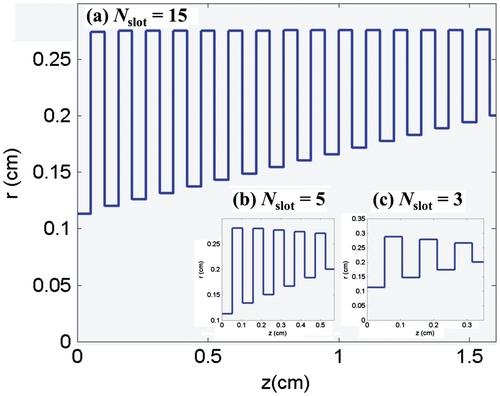
The effects of geometric parameters such as d, p, w, and t on performance have been described in numerous previous studies, and based on this, we have been able to confirm that limited changes in these parameters do not affect the results significantly.Citation[27]
3.1 The λ/2 to λ/4 corrugated TE11 to HE11 mode converter
In order to observe the effects of changing the number of slots (Nslot), this factor was varied from 2 to 15 over the λ/2 to λ/4 depth transition, as shown in Figure . For this simulation, the Surf3D code was used to model the field patterns and the CASCADE code was used to determine the scattering parameters.
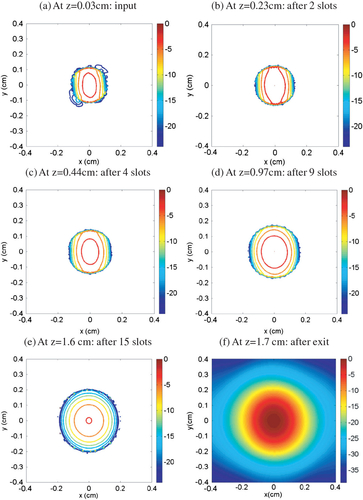
Figure shows the resulting electric field intensity plots on the xy plane at different values of z for Nslot = 15. For an input mode of transition of TE11, the electric field begins to convert into the hybrid HE11 mode just prior to the transition, as shown in Figure . Figure shows the field pattern – a Gaussian beam – in free space right after exiting the transition. Here, the electric field pattern shows higher TM11 mode intensity, resulting in a reduced electric field at the waveguide wall after the ninth slot of the transition (as shown in Figure ), where the increasing mixture of the TE11 and TM11 modes begins to produce an HE11-like mode.
Figure 3 Electric field intensity plots for Nslot = 15 at varying points. The measurements are taken on the xy plane for various values of z. (a) Initially launched waveguide mode at the input port in the TE11 mode, (b) z = 0.23 cm after 2nd slot, (c) z = 0.44 cm after 4 slots, (d) z = 0.97 cm after 9th slot, (e) z = 1.6 cm after 15th slot, and (f) z = 1.7 cm, at which point the beam propagates out of the waveguide.
Results for the Nslot = 5 case are plotted in Figure , from which it can be seen that the HE11-like pattern begins to appear after the third slot. Examination of Figure (Nslot = 15) and Figure (Nslot = 5) together shows that the HE11-like pattern starts to build significantly after 2/3 of the total the number of slots have been transited, and, as shown in Figure , the electric field pattern following the final corrugation shows high HE11 mode intensity. show results for Nslot = 3 and 2, respectively. The Nslot = 3 case shows an HE11-like pattern after the second slot, which also represents 2/3 of the total number of slots; however, in the Nslot = 2 case, mode transition occurs very abruptly owing to an insufficient number of corrugations. As shown in Figure , following the first corrugation (at a depth of λ/2), the HE11-like pattern is already present, and the final electric field pattern demonstrates a well-formed HE11 mode.
Figure 4 Electric field intensity plots for Nslot = 5 at different values of z measured on the xy plane. (a) Initially launched waveguide mode at the input port (TE11 mode), (b) z = 0.12 cm after 1st slot, (c) z = 0.35 cm after 3rd slot, and (d) z = 0.54 cm after 5th slot.
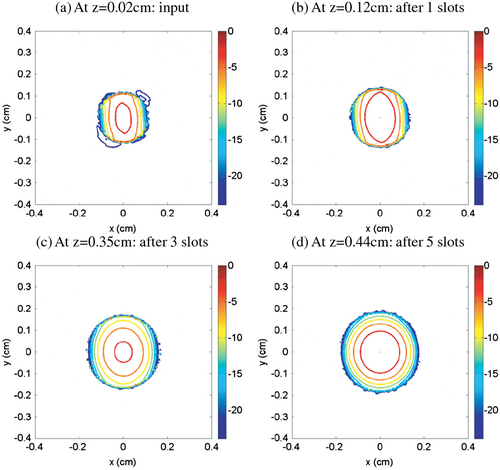
Figure 5 Electric field intensity plots for the Nslot = 3 case at various values of z measured on the xy plane. (a) Initially launched waveguide mode at the input port (TE11 mode), (b) z = 0.13 cm after 1st slot, (c) z = 0.24 cm after 2nd slot, and (d) z = 0.35 cm after 3rd slot.
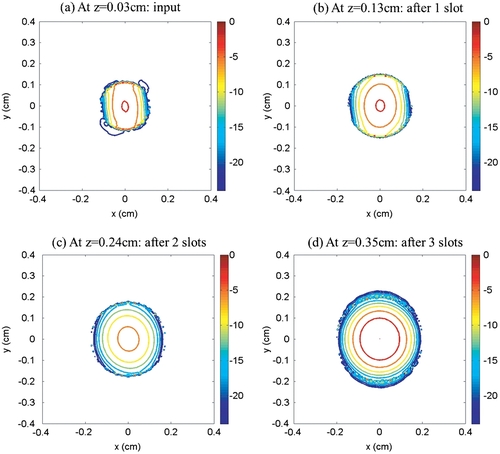
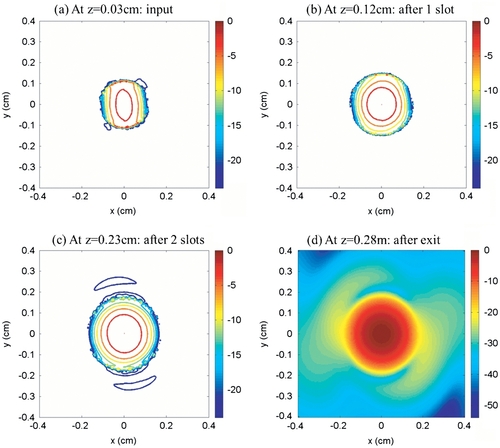
Figure 6 Electric field intensity plotted for the Nslot = 2 case at various values of z measured on the xy plane. (a) Initially launched waveguide mode at the input port (TE11 mode), (b) z = 0.12 cm after 1st slot, (c) z = 0.23 cm after 2nd slot, and (d) z = 0.28 cm where the beam propagates out of the waveguide.
In order to verify the effect of the number of slots on transition, the return loss was measured instead of directly scanning the field pattern, as there was insufficient resolution for performing the latter examination owing to the small size of the transition in comparison with the probe.
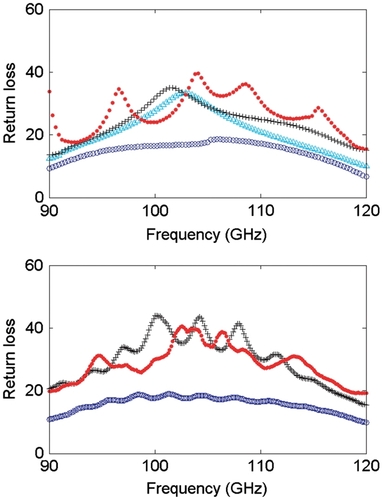
For differing values of Nslot, the return loss obtained from the CASCADE simulation was compared with the measured results from an experiment performed using an Agilent PNA-X N5242A vector network analyzer (VNA) with OML WR-08 frequency extenders. Corrugated λ/2 to λ/4 mode converters with varying numbers of slots, as well as oversized tapered waveguide transitions with two different tapered angles (3° and 10°), were fabricated by electroforming; the fabricated components are shown in Figure . As can be seen in Figure , the return loss increases with the number of corrugations in the λ/2 to λ/4 mode converters – a result that is in excellent agreement with the simulation results shown in the same figure. In the case where Nslot = 2, the return loss as a function of frequency is more than 10 dB, lower than that for either Nslot = 5 or 15 in both the simulations and the experiments, which indicates that the abrupt change in the corrugation depth in the Nslot = 2 case results in impedance mismatch, as predicted in the field pattern simulation results. Furthermore, both the simulation and the experimental results indicate that as long as Nslot is greater than 2, the difference in the return loss is not significant, which verifies the appearance of an HE11-like pattern at 2/3 of the total number of corrugations, as was discussed earlier.
Figure 7 Fabricated corrugated λ/2 to λ/4 mode converters and oversized λ/4 corrugated tapered transitions: (a) λ/2 to λ/4 mode converters with Nslot = 2, 5 and 15, (b), (c), and (d) corrugated λ/4 tapered transitions with Nslot = 2, 5, and 15, respectively with tapered angles of 3° (left) and 10° (right).
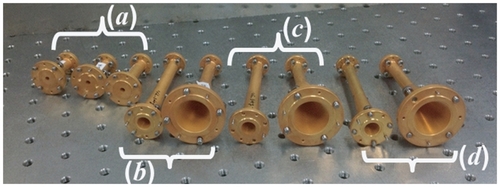
Figure 8 Simulated (a) and experimentally measured (b) return loss with a varying number of corrugation slots (Nslot). The blue circle, black cross, and red dotted curves represent Nslot = 2, 5, and 15, respectively. The cyan triangle represents simulation of Nslot = 3.
3.2 Oversized λ/4 corrugated tapered transition section
Typically, a uniformly corrugated λ/4 tapered section will be attached at the end of the λ/2 to λ/4 mode converter (TE11 to HE11 mode converter) in order to allow further propagation of the HE11 mode through an oversized waveguide. The effects of the attachment of a transitional section with this geometry were investigated, via simulation, for cases in which the slope of the transitional section was 3° and 10°, as is shown in Figure .
Figure 9 Geometry of a λ/2 to λ/4 transition (TE11 to HE11 mode converter) followed by a λ/4 corrugated tapered section with a taper angle of (a) 10° and (b) 3°. In this geometry, Nslot = 3 in the λ/2 to λ/4 transition.
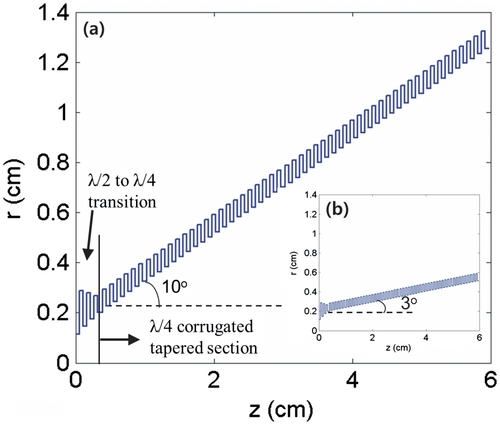
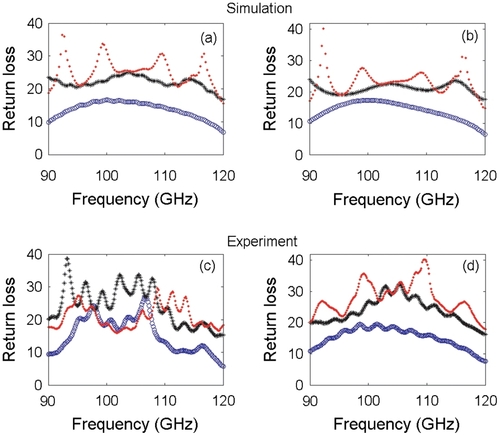
Figure shows a comparison between the simulation and the experimentally derived values of the return loss as a function of the corrugated tapered section angle at differing values of Nslot. These results are also compared with a case in which the λ/4 corrugated tapered transition is not used. When the λ/4 corrugated tapered transition is attached, an overall decrease in the return loss can be observed in both the simulation and the experiment – a result indicating that some extent of impedance mismatch is inevitable from directly connecting the transition and corrugated tapered sections. From Figure , it can be observed that the results with and without attachment of the corrugated tapered transition do not differ much from each other when Nslot = 2, which indicates that mode mismatch is the highest in this case. The difference in return loss around the center of the frequency band with and without the tapered transition is around 10 for both Nslot = 5 and 15. Increasing the angle of taper to 10° results in a decrease in the return loss relative to the 3° case for both Nslot = 5 and 15, with the experimental results for Nslot = 15 from Figure showing a higher return loss for 10° than that for 3°, unlike in the simulation results; this may be a result of a manufacturing error in the gradual tapering section. The effects of varying Nslot for a fixed angle in the corrugated tapered transition section are compared and summarized in Figure , from which it can be concluded that, as long as Nslot is greater than 2, the return loss does not differ much between the simulation and the experiment, although the experimental results at a taper angle of 3° are not as close as they are in the 10° case, owing to limitations in the manufacturing tolerance for the gradual angle increase.
Figure 10 Return loss results of TE11 to HE11 transition as the number of corrugations in the E11 to HE11 transition varies with the attachment of the corrugated tapered section of a depth of λ/4 and varying angle. The simulation results ((a), (b), and (c)) are compared with the experimental results ((d), (e), and (f)). The number of slots (Nslot) is (a), (d): 2, (b), (e): 5, and (c), (f): 15. The black cross and red diamond represent the λ/4 corrugated tapered section with an angle of 3° and 10°, respectively, while the blue open circle represents the case without attachment of the λ/4 corrugated section.
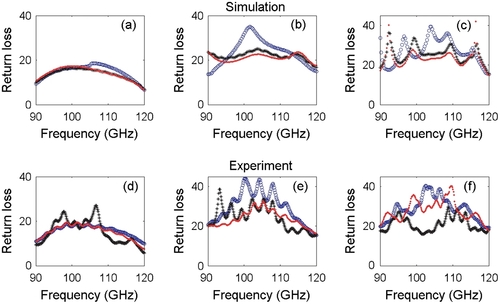
Figure 11 Return loss results for attached λ/4 corrugated tapered transition angles of (a), (c): 3○ and (b), (d): 10○. The simulation results ((a), (b)) are compared with the experimental results ((c), (d)). The blue open circle, black star, and red open triangle represent the number of slots (Nslot) equaling 2, 5, and 15, respectively.
Mode contents, which are important for characterizing the mode conversion efficiency of a given geometry, can also be obtained from CASCADE. The HE11 mode can be expressed as a mixture of the TE and TM modes from smooth waveguide solutions comprising 84.496% TE11, 14.606% TM11, 0.082% TE12, 0.613% TM12, and 0.00358% TE13, as shown in Table .Citation[28]
Table 1. Simulation mode contents of λ/2 to λ/4 transition with 3° corrugated tapered transition attached. The λ/2 to λ/4 transition by itself is expressed as “w/o,” while the transition attached to a 3° corrugated tapered transition is expressed as “3°.” The ideal HE11 mode composition is shown in the second row for comparison. All numbers in the table are expressed as percentages.
Table lists the mode contents for geometries containing only the λ/2 to λ/4 mode converter (Figure ), along with a corrugated tapered section with a 3° slope angle (Figure ). Because the λ/4 corrugated tapered transition functions as a mode filter, and because the initial λ/2 to λ/4 transition section has more corrugation slots, the HE11 mode content in this case is close to an ideal HE11 mode.
The electric field pattern of a λ/2 to λ/4 mode converter attached to a λ/4 corrugated tapered section was simulated using Surf3D code. In order to limit the simulation time, we chose one tapered structure – a 5-cm-long λ/4 corrugated section with a taper angle of 3°, upon which two simulations were conducted in order to investigate the sensitivity of the HE11 mode purity to the launching mode present at the beginning of the λ/4 corrugated tapered section. The two chosen input modes corresponded to the following cases:
Case 1: an ideal HE11 mode | |||||
Case 2: a TE11 mode. | |||||
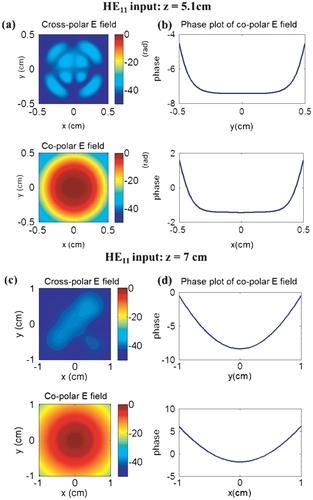
Figure shows the co- and cross-polar electric field patterns resulting from launching an ideal HE11 mode at the input of the λ/4 corrugated tapered section (Case 1). The co-polar electric field at z = 5.1 cm shows a Gaussian mode pattern, while the cross-polar electric field pattern has very low intensity. The electric field phase was obtained along the x and y directions relative to a central field maximum at the intersection of the axes, as shown in Figure . The phase at z = 5.1 cm shows quite a flat pattern. From Figure , which show the radiation pattern plots, the HE11 mode becomes highly Gaussian with a spherical phase front at z = 7 cm, 2 cm away from the corrugated waveguide aperture.
Figure 12 Electric field intensity and phase plots for HE11 mode input to a λ/4 corrugated transition (Case 1). (a) Electric field intensity plot of cross-polarization (upper plot) and co-polarization (bottom;); (b) unwrapped phase plot of co-polarization electric field cut by x and y axes at the maximum electric field (x,y) location z = 5.1 cm; (c) electric field intensity plot showing cross-polarization (upper plot) and co-polarization (bottom); and (d) unwrapped phase plot of co-polarization electric field cut by x and y axes at maximum electric field (x,y) z = 7 cm.
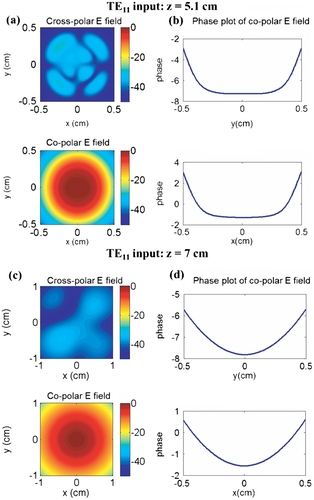
It is very interesting to note that when a TE11 mode is injected directly into the λ/4 corrugated tapered section (Case 2), the electric field pattern of the phase plot still exhibits the HE11 mode characteristics at z = 5.1 cm, as is shown in Figure .
Figure 13 Electric field intensity and phase plots for the TE11 mode input directly to the λ/4 corrugated transition (Case 2). (a) Electric field intensity plot of cross-polarization (upper plot) and co-polarization (bottom;); (b) unwrapped phase plot of co-polarization electric field cut by x and y axes at the maximum electric field (x,y) location z = 5.1 cm; (c) electric field intensity plot showing cross-polarization (upper plot) and co-polarization (bottom); and (d) unwrapped phase plot of co-polarization electric field cut by x and y axes at maximum electric field (x,y) z = 7 cm.
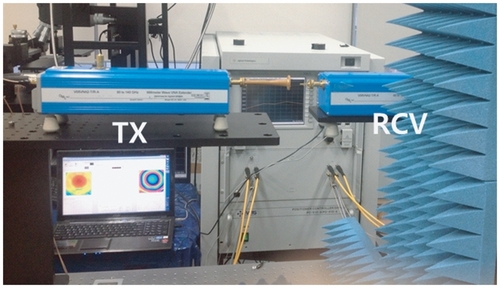
The electric field pattern was then measured by using the experimental setup shown in Figure . Here, a WR-08 frequency extender from a VNA was connected to a 5 cm-long corrugated tapered λ/4 transition, which served as a transmitter, while a WR-08 open waveguide probe scanned the field pattern using a programmable automatic xyz scanner mounted on an optical table. The spatial resolution of measurement was 0.2 mm.
Figure 14 The experimental setup for the field measurement for the 5-cm-long λ/4 corrugated oversized transition without λ/2 to λ/4 transition. The 5-cm-long transition is connected to the one WR-08 frequency extender (TX) and the open waveguide probe is connected to the other WR-08 extender (RCV) to scan the field. The programmable xyz automatic motion controller is mounted on the optical table for the field measurement.
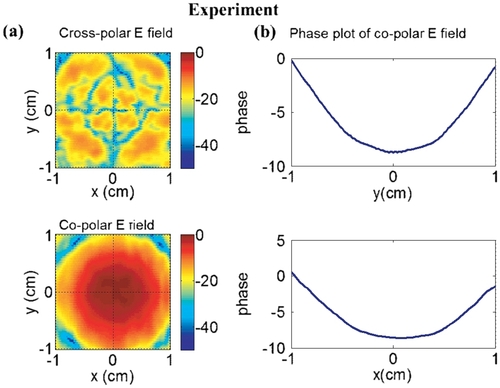
The experimentally measured electric field pattern is shown in Figure for a geometry not including a λ/2 to λ/4 converter (which is identical to the case of the TE11 mode injection directly into the tapered section). The measured electric field pattern and the unwrapped phase pattern both show excellent agreement with the simulation results from Figure although a higher cross-polar electric field intensity is observed in the experimental measurements.
Figure 15 Measured electric field intensity and phase plots for TE11 mode input to the λ/4 corrugated transition (Case 2). (a) Electric field intensity plot of cross-polarization (upper plot) and co-polarization (bottom); (b) unwrapped phase plot of co-polarization electric field cut by x and y axes at maximum electric field (x, y) z = 7 cm.
The Gaussian mode content can be analyzed using a matching coefficient defined as(9)
where g(x,y) is an ideal Gaussian distribution and f(x,y) function for which the correlation is being performed. The matching coefficient between the experimentally measured electric field pattern shown in Figure and the ideal Gaussian field pattern is approximately 0.965, while it is 0.975 between the simulated electric field distribution shown in Figure and the ideal Gaussian beam pattern. The measured electric field pattern thus agrees very closely with the simulation results, showing only a 1% drop in correlation with a Gaussian beam as compared with the correlation of the simulation.
From these results, one can, therefore, conclude that the input mode launched at the beginning of a λ/4 corrugated tapered section will not necessarily be a high purity HE11 mode. In the extreme case of TE11 mode injection (Case 2), a relatively pure HE11 mode pattern is still obtained at the exit in both the experiment and the simulation, although a relatively larger cross-polar electric field is observed in the experiment.
4 Summary and conclusions
In this paper, we have presented a comprehensive study of a λ/2 to λ/4 corrugated mode converter and of a λ/4 corrugated tapered transition for TE11 to HE11 mode conversion in an oversized structure. In this study, two commercially available programs – CASCADE and Surf3D – were used for simulations in which the number of slots in the λ/2 to λ/4 mode converter was varied in order to investigate the mode transition behavior. From this, we determined that TE11 to HE11 mode transition would occur if the number of slots is greater than 2 and also that the HE11-like field pattern will start to form at the slot corresponding to 2/3 of the total number of slots. Interestingly, the return loss becomes saturated when a λ/4 corrugated tapered transition is attached to the λ/2 to λ/4 transition in order to allow oversizing of the waveguide. These simulation results were validated experimentally. In a combined geometry (λ/2 to λ/4 mode converter followed by λ/4 corrugated tapered section), a moderate slope angle (i.e. 3°) produces the highest HE11 mode content. Simulations of the final electric field pattern, however, indicate that the highest initial HE11 mode content at the input of a corrugated tapered section will not necessarily lead to a pure HE11 mode at the end of an oversized corrugated waveguide used as a horn or a transition. This observation is supported in the extreme case in which a pure TE11 mode is injected into a λ/4 corrugated tapered section, as even in this instance a fairly pure HE11 guided mode of free space radiation with 96.5% purity in terms of Gaussian mode content can be experimentally obtained at the exit, although in this situation, the cross-polar electric field intensity will be slightly higher than the HE11 mode input predicted by simulation.
Acknowledgments
This research was supported by National R&D Program through the National Research Foundation of Korea (NRF) funded by the Ministry of Science, ICT & Future Planning (NRF-2011-0020575). Also, we acknowledge financial support by Korea Research Institute of Standards and Science (KRISS).
Related Research Data
References
- Thomas, BM, 1972. Mode conversion using circumferentially corrugated cylindrical waveguide, Electron. Lett. 8 (1972), pp. 394–396.
- Elliot, RD, and Clarricoats, PJB, 1980. Corrugated waveguide monopulse feed, Electron. Lett. 16 (1980), pp. 324–325.
- Granet, C, and James, GL, 2005. Design of corrugated horns: a primer, IEEE Antennas Propag. Mag. 47 (2005), pp. 76–84.
- Balanis CA. Modern antennas handbook. Hoboken (NJ): Wiley; 2008. p. 1638–1657..
- Granet, C, James, GL, Bolton, R, and Moorey, G, 2004. A smooth-walled spline-profile horn as an alternative to the corrugated horn for wide band millimeter-wave applications, IEEE Trans. Antennas Propag. 52 (2004), pp. 848–854.
- James, GL, 1992. The feed system. Special issue: The Australia telescope, J. Elect. Electron. Eng. 12 (1992), pp. 137–145.
- Sharma, SB, Pujara, D, and Chakrabarty, SB, 2010. Design and development of a dual-mode corrugated horn for an offset reflector antenna, Microwave Opt. Technol. Lett. 52 (2010), pp. 113–116.
- Kimura, K, Iwashita, H, Asayama, S, Sugimoto, M, Kikuchi, G, and Ogawa, H, 2008. Antenna performance of a directly dug corrugated feedhorn for the 150 GHz band, Int. J. Milli. Waves. 29 (2008), pp. 713–723.
- Clarricoats, PJB, Olver, AD, and Chong, SL, 1975. Attenuation in corrugated circular waveguides – Part 1: theory, Proc. IEE. 122 (1975), pp. 1173–1179.
- Clarricoats, PJB, Olver, AD, and Saha, PK, 1971. Near field radiation characteristics of corrugated horns, Electron. Lett. 7 (1971), pp. 446–448.
- James, GL, 1981. Analysis and design of TE11 to HE11 corrugated cylindrical waveguide mode converters, IEEE Trans. Microwave Theory Tech. 29 (1981), pp. 1059–1066.
- Thumm, M, Jacobs, A, and Ayza, MS, 1991. Design of short high-power TE11-HE11 mode converters in highly overmoded corrugated waveguides, IEEE Trans. Microwave Theory Tech. 39 (1991), pp. 301–309.
- Clarricoats PJB, Olver AD. Corrugated horns for microwave antennas. IEE electromagnetic waves series 18; Stevenage: Peter Peregrinus Ltd; 1984..
- Doane, JL, 1987. Low loss propagation in corrugated rectangular waveguide at 1mm wavelength, Int. J. Infrared Milli. Waves. 8 (1987), pp. 13–27.
- Thumm, M, Erckmann, V, Kasparek, W, Kumric, H, Muller, GA, Schuller, PG, and Wilhelm, R, 1986. Very high power mm-wave components in oversized waveguides, Microwave J. 29 (1986), pp. 103–121.
- James, GL, and Thomas, BM, 1982. TE11 to HE11 cylindrical waveguide mode converters using ring-loaded slots, IEEE Trans. Microwave Theory Tech. 30 (1982), pp. 278–285.
- Doane, JL, 1993. Compact HE11 to surface wave converters for high power waveguide dummy loads, Int. J. Infrared Milli. Waves. 14 (1993), pp. 363–382.
- Silva, LCD, 1988. A method of analysis of TE11 to HE11 mode converters, IEEE Trans. Microwave Theory Tech. 36 (1988), pp. 480–488.
- Teniente, J, Gonzalo, R, Rio, C, Marti-Canales, J, Sorolla, M, Fernandez, A, Likin, KM, and Martin, R, 1999. Corrugated horn antenna for low-power testing of the quasioptical transmission lines at TJ-II stellerator, Int. J. Infrared Milli. Waves. 20 (1999), pp. 1757–1767.
- Lee, HS, and Eom, HJ, 2002. Radiation from a corrugated circular waveguide with a flange, J. Electromagn. Waves Appl. 16 (2002), pp. 1255–1274.
- Neilson, JM, Latham, PE, Caplan, M, and Lawson, WG, 1989. Determination of the resonant frequencies in a complex cavity using the scattering matrix code, IEEE Trans. Microwave Theory Tech. 37 (1989), pp. 1165–1170.
- Neilson, JM, and Bunger, R, 2002. Surface integral equation analysis of quasi-optical launcher, IEEE Trans. Plasma Sci. 30 (2002), p. 794.
- Neilson, JM, 2006. Optimal synthesis of quasi-optical launchers for high-power gyrotrons, IEEE Trans. Plasma Sci. 34 (2006), pp. 635–641.
- Felch, K, Blank, M, Borchard, P, Chu, TS, Feinstein, J, Jory, HR, Lorbeck, JA, Loring, CM, Mizuhara, YM, Neilson, JM, Schumacher, R, and Temkin, RJ, 1996. Long-pulse and CW tests of a 110 GHz gyrotron with an internal, quasioptical mode converter, IEEE Trans. Plasma Sci. 24 (1996), pp. 558–569.
- Jin, J, Thumm, M, Piosczyk, B, and Rzesnicki, T, 2006. Theoretical investigation of an advanced launcher for a 2 MW 170 GHz TE34,19 coaxial cavity gyrotron, IEEE Trans. Microwave Theory Tech. 54 (2006), pp. 1139–1145.
- Jin, J, Thumm, M, Piosczyk, B, Kern, S, Flamm, J, and Rzesnicki, T, 2009. Novel numerical method for the analysis and synthesis of the fields in highly oversized waveguide mode converter, IEEE Trans. Microwave Theory Tech. 57 (2009), pp. 661–1668.
- Nanni, EA, Jawla, SK, Shapiro, MA, Woskov, PP, and Temkin, RJ, 2012. Low-loss transmission lines for high-power terahertz radiation, J. Infrared Milli. THz. Waves. 33 (2012), pp. 695–714.
- Teniente J. Modern corrugated horn antennas [PhD thesis]. Public University of Navarra, Electro. & Electron. Eng. Dept.; 2003..