
 ?Mathematical formulae have been encoded as MathML and are displayed in this HTML version using MathJax in order to improve their display. Uncheck the box to turn MathJax off. This feature requires Javascript. Click on a formula to zoom.
Abstract
Evaluation of interface strength is important in composite material design such as carbon fiber reinforced plastic. Molecular simulation, which considers aspects such as chemical structure, can be used to evaluate the composite interface strength. Therefore, in this study, the interface energies between graphene, considering the electric charge state, and resin (TriA-X polyimide, DGEBA, triethylenetetramine, vinyl ester, and PA6) were evaluated via molecular dynamics simulation. First, the interface energy and experimentally obtained interface strength were compared. Subsequently, the coefficient of determination R2 was calculated using linear approximations from the interface energy and interface strength. In addition, the correlation coefficient was calculated and showed a high correlation. Based on this data, it was conjectured that a relationship exists between the interface strength and interface energy. Furthermore, the validity of the relationship magnitude between the experimentally obtained interface strength and the interface energy obtained via simulation was evaluated. Moreover, considering graphene oxidation, the interface energies between the resin and three forms of graphene (functionalized with OH, COOH, and O groups) were obtained, and the effect of various oxidation surface treatments of graphene on their corresponding interface strengths was investigated.
1. Introduction
Evaluation of the interface strength is important in the design of composite materials such as carbon fiber reinforced plastic because the relationship between interface strength and overall material fracture is complex. For example, there are cases where the interface strength is too high and the material becomes brittle [Citation1]. In these cases, it is not efficient to evaluate the mechanical properties of the interface experimentally. Molecular simulation has time and cost advantages, can perform virtual simulations considering aspects such as chemical structure, and can be utilized to evaluate composite interface strength. Many researchers reported molecular simulation studies on composite materials [Citation2–35], for example, studies on interface structure and composite material properties [Citation9–12]. Sahraei et al. [Citation13] investigated the effects of the epoxy crosslink density and the number of graphene layers on the interlayer thickness, and provided insights into the evaluation of interlayer thickness characteristics. In addition, studies evaluating the mechanical and thermal properties of composite materials were conducted [Citation14–26]. For example, Rahman et al. [Citation27] reported studies on Young’s modulus, shear modulus, cohesive strength, and pullout force of graphene/epoxy nanocomposites. In addition, studies on the evaluations of interface energy and mechanical properties of functionalized reinforcement were reported [Citation28–35]. However, many studies did not consider electric charge state. Previously, we evaluated the mechanical properties of the carbon fiber/resin interface [Citation36]. Although the study calculated the electric charge of the resin, the problem remains that the electric charge of the unfunctionalized graphene, considered as carbon fiber, is not correctly calculated. Therefore, in this study, considering the electric charge state, we evaluated the interface energies between graphene and resin (TriA-X polyimide, DGEBA, triethylenetetramine, vinyl ester, and PA6) via molecular dynamics simulation. First, the interface energy and interface strength obtained experimentally [Citation36] were compared. Subsequently, the coefficient of determination R2 was calculated using linear approximations from the interface energy and interface strength. In addition, the correlation coefficient was −0.91896. Based on this, it was conjectured that a relationship exists between the interface strength and interface energy. Furthermore, the validity of the relationship magnitude between the experimentally obtained interface strength and the interface energy obtained via simulation was evaluated. Moreover, considering graphene oxide, the interface energies between the resin and the three forms of graphene (functionalized with OH, COOH, and O groups) were obtained and the effect of various oxidation surface treatments of graphene on the corresponding interface strengths was investigated.
2. Carbon fiber model considering electric charge state
2.1. Modeling
In this analysis, four types of molecular models were created. TriA-X polyimide molecules were 7-mers (428 atoms per molecule). The epoxy molecule utilized, Bisphenol A diglycidyl ether (DGEBA), is a linear model (413 atoms per molecule), and triethylenetetramine was used as the curing agent, which reacts with the epoxy ring of DGEBA. The vinyl ester molecule was Bisphenol A and the degree of polymerization was set to 8 (360 atoms per molecule). The degree of polymerization of the Polyamide 6 (PA6) molecule was set to 20 (383 atoms per molecule). shows each chemical structure. Resin molecules were linear, similar to the previously produced model [Citation36].
Figure 1. Chemical structures of (a) TriA-X polyimide, (b) DGEBA, (c) triethylenetetramine, (d) vinyl ester, and (e) PA6
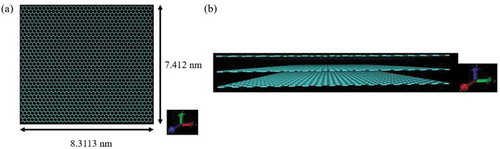
In this analysis, three graphene sheet layers were regarded as carbon fiber surfaces, similar to the previously created model [Citation36]. The graphene sheets were made using a program created by the authors and the size of the graphene sheets was 8.3113 nm × 7.412 nm on the x-axis and y-axis, respectively, and the number of carbon atoms was 2520. In addition, the infinite region was approximated by using periodic boundary conditions. depicts a graphene sheet model and a carbon fiber model.
Figure 2. Models of (a) graphene sheet and (b) carbon fiber
2.2. Calculation condition
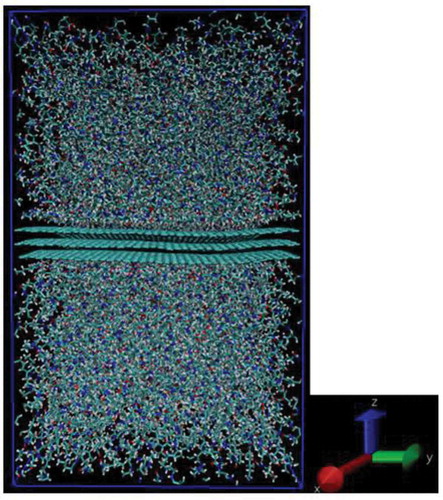
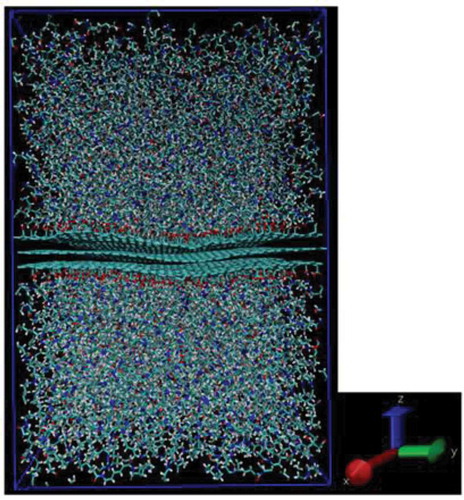
GROMACS5.1.2 [Citation37] software was used to perform the molecular dynamics (MD) calculations. For the force field, structure optimization, and electric charge calculation of the model created in Section 2.1, PolyParGen [Citation38,Citation39] was used, which can automatically determine the force field parameters, optimize the structure, and calculate the electric charge. OPLS-AA [Citation40] was used as the force field parameter. The functional functions and basis functions for structure optimization were performed using B3LYP/6-31 G*. Based on the optimized structure, the functional functions and basis functions of the electric charge calculation were performed utilizing MP2/6-31 G*. Note that the electric charge of graphene was calculated assuming that the graphene consisted of 252 carbon atoms and hydrogen atoms at edges and satisfying periodic boundary conditions; non-electric charge of infinite large graphene was not assumed. Van der Waals (vdW) and Coulomb interactions are included in the non-bond interaction section and the cutoff distance for the non-bond and Coulomb interaction energies was set to 1.0 nm. In addition, the bonding was controlled by the LINCS algorithm [Citation41], which is a bonding constraint method. In the initial structure, a resin molecule model was placed above and below three graphene sheets, as depicted in the schematic diagram in . In the MD simulation procedure, after energy minimization was performed to stabilize the structure, the structure was relaxed with an NVT ensemble at the appropriate melting temperature, a simulation time of 100 ps, and a simulation time step of 1 fs. The melting temperatures for TriA-X polyimide, the epoxy and vinyl esters, and PA6 were 673 K, 600 K, and 553 K, respectively. Then, in order to compress the system, the simulation was performed with an NPT ensemble at 1 atm, the appropriate melting temperature, a simulation time of 10 ns, and a simulation time step of 1 fs. Next, annealing was performed at 1 atm, a temperature change of 50 K/ns, and a simulation time step of 1 fs with the NPT ensemble, and the temperature was changed to 300 K. Then, in order to compress the system at 300 K, the simulation was performed with an NPT ensemble at 1 atm, 300 K, a simulation time of 10 ns, and a simulation time step of 1 fs. Finally, the structure was relaxed with an NVT ensemble at 300 K, a simulation time of 10 ns, and a simulation time step of 1 fs. The Nose-Hoover method [Citation42] was used for temperature control, and the Parrinello-Rahaman method [Citation43] was used for pressure control. The created system was used as an interface model by simulation as shown in .
Figure 3. Schematic diagram of initial placement
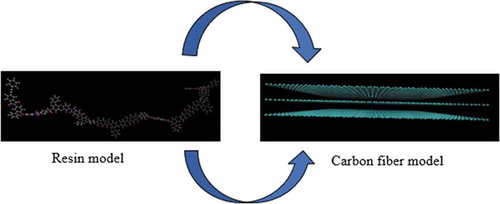
Figure 4. Snapshot of interface model for PA6 interface
The MD calculation was performed using the Exabyte.io [Citation44] cloud computer provided by Exabyte Inc.
2.3. Calculation results and discussion
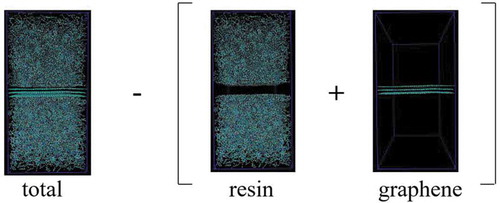
The interface energy per unit area () [Citation36] was defined by EquationEquation (1)
(1)
(1) as follows:
where ,
, and
are the energies of the entire system, the resin, and the three graphene sheets, respectively; and A is the interface area between the graphene sheet and the resin. EquationEquation (1)
(1)
(1) is schematically shown in .
Figure 5. Schematic diagram of interface energy extraction by energy balance calculation
lists the calculation results of the interface energy; however, these results were experimentally obtained from fibers without redox surface treatment and utilizing finite element analysis [Citation36]. In addition, the value of PA6, obtained by authors through the experiment [Citation36], is included in .
Table 1. Comparison of interface energy results via molecular simulation and interface strength results obtained experimentally [Citation36]
Negative surface energy means that interfacial adsorption has occurred [Citation36]. In other words, the stronger the interface energy absolute value, the stronger the interfacial adsorption will occur. The order of the interface energy absolute values was TriA-X polyimide> epoxy> vinyl ester> PA6, which was consistent with the interface strength. The experimental results show the interface strength of polyimide tetramer, and previous studies showed similar interface energies for polyimide tetramers and heptamers [Citation36]. Therefore, it can be inferred that the calculation results of the interface energies of polyimide tetramer and heptamer are the same. shows linear approximations passing through the origin of the interface energy and interface strength.
Figure 6. Approximate line of interface energy and interface strength
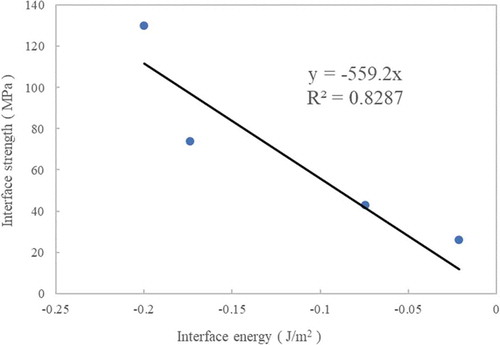
The coefficient of determination R2 for was 0.8287. In addition, the correlation coefficient was −0.91896. It is difficult to determine the interface strength via molecular simulation. Although interface strength and energy cannot be directly compared, indicates that there is a relationship between them. It is not coincidental that the relationship magnitude between the measured interface strength in and the interface energy obtained from the molecular simulations coincided. Hence, it can be suggested that the interface strength can be estimated from molecular simulations.
shows a comparison of the electric charge states of the graphene used in this study and the graphene utilized in a previous study, which did not consider the electric charge state [Citation36].
Figure 7. Electric charge state of (a) graphene model from a previous study [Citation36] and (b) graphene model used in this study
![Figure 7. Electric charge state of (a) graphene model from a previous study [Citation36] and (b) graphene model used in this study](/cms/asset/29b7b13e-68bb-4c29-8c57-1a034c7a161b/tacm_a_1791305_f0007_oc.jpg)
Interface energies using graphene without considering electric charge states previously obtained by the authors [Citation36], and show that the electric charge state of graphene has an effect on the interface energy.
3. Carbon fiber model with functional groups
3.1. Modeling
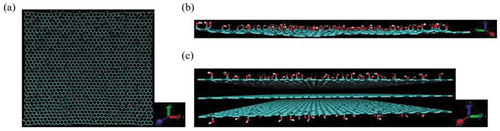
Until the previous section, the discussions were based on carbon fibers without redox surface treatment. From this point forward, it is assumed that oxidation treatment of the carbon fiber surface can be performed, and the interface energy between the resin and the graphene, which has a functional group, is discussed. The resin molecule model utilized was the TriA-X polyimide molecule, epoxy molecule, and PA6 molecule used in Chapter 2. Assuming graphene oxidation, three models were prepared by adding OH, COOH, or O functional groups to the graphene sheet used in Chapter 2. The addition ratio was 10%, which was randomly added to 252 carbon atoms. In addition, functional groups were added outwardly to the upper and lower graphene sheets. shows a graphene sheet model with a functional group and a carbon fiber model with a functional group.
Figure 8. Models of (a) graphene with OH group (x-y plane), (b) graphene with OH group (y-z plane), and (c) carbon fiber with OH group
3.2. Calculation condition
The charge of functionalized graphene was calculated in the same method as in Chapter 2 for the integrated model. The MD calculations were performed by the same method as that in Chapter 2 with the exception of the case using graphene with a COOH group. When using graphene with added COOH groups, an error (LINCS warnings) occurred in the NPT ensemble, which utilized same conditions as defined in Chapter 2 (at 1 atm, the corresponding melting temperature, and a simulation time step of 1 fs). However, the simulation time was reduced to 1 ns and the step size of the simulation was reduced to 0.1 fs. During annealing, LINCS warnings were ignored due to the computational cost; however, this effect is considered minimal [Citation45]. Errors occurred only at the melting temperature, suggesting that the COOH group atoms attached to the graphene were close to each other. This causes the bond to oscillate at higher temperatures, which produces an error due to collision or closer proximity of the atoms. No error occurred in the subsequent structural relaxation; therefore, ignoring the error has little effect on the results. As the same method in Chapter 2, the Nose-Hoover [Citation42] and Parrinello-Rahaman [Citation43] methods were utilized for temperature and pressure control, respectively. shows a snapshot of the interface model created with the added functional groups.
Figure 9. Snapshot of interface model between PA6 and carbon fiber model with COOH group
3.3. Calculation results and consideration
displays the calculation results of the interface energy in the interface model with functional groups. The table also shows the interface energies between the graphene without a functional group and the resin obtained in Chapter 2.
Table 2. Interface energy calculation results in an interface model with functional groups
In PA6, the order of magnitude of the interface energy absolute values was COOH group> OH group> O group> C (= no functional group), and it is assumed that the electrostatic interaction [Citation46] has a large contribution to this. For the COOH group in PA6, the presence of high electronegative atoms such as O and N [Citation46], which attract electrons, results in a polarization charge. Because the COOH group has a high O electronegativity, a bias of δ- in O and δ + in H occurs. Due to N and O in the amide bond in PA6, a bias of δ + in H and δ- in O occurs. As a result, it is assumed that the O of the COOH group with PA6 and the H of the COOH group with PA6 caused electrostatic interactions therefore stabilizing them. In the case of other functional groups, it is assumed that the interface energy absolute value increased due to the increased electrostatic interaction. In epoxy, the order of magnitude of interface energy absolute values was O group> OH group> C> COOH group. For graphene with a COOH group, it is assumed that the polarization charge of one of the COOH groups repels the polarization charge of the epoxy; consequently, the magnitude of the interface energy absolute value becomes smaller than that of graphene without functional groups. It is assumed that the other functional groups are stabilized by electrostatic interaction between the functional groups and the resin molecule. In the TriA-X polyimide, the order of magnitude of the interface energy absolute values was C > O group> OH group> COOH group. TriA-X polyimide has a high proportion of benzene ring molecules; therefore, when considering the interaction with unfunctionalized graphene, it is assumed that the influence of the π-π interaction [Citation47–50] is large. However, it is assumed that the π-π interaction was inhibited when the functional group was added to graphene. Therefore, it was determined that the interface energy absolute value was the highest when no functional group was added. As such, a future study investigating these assumptions should be performed.
4. Conclusion
In this study, considering the electric charge state, the interface energies between graphene and resin (TriA-X polyimide, DGEBA, triethylenetetramine, vinyl ester, and PA6) were evaluated via MD simulation. First, the interface energy and the experimentally obtained interface strength [Citation36] were compared. Subsequently, the Coefficient of determination R2 was calculated using linear approximations from the interface energy and the interface strength. In addition, the correlation coefficient was calculated and showed a high correlation. Based on this data, it was conjectured that a relationship exists between the interface strength and interface energy. Furthermore, the validity of the relationship magnitude between the interface strength experimentally obtained and the interface energy obtained using the MD simulation was evaluated. Moreover, considering graphene oxidation, the interface energies between the resin and the three forms of graphene (functionalized with OH, COOH, and O groups) were obtained and the effect of various oxidation surface treatments of graphene on the corresponding interface strengths was investigated. The differences in the functional groups were compared and the order of magnitude of the interface energy absolute values in epoxy was determined to be O group> OH group> no functional group> COOH group; however, no significant difference was found in the numerical values. In PA6, the order of magnitude of interface energy absolute values was COOH group> OH group> O group> no functional group, and the effect of the functional group was considerable. In TriA-X polyimide, the order of magnitude of interface energy absolute values was no functional group> O group> OH group> COOH group. Possible reasons for this are the inhibition of π-π interaction and electrostatic interaction.
Acknowledgements
Part of this study was carried out as part of the JST Future Society Creation Project (Problem ID: 19215408). I would like to express my gratitude here.
This study was also partially supported by JKA Foundation.
Disclosure statement
No potential conflict of interest was reported by the authors.
Additional information
Funding
References
- Koyanagi J, Hatta H, Kotani M, et al. A comprehensive model for determining tensile strengths of various unidirectional composites. J Compos Mater. 2009;43(18):1901–1914. .
- Kitamura R, Kageyama T, Koyanagi J, et al. Estimation of biaxial tensile and compression behavior of polypropylene using molecular dynamics simulation. Adv Compos Mater. 2019;28(2):135–146.
- Koyanagi J, Takeguchi K, Murai K, et al. Monte carlo simulations for blue-phase structure in liquid crystals. Mol Cryst Liq Cryst. 2017;656(1):54–65.
- Mahmud HA, Radue MS, Chinkanjanarot S, et al. Multiscale modeling of carbon fiber- graphene nanoplatelet-epoxy hybrid composites using a reactive force field. Compos PT B. 2019;172:628–635.
- Eslami H, Behrouz M. Molecular dynamics simulation of a polyamide-66/carbon nanotube nanocomposite. J Phys Chem C. 2014;118(18):9841–9851.
- Park C, Yun GJ. Characterization of interfacial properties of graphene-reinforced polymer nanocomposites by molecular dynamics-shear deformation model. J Appl Mech. 2018;85(9):091007.
- Jiang JW, Wang JS, Li B. Young’s modulus of graphene: A molecular dynamics study. Phys Rev B. 2009;80(11):113405.
- Shen J, Li X, Zhang L, et al. Mechanical and viscoelastic properties of polymer-grafted nanorod composites from molecular dynamics simulation. Macromolecules. 2018;51(7):2641–2652.
- Oya Y, Inuyama K, Okabe T, et al. Analysis of structure characteristics in laminated graphene oxide nanocomposites using molecular dynamics simulation. Adv Compos Mater. 2018;27(4):427–438.
- Lee S, Lyulin A, Frank C, et al. Interface characteristics of polystyrene melts in free-standing thin films and on graphite surface from molecular dynamics simulations. Polymer. 2017;116:540–548.
- Salahshoor H, Rahbar N. Nano-scale fracture toughness and behavior of graphene/epoxy interface. J Appl Phys. 2012;112(2):023510.
- Yang M, Koutsos V, Zaiser M. Interactions between polymers and carbon nanotubes: a molecular dynamics study. J Phys Chem B. 2005;109(20):10009–10014.
- Sahraei AA, Mokarizadeh AH, George D, et al. Insights into interphase thickness characterization for graphene/epoxy nanocomposites: a molecular dynamics simulation. Phys Chem Chem Phys. 2019;21(36):19890–19903.
- Li Y, Wang S, Wang Q, et al. A comparison study on mechanical properties of polymer composites reinforced by carbon nanotubes and graphene sheet. Compos PT B. 2018;133(15):35–41.
- Niuchi T, Koyanagi J, Inoue R, et al. Molecular dynamics study of the interfacial strength between carbon fiber and phenolic resin. Adv Compos Matter. 2017;26(6):569–581.
- Kumar A, Sharma K, Dixit AR. A review on the mechanical and thermal properties of graphene and graphene-based polymer nanocomposites: understanding of modelling and MD simulation. Mol Simulat. 2019;46(2):136–154.
- Azimi M, Mirjavadi SS, Hamouda AMS, et al. Heterogeneities in polymer structural and dynamic properties in graphene and graphene oxide nanocomposites: molecular dynamics simulations. Theory Simul. 2017;26(2):1600086.
- Alian AR, Meguid SA. Molecular dynamics simulations of the effect of waviness and agglomeration of CNTs on interface strength of thermoset nanocomposites. Phys Chem Chem Phys. 2017;19(6):4426–4434.
- Fang M, Wang K, Lu H, et al. Covalent polymer functionalization of graphenenanosheets and mechanical properties of composites. J Matter Chem. 2009;19(38):7098–7105.
- Han Y, Elliott J. Molecular dynamics simulations of the elastic properties of polymer/carbon nanotube composites. Comp Mater Sci. 2007;39(2):315–323.
- Gou J, Minaie B, Wang B, et al. Computational and experimental study of interfacial bonding of single-walled nanotube reinforced composites. Comp Mater Sci. 2004;31(3–4):225–236.
- Li Y, Wang S, Wang Q, et al. Enhancement of fracture properties of polymer composites reinforced by carbon nanotubes: A molecular dynamics study. Carbon. 2018;129:504–509.
- Chawla R, Sharma S. A molecular dynamics study on efficient nanocomposite formation of styrene–butadiene rubber by incorporation of graphene. Graphene Technol. 2018;3:25–33.
- Radue MS, Jensen BD, Gowtham S, et al. Comparing the mechanical response of di‐, tri‐, and tetra‐functional resin epoxies with reactive molecular dynamics. J Polym Sci B Polym Phys. 2018;56(3):255–264.
- Klimek‐McDonald DR, King JA, Miskioglu I, et al. Determination and Modeling of Mechanical Properties for Graphene Nanoplatelet/Epoxy Composites. Polym Compos. 2018;39(6):1845–1851.
- Li Y, Wang Q, Wang S. A review on enhancement of mechanical and tribological properties of polymer composites reinforced by carbon nanotubes and graphene sheet: molecular dynamics simulations. Compos PT B. 2019;160:348–361.
- Rahman R, Haque A. Molecular modeling of crosslinked graphene–epoxy nanocomposites for characterization of elastic constants and interfacial properties. Compos PT B. 2013;54:353–364.
- Sun R, Li L, Feng C, et al. Tensile property enhancement of defective graphene/epoxy nanocomposite by hydrogen functionalization. Compos Struct. 2019;224:111079.
- Yang S, Kwon S, Lee MY, et al. Molecular dynamics and micromechanics study of hygroelastic behavior in graphene oxide-epoxy nanocomposites. Compos PT B. 2019;164:425–436.
- Wang H, Jin K, Wang C, et al. Effect of fiber surface functionalization on shear behavior at carbon fiber/epoxy interface through molecular dynamics analysis. Compos PT A. 2019;126:105611.
- Li Y, Wang S, Wang Q. Enhancement of tribological properties of polymer composites reinforced by functionalized graphene. Compos PT B. 2017;120:83–91.
- Jin Y, Duan F, Mu X. Functionalization enhancement on interfacial shear strength between graphene and polyethylene. Appl Surf Sci. 2016;387:1100–1109.
- Bacova P, Rissanou AN, Harmandaris V. Edge-functionalized graphene as a nanofiller: molecular dynamics simulation study. Macromolecules. 2015;48(24):9024–9038.
- Pei QX, Zhang YW, Shenoy VB. A molecular dynamics study of the mechanical properties of hydrogen functionalized graphene. Carbon. 2010;48(3):898–904.
- Jiao W, Zheng T, Liu W, et al. Molecular dynamics simulations of the effect of sizing agent on the interface property in carbon fiber reinforced vinyl ester resin composite. Appl Surf Sci. 2019;479:1192–1199.
- Koyanagi J, Itano N, Yamamoto M, et al. Evaluation of the mechanical properties of carbon fiber/polymer resin interfaces by molecular simulation. Adv Compos Mater. 2019;28(6):639–652.
- Berendsen HJC, van der Spoel D, van Drunen R. GROMACS: A message-passing parallel molecular dynamics implementation. Comput Phys Commun. 1995;91:43–56.
- PolyParGen [Internet]. Available from: http://polypargen.com/.
- Yabe M, Mori K, Ueda K, et al. Development of polyParGen software to facilitate the determination of molecular dynamics simulation parameters for polymers. J Comput Chem Jpn Int Ed. 2019;5.
- Jorgensen WL, Maxwell DS, Tirado-Rives J. Development and testing of the OPLS all-atom force field on conformational energetics and properties of organic liquids. J Am Chem Soc. 1996;118(45):11225–11236.
- Hess B, Bekker H, Berendsen HJC, et al. LINCS: a linear constraint solver for molecular simulations. J Comput Chem. 1997;18(12):1463–1472.
- Evans DJ, Holian BL. The nose–hoover thermostat. J Chem Phys. 1985;83:4069–4074.
- Parrinello M, Rahman A. Polymorphic transitions in single crystals: A new molecular dynamics method. J Appl Phys. 1981;52:7182–7190.
- Exabyte.io. [Internet]. Exabyte Inc. Accessed on July 2019. Available from:https://exabyte.io/.
- Nazarychev VM, Lyulin AV, Larin SV, et al. Molecular dynamics simulations of uniaxial deformation of thermoplastic polyimides. Soft Matter. 2016;12:3972–3981.
- Little EJ Jr, Jones MM. A complete table of electronegativities. J Chem Educ. 1960;37(5):231–233.
- Sinnokrot MO, Valeev EF, Sherrill CD. Estimates of the Ab Initio limit for π−π interactions: the benzene dimer. J Am Chem Soc. 2002;124(36):10887–10893.
- Sinnokrot MO, Sherrill CD. High-accuracy quantum mechanical studies of π−π interactions in benzene dimers. J Phys Chem. 2006;110(37):10656–10668.
- Tsuzuki S, Honda K, Uchimaru T, et al. Origin of attraction and directionality of the π/π interaction: model chemistry calculations of benzene dimer interaction. J Am Chem Soc. 2002;124(1):104–112.
- Thakuria R, Nath NK, Saha BK. The nature and applications of π–π interactions: a perspective. Cryst Growth Des. 2019;19(2):523–528.