
ABSTRACT
Research on school improvement has accumulated an extensive list of factors that facilitate turnarounds at underperforming schools. Given that context or resource constraints may limit the possibilities of putting all of these factors in place, an important question is what is necessary and sufficient to turn a school around. We use qualitative comparative analysis (QCA) of 77 Swedish schools studied over 12 years to answer this question. Our core finding is that there is no “silver bullet” solution. Instead, there are several distinct combinations of factors that can enable school turnaround. The local school context is essential for which combinations of factors are necessary and sufficient for school turnaround. We discuss implications for research on school improvement and education policy.
Introduction
The question of how to turn around underperforming schools is central to education policy (Leithwood et al., Citation2010). Debates have raged over the relative merits of slow and steady improvement versus quick and radical efforts (Fullan, Citation2007; Kim et al., Citation2018), the need for new resources versus reorganisation (Hopkins, Citation2001; Murphy & Meyers, Citation2007), and the importance of context (Hallinger & Kantamara, Citation2001; Sun et al., Citation2007). The abundance of advice on how to turn around underperforming schools has resulted in a bewildering knowledge landscape for researchers and policymakers. It is easy either to focus on a “silver bullet” solution that ostensibly addresses all situations, or to be distracted by the wide range of suggested actions without a guide to prioritise among them. At the core of the problem lies the ever-present need to make trade-offs. Although improving schools in all the ways positively associated with school turnaround would be ideal, this may not be feasible. An alternative strategy is identifying the minimum conditions required to turn a school around, which we seek to do in this study.
The first step in sorting among the factors associated with school turnaround is acknowledging the importance of institutional context (Meyers & Smylie, Citation2017). For example, it is a moot point whether human resource management initiatives such as a swift replacement of teachers and principals are conducive to school turnaround if teacher shortages or employment laws render such action impossible. The second step is to admit the idea of equifinality, acknowledging that there can be several causal pathways through which a school can reverse its underperformance and that these pathways can sometimes be complex (van der Steen et al., Citation2013). However, allowing for causal complexity and equifinality presents methodological challenges. Regression analysis based on least-square methods does not lend itself to analysing equifinal processes (Ragin, Citation2014). While case studies allow for equifinality, standard case-study methods severely limit the number of cases that can be compared, thereby limiting the generalisability of findings and possible insights to be drawn.
We overcome these challenges by using qualitative comparative analysis (QCA), a method developed to enable systematic comparative analysis of medium-to-large numbers of case studies (Ragin, Citation2014). QCA enables the simultaneous analysis of multiple cases and yields the necessary and sufficient conditions for a particular outcome – in our case, school turnaround. Because the method can derive multiple sufficient solutions for an outcome, it allows for equifinality; in other words, we can obtain several different “recipes” for how to turn around a school.
We employed QCA to study the conditions behind the turnaround of underperforming schools in Sweden – a country that notably suffers from an increasingly sharp divide in performance outcomes across schools (Edmark et al., Citation2014; Holmlund et al., Citation2019). To do so, we constructed 77 single-organisation case studies of schools across Sweden sampled based on their sociodemographically adjusted educational performance over 12 years.Footnote1 The schools were sampled from the lowest performing quartile of schools in Sweden. We identified 42 schools that managed to turn around and end up above the median in terms of student performance during the period and compared them to a sample of 35 schools that remained in the lowest quartile throughout the period. Drawing on earlier case studies examining school success factors in Sweden and Scandinavia (Ahlström & Aas, Citation2024; Jarl, Andersson, & Blossing, Citation2017), we identified four conditions that contribute to school improvement and increased student achievement: a principal who is focused on core operations, a collaborative culture among teachers, pupils who experience high academic expectations, and a school organiser (municipal school district or independent school boardFootnote2) that works systematically with quality assurance.
Our research question is: What are the necessary and sufficient conditions for school turnaround? To answer this question, we tested which of these four conditions, alone or in combination, are necessary and/or sufficient for school turnaround. In addition, we explored the impact of two contextual factors on these conditions and their combinations. We validated and nuanced our findings through in-depth interviews with principals and school-district representatives and conducted several robustness tests. On the basis of these results, we discuss implications for research on school improvement and education policy.
To the best of our knowledge, this is the first study of school turnaround using QCA and the first systematic study of school turnaround in a Scandinavian setting. Our analysis suggests at least two distinct ways of turning around an underperforming school in Sweden. While we find no necessary or sufficient conditions that work in isolation, our findings suggest trade-offs that can ease the navigation of resource constraints and contextual factors to achieve a turnaround. In particular, some schools can successfully achieve turnaround without fulfilling all conditions, and the conditions needed vary across contexts. For policymakers, this should serve as a caution against general reform initiatives but also provide encouragement, as there are several paths to improve underperforming schools. For educational researchers, we offer an approach that enables analysis of causally complex and contextual pathways to school improvement.
Literature review
School turnaround
Most literature on organisational turnaround is found in the field of business management, but the last 2 decades have seen a rapidly expanding literature on turnaround in public organisations and schools (e.g., Jas & Skelcher, Citation2005; Leithwood et al., Citation2010; Murphy & Meyers, Citation2007). Prompted by the popular “No Child Left Behind” (NCLB) and “Race to the Top” programmes in the United States, many scholars have set out to study the conditions for, and outcomes of, initiatives to improve schools and school districts (Heissel & Ladd, Citation2018; Herman, Citation2012; Papay et al., Citation2022; Player & Katz, Citation2016). Studies of turnaround schools have also been conducted in Europe (Schaffer et al., Citation2012; Skedsmo & Huber, Citation2022) and Asia (Liu, Citation2017; Tao, Citation2022). However, most published research has consisted of conceptual work (Leithwood et al., Citation2010; Meyers & Smylie, Citation2017; Murphy & Meyers, Citation2007) and small-N case studies, that is, those involving only a few study subjects (Duke & Salmonowicz, Citation2010; Hallinger & Kantamara, Citation2001). The available large-N studies have predominantly been quantitative (regression-based) studies that have not addressed questions of equifinality (Boyne & Meier, Citation2009; Heissel & Ladd, Citation2018; Player & Katz, Citation2016).
The term turnaround school has been used in different ways across literatures to mean either a school that has substantially improved its performance or a specific model for school improvement in the US (Hansen, Citation2012; Hill et al., Citation2023; Meyers, Citation2012). We define school turnaround as a positive change in the educational performance of students in a school that is dramatic, substantial, or significant in magnitude and quick in speed (Herman, Citation2012; Liu, Citation2017; Peck & Reitzug, Citation2014). Concerning the difficult question of how much improvement is required for a case to be considered a turnaround, we follow earlier work in defining turnarounds.
Findings from quantitatively oriented studies in the US have pointed to a set of factors related to school turnaround. The first is the organisation of teachers (Boyne & Meier, Citation2009; Leithwood et al., Citation2010)Footnote3, although efforts at teachers’ professional development have sometimes been found detrimental to school turnaround (Heissel & Ladd, Citation2018). Effective school leadership is another factor identified across different studies (Boyne & Meier, Citation2009; Player & Katz, Citation2016). Murphy and Meyers (Citation2009) added that a school’s organisational capacity – in terms of culture and relations among its members – is crucial to turnaround.Footnote4 The context in which the school operates has also been found essential in terms of the support and resources available from those who organise the local school system – for instance, a school district or school board (Boyne & Meier, Citation2009; de la Torre et al., Citation2013; Player & Katz, Citation2016).
Case studies of turnaround schools in Europe have identified a similar set of factors but have typically placed greater emphasis on the complex relationship between these. Jas and Skelcher (Citation2005) developed a theoretical framework based on comparative case studies of 15 English local education authorities. Along with leadership capabilities, they emphasised the role of the governance chain – that is, the relationship between a school and its school board – in turning around a school. In addition, they found that the school leadership must be alert to poor performance (Jas & Skelcher, Citation2005) – an awareness that can be prompted by school board inspections. Skedsmo and Huber (Citation2022) examined turnaround strategies and outcomes in 10 schools in a large German city and reached similar conclusions; they emphasised the collective organisational effort required for school turnaround.
School turnaround as a complex process
Several studies have criticised the prevailing assumptions guiding turnaround programmes and research for downplaying the complexities of a school turnaround. Meyers and Smylie (Citation2017) questioned the policy focus on short-term initiatives and what they called the “myths” regarding school turnaround; for instance, that drastic measures equal improvement, that lasting change can happen quickly, and that turnaround is a problem and task for individual schools. They took issue with generic school improvement methods and argued instead that school turnaround is a contextually dependent challenge for the whole school system, not only for individual schools. This line of reasoning can also be found in Herman (Citation2012), who discussed the lack of generic and scalable turnaround strategies.
Central to these studies is the argument that there is no “silver bullet” solution for school turnaround, and generic success factors should be viewed with scepticism, as context and school system factors are vital. While effective leadership stands out as a critical factor, it is subject to many conditions – for instance, the organisation of teachers and the resources and involvement of the school district. Also, the turnaround process is not always linear in its progression. Meyers and Smylie (Citation2017) stressed that the improvement process can be uneven and does not necessarily have to be fast, nor does it need to follow a U-shaped trajectory of initial decline, stabilisation, and improvement. There can be reversals, multiple dips, and many other trajectories. Going one step further, van der Steen et al. (Citation2013) argued that the school improvement process could be conceptualised as loops with potentially unexpected, disproportionate, and delayed outcomes. Several other studies have found a myriad of factors interacting with and shaping the turnaround process (Henry et al., Citation2020; Herman, Citation2012), suggesting that a school's turnaround process is likely complex.
School turnaround in the Scandinavian context
Although there are, to our knowledge, no studies on school turnaround in the Scandinavian context, a related body of research on school improvement and educational effectiveness has discussed factors associated with more and less successful schools. These studies have suggested that high-performing schools are characterised by a principal focused on core operations, teachers who collaborate, high academic expectations of pupils, and a school district with a strong focus on systematic quality control (Ahlström & Aas, Citation2024; Jarl, Andersson, & Blossing, Citation2017; Jarl et al., Citation2021). Conversely, poorly performing Swedish schools tend to lack some or all of these conditions (Jarl et al., Citation2021; Jarl, Blossing, & Andersson, Citation2017).
The comparative case studies by Jarl, Blossing, and Andersson (Citation2017) and Ahlström and Aas (Citation2024) focused on the importance of high academic expectations of pupils and an organisational culture that allows the principal and organiser to conduct quality control and implement changes that are perceived as legitimate. In addition, a study by Adolfsson and Alvunger (Citation2017) emphasised that both teachers and school leaders must participate in the change process. Quantitative Swedish studies have also found that individual principals can causally impact student outcomes such as grades (Böhlmark, Grönqvist, & Vlachos, Citation2016).
These Scandinavian studies largely mirror the international turnaround literature in stressing the importance of school leadership that is focused on results. However, they differ in placing greater emphasis on the importance of teacher collaboration, organisational norms, and stability for high-achieving schools (Forfang & Paulsen, Citation2024). One possible reason could be that the Scandinavian context is characterised by strong labour laws that make it difficult to dismiss staff, which means that groups of teachers who do not collaborate may still significantly impact pupil performance. Another Swedish study by Liljenberg (Citation2022), surveying teachers and school leaders, found that a collaborative culture in teacher teams is the most critical factor for school improvement.
In line with the idea that school turnaround likely is a complex process, we can see these different findings – the importance of leadership, teacher collaboration and culture, quality control, and other support structures for the school – as possibly important factors that, together or separately, could lead to the turnaround of a school. In line with the standard QCA convention (Ragin, Citation2014) that we will discuss further in the method section, we used these findings as “conditions” that have been shown in earlier work to be causally related to school turnaround. Below, we formalise the earlier literature findings into conditions we will use in our study.
Conditions for school turnaround
Teacher Collaboration is the first condition that we identified from the literature. Several earlier studies have suggested that having teachers who collaborate is causally related to turning around a school (Boyne & Meier, Citation2009; Meyers & Smylie, Citation2017; Skedsmo & Huber, Citation2022). This condition denotes a situation of high teacher alignment regarding shared norms and a collective culture focused on learning, (e.g., Ahlström & Aas, Citation2024; Jarl, Blossing, & Andersson, Citation2017). Similarly, teachers sharing a vision of the school’s purpose has been described as a critical platform for organising teaching and school leadership when implementing change (Adolfsson & Alvunger, Citation2017; Leat et al., Citation2006).
Principal’s Focus on Core Operations is the second condition we identified. This condition speaks to the critical role of effective school-level leadership in the turnaround process, which has been stressed as a critical factor across a variety of school contexts (Jarl, Blossing, & Andersson, Citation2017; Jas & Skelcher, Citation2005; Murphy & Meyers, Citation2007). A principal who focuses on core operations works as an instructional leader to promote students’ knowledge development (Goddard et al., Citation2015). The principal, as a leader at the school level, has also been found vital for setting out a vision and actively leading by example (Höög et al., Citation2005; Skedsmo & Huber, Citation2022). The principal’s role as the instigator of the turnaround processes has been motivated by the need to align the school towards a common goal focused on core operations, that is, educating pupils (Jarl, Blossing, & Andersson, Citation2017).
High Academic Expectations is the third condition at the school level. It has been shown in empirical studies of Swedish schools (Ahlström & Aas, Citation2024; Jarl, Blossing, & Andersson, Citation2017), as well as internationally (Hitt & Meyers, Citation2018; Papay et al., Citation2022), that consistently high academic expectations of pupils are essential for improving underperforming schools. High academic expectations have commonly been described as an important aspect of students’ classroom experiences, reflecting the extent to which teachers value academic achievement and expect that all students can and should work towards their full potential. A school that cannot set consistently high academic expectations risks blaming the school’s poor performance on pupil characteristics such as the lack of motivation or capability or background factors such as socioeconomic disadvantage. This condition does not necessarily stress a “culture of excellence” but denotes that teachers firmly believe all pupils can and should succeed (Jarl, Blossing, & Andersson, Citation2017).
The School District’s Systematic Quality Assurance is our fourth condition. This condition captures essential aspects at the district or municipal level. Research has shown that the quality of a school can depend on the interplay between the school and the school district, as the central administration provides and allocates resources (Jarl, Blossing, & Andersson, Citation2017; Jas & Skelcher, Citation2005). International research on school turnarounds has also stressed that the school district must be involved in the turnaround process as schools are a part of organisational systems (Meyers & Smylie, Citation2017). In the Swedish context, school districts evaluate and incentivise school development through their systematic quality assurance work (Ahlström & Aas, Citation2024). This can be done by the municipal board of education or the school corporation board, depending on whether the school is public or independent. For clarity, we will refer to all these types of actors simply as “the school district”.
Contextualising the conditions
Besides these four core conditions that we expect to be related to school turnaround, we also explored a few contexts under which our conditions may behave differently. Several contextual conditions have been suggested in earlier work as important in differentiating schools’ varying prospects of achieving a turnaround – the socioeconomic status (SES) of a school’s pupils, its financial resources, and whether it is in an urban or rural area (Boyne & Meier, Citation2009; Meyers & Smylie, Citation2017; Murphy & Meyers, Citation2007). Out of these, we focus on pupils’ SES and whether or not the school is located in an urban setting, as the question of financing is relatively less important in differentiating the possibilities of a school turnaround in the Scandinavian setting (Ahlström & Aas, Citation2024; Jarl, Blossing, & Andersson, Citation2017). Although municipalities differ in financial strength, extensive cross-municipal transfer systems exist to even out such differences. The municipality funds all schools – whether privately or municipally operated – and the funding for each school compensates for differences in pupil population SES to promote educational equity. This does not mean that all Swedish schools are financially equal but that redistributive systems are in place to minimise the effects of socioeconomic differences.
Whether a school is in an urban or non-urban context may also influence the operation of our four identified conditions in several ways (Jarl, Blossing, & Andersson, Citation2017). Most importantly, urban contexts are more likely to be competitive settings – where several schools contend for principals, teachers, and students – than non-urban settings (Böhlmark, Holmlund, & Lindahl, Citation2016; Borman & Dowling, Citation2008; Edmark et al., Citation2014; Guarino et al., Citation2006). It is, a priori, unclear whether a turnaround is inherently easier in one context than the other. In competitive urban contexts, the opportunities for principals and teachers to change employers are greater, potentially eroding collegial cultures and complicating turnaround efforts. Conversely, a higher turnover of staff might facilitate replacing dysfunctional teams. Also, in districts with multiple schools, attention from the school district officials may be divided. On the other hand, there is more potential for sharing resources and leveraging quality control insights across schools compared to non-urban areas with fewer schools. Additionally, there is a “local community effect” to consider. In non-urban contexts, principals and teachers often have more social interactions with pupils’ parents outside of school, fostering a feedback mechanism for quality control that might be less prevalent in urban settings.
Studies in the US context have shown a positive relationship between a human resource management strategy of upgrading the human capital of a school (i.e., the quality of teachers and principals in terms of educational attainment, qualifications, breadth of experience, and tenure within the educational system) and school turnaround (Harbatkin, Citation2023; Henry et al., Citation2020). However, Swedish employment laws severely curtail the possibility of strategically replacing lower quality teachers/principals with higher quality ones. Staff can only be dismissed in order of employment (last in, first out) and on grounds of redundancy or exceptional misconduct with at least 3 months’ notice.Footnote5 Thus, using human resource management to alter school-level human capital is rarely a possible strategy for rapid turnaround in the Swedish context. We therefore focus on the SES profile of schools and whether they are in an urban or rural area as contextual conditions.
We also regarded the visibility of a school’s underperformance as a context that may modify the operation of the conditions in the analysis. In a comparative case study of a Swedish and a Norwegian school, Ahlström and Aas (Citation2024) showed that a school that was conspicuously low performing (i.e., displaying poor performance in absolute terms) demonstrated more success in executing a turnaround compared to a school that, although not performing poorly in absolute terms, was underperforming when its results were linked to the pupils’ SES. In their analysis, Ahlström and Aas (Citation2024) highlighted that the latter school lacked insight into its underperformance. This discovery resonates with a well-established principle in organisational change theory that posits that organisations tend to initiate change efforts only when their expectations or aspirations are unmet (Cyert & March, Citation1963; Greve, Citation1998).
As we included both absolutely and relatively (in relation to pupil SES profile) poorly performing schools in our sample, we could identify the external pressure for change at a school (Change Pressure) based on its absolute performance. The intuition behind this condition is that if a school is performing poorly in absolute terms, it may come under external pressure – for instance, from the school district, parents, or local media – to improve pupil outcomes (Adolfsson & Alvunger, Citation2017; Larsson Taghizadeh, Citation2016). Since these stakeholders are less central to the organisation than teachers and principals, it has been argued that they are likely more receptive to absolute performance measures (Abdulkadiroğlu et al., Citation2020). Schools experiencing this additional pressure may be more prone to take measures to turn the school around compared to schools that only perform poorly relative to pupil SES.Footnote6 This is heightened by the fact that Swedish schools (since 1991) compete for students through a universal voucher system. This means that a poorly performing school, insofar as stakeholders are aware of its performance, would have difficulty attracting students, especially those with strong academic backgrounds. However, competition is limited or non-existent in non-urban municipalities with only one or a few schools. This condition also accounts for possible differences in the organisational capacity of schools, given that schools and school organisers in non-urban contexts may have more limited financial and human resources (Hallinger & Liu, Citation2016; Hargreaves et al., Citation2009).
A general conclusion from the literature overview is that school turnaround is a complex matter (van der Steen et al., Citation2013). The extensive list of conditions identified in various contexts related to successful school turnaround provokes several questions for researchers, educational policymakers, and practitioners. How does one prioritise among the many conditions conducive to school turnaround? How are these factors causally related? Are these conditions additive, such that more is better, or are certain conditions replaceable by others? Can some conditions even block the workings of other conditions? Can there be more than one way to turn a school around? To address these questions of causal complexity and possible equifinality, we introduce the QCA method in the next section.
Method
Qualitative comparative analysis
Qualitative comparative analysis (QCA) is a method for examining how different combinations of conditions form a causal chain to generate a particular outcome (Ragin, Citation2014). QCA follows more or less the steps of any comparative case analysis: define the theoretical concepts under investigation, empirically operationalise these for several cases, and systematically compare how the concepts relate to an outcome of interest across cases. The difference lies in QCA’s ability to handle larger numbers of cases analytically.
A QCA analysis begins by identifying conditions – factors that in previous research literature have been found or credibly argued to be causally related to the outcome of interest. QCA is not primarily a method for testing these individual causal relationships but for analysing how several already known causal relationships (conditions) combine to generate an outcome. In our study, one example of a condition known from earlier literature as a possible cause of school turnaround is teacher collaboration; another is teachers having high academic expectations of students.
The next step is to operationalise these conditions empirically – that is, clearly define what determines the fulfilment of each condition being assessed, including the outcome in the particular context of the empirical study. This is known as the “calibration of conditions” and involves specifying clear and precise empirically grounded criteria for each condition. The calibration process aims to ensure a relevant variation in qualitative states, enabling researchers to accurately assess their relationship with the outcome of interest. Calibrating conditions – deciding what constitutes the criteria for deciding whether a particular case is “in” or “out” of a condition – is essential when conducting QCA. Like other qualitative approaches, it should be based on theoretical and expert knowledge about the empirical context to capture relevant variation when setting a qualitative anchor (Ragin, Citation2008; Schneider & Wagemann, Citation2012). To continue the example, calibration involves defining what would empirically constitute a turnaround of a school (outcome) and what would empirically constitute good teacher collaboration and high academic expectations of students.
There are two main approaches to calibrating conditions. In the “crisp-set” approach, each case is classified as either fully present or entirely absent in terms of a particular condition: Cases either meet the criteria for inclusion or not (Ragin, Citation2008). This approach assumes binary distinctions between the presence and absence of conditions, with no shades of grey in between. Crisp-set analyses are often easier to interpret and apply (Schneider & Wagemann, Citation2012). In contrast, the “fuzzy-set” approach involves assessing the degree to which each case meets the inclusion criteria. This approach acknowledges that case inclusion in a condition sometimes may exist on a continuum. The choice between these approaches depends on the nature of the data, the complexity of the relationships being studied, and the level of precision required in the analysis. We chose a crisp-set approach as it enables more straightforward calibration and interpretation, and the outcome (turnaround) and many conditions lend themselves to binary classification.
In the first step, QCA generates a table, referred to as a “truth table”, where each row depicts a possible combination of conditions and indicates whether the outcome is present or not. By analysing the truth table, we can systematically identify configurations of conditions or “recipes” for the outcome. The QCA process is, thus far, similar to any comparative case study, but with the advantage that the number of cases in the analysis can be greater. To handle a large truth table, including many cases, QCA utilises set-theoretical logic, Boolean algebra, and a minimisation algorithm to reduce the truth table into relevant configurations or “solutions”. At the core of QCA is the idea that complex causal chains can be understood as configurations of separate causal conditions (Ragin, Citation2014). In our example, high academic expectations and teacher collaboration are separate conditions of a school that are causally related to school turnaround (along with other possible conditions).
By comparing cases (schools that turn around alongside those that do not), QCA enables an analysis of what conditions – separately or in combination – are necessary and/or sufficient for school turnaround (Schneider & Wagemann, Citation2012). A necessary condition is present whenever the outcome (school turnaround, in our case) is present, although there can be cases where the condition is present but not the outcome. For a sufficient condition, the outcome is present whenever the condition is present, although there can be cases when the outcome is present but not the condition (Schneider & Wagemann, Citation2012).
A QCA analysis thus identifies the different solutions for school turnaround. For instance, we may learn that high academic expectations are sufficient in a particular solution but must be coupled with a collaborative culture among teachers in other solutions. QCA also allows for equifinality, that is, the possibility that different recipes can lead to the same outcome, and causal asymmetry, meaning that the presence of a condition can lead to an outcome, while its absence (negation) does not necessarily lead to the negation of the outcome (Schneider & Wagemann, Citation2012). In addition, some conditions can, in effect, be irrelevant to a solution, as either their presence or their absence can lead to the outcome. This approach allows for an analysis that can handle causal complexityFootnote7 and contextual nuance while clarifying the relative importance of the different causal conditions.
In the next step, QCA involves assessing the solutions in terms of consistency and coverage. Both measures are essential for evaluating the explanatory power and robustness of solutions. Solution coverage refers to the extent to which the combinations of conditions within a solution account for the occurrence of the outcome across cases. Solution consistency measures how consistently the solution yields the outcome (Oana et al., Citation2021; Schneider & Wagemann, Citation2012). QCA further distinguishes between raw coverage and unique coverage. Raw coverage is the proportion of cases in the data set that are accounted for by the combinations of conditions identified in a particular solution without considering any overlap or redundancy between solutions. It gives a general idea of how well the solution explains the outcome across the entire data set. On the other hand, unique coverage considers only cases uniquely explained by a specific solution, showing each solution’s distinct contribution not covered by alternative solutions, that is, cases exclusively associated with particular combinations of conditions.
QCA has been used in various fields, such as sociology, political science, and management studies, to explore complex relationships between conditions (Thomann, Citation2020). Lately, there has been growing recognition across various social science disciplines of the method’s capacity to generate innovative insights into enduring questions by allowing for theorising and investigating equifinality and conjunctive relationships and stimulating fresh avenues of research (Furnari et al., Citation2021). Even though QCA has been suggested as a valuable methodological approach to understanding the multifaceted nature of educational systems and outcomes (Bingham et al., Citation2019), the potential of this approach remains largely untapped in education research (Cilesiz & Greckhamer, Citation2020). There are examples of studies where QCA has been employed to investigate the combination of factors that contribute to student achievement (Yu & Jiang, Citation2022) in comprehensive and selective schools (Glaesser & Cooper, Citation2012) and higher education (Capano & Pritoni, Citation2020). To our knowledge, no research has applied QCA to school improvement research nor to the specific study of school turnaround.
Why QCA
We used QCA, given that the causal processes behind a school turnaround may be complex and that there can be several ways in which a school can be turned around. An alternative way to deal with questions of causal complexity is the standard comparative case method – see, for instance, Jarl, Blossing, and Andersson (Citation2017). This would, in principle, be similar to using a QCA, but with the drawback that it would be exceedingly difficult to compare a larger number of cases (Ragin, Citation2014). Manually comparing 77 cases along four dimensions plus two contextual dimensions of possible similarity and difference is a task that would daunt most researchers.
Alternative analysis methods, developed to handle a larger number of cases, are techniques of statistical regression, which is the standard method used for large-N studies of school turnarounds. Regression methods allow for sophisticated tests of causal relationships and accuracy in estimations of effect sizes. QCA, on the other hand, has not been developed to test specific causal relationships but to analyse complex chains of already-known causal relationships. The two methods are thus, in a sense, complementary: While regression-based methods establish specific causal relationships, QCA enables the analysis of how several such relationships fit together in complex causal chains to generate an outcome (Ragin, Citation2014).
The central limitation of a regression-based approach, with respect to our purposes, is that it provides an estimation of the net effects of each of the factors related to the turnaround of a school (Ragin, Citation2014) under the presupposition of a relatively straightforward causal story: More of everything will lead to a better result, while the absence of factors will lead to a worse result. It is, of course, possible to model a more complex causal story using, for instance, interaction terms, but the results often become difficult to interpret (Furnari et al., Citation2021). This is a significant limitation, given that school turnaround has been argued to be a complex process that can be equifinal, that is, that there can be several different causal paths to turnaround (Meyers & Smylie, Citation2017; Murphy & Meyers, Citation2007). To turn around a school, as suggested in the literature review, you need motivated students, competent and collaborating teachers, a results-oriented principal, and a school district that is supportive yet demanding. As noted, it is possible that these conditions could combine in more complex ways. Perhaps a principal focusing on core operations is all that is needed? Alternatively, there may be no turnaround if teachers do not collaborate – no matter how focused the principal is, how high the academic expectations of pupils are, or what sort of quality assurance system the school district has in place. Perhaps high academic expectations are only important when a principal focuses on core operations? These speculations suggest a need to investigate causal chains of greater complexity – which motivates using the QCA method (Furnari et al., Citation2021; Ragin & Fiss, Citation2008). Instead of assuming, as in a typical regression-based study, that it is only the causalityFootnote8 of student + teacher + principal + school district that generates a turnaround, we can ask conjunctive questions: whether the student condition and the teacher condition, but without a strong principal, can lead to a turnaround; whether the teacher condition and principal can lead to a turnaround without the student condition being fulfilled – and so on.
The ability to use conjunctive theorising and analysis is essential as turnarounds are, as has been noted earlier, diverse. QCA allows us to disentangle messy empirical observations into multiple context-specific recipes for school turnaround – something called for in both research and educational policy (Herman, Citation2012; van der Steen et al., Citation2013). In sum, we employed QCA as it allowed us to deal with the complexity of school turnaround: We could retain some of the richness and contextual sensitivity of case studies while still striving to identify broader patterns.
Operationalisation of educational performance
The outcome of interest in our study is school turnaround, that is, a positive change in the educational performance of the students in a school that is dramatic, substantial, or significant in magnitude and quick in speed (Herman, Citation2012; Liu, Citation2017; Peck & Reitzug, Citation2014). We operationalised the educational performance of schools as the percentage of pupils achieving at least a pass grade in all subjects, adjusted for SES indicators. We drew on data for educational performance from the Swedish National Agency for Education’s publicly available database (Skolverket, Citationn.d.-a). This comprehensive database offers a SES index per school based on background variables, which education authorities and providers officially acknowledge and use to allocate resources. It is a weighted average score per school based on three SES indicators: parents’ highest level of education, the ratio of boys to girls to account for the reversed gender gap in education where boys are falling behind (Holmlund et al., Citation2019; Quenzel & Hurrelmann, Citation2013), and the ratio of newly immigrated pupils.Footnote9 The database also includes absolute pupil performance, predicted school performance (contingent upon pupil SES), and SES-adjusted pupil performance. The adjusted performance measure was quantified as a residual derived from a least-square model predicting the percentage of pupils achieving at least a passing grade in all subjects upon completing compulsory schooling (Year 9) based on the SES index.
Using SES-adjusted performance allowed us to identify underperforming schools across the performance spectrum and examine solutions for different types of underperformers.Footnote10 A SES-adjusted measure also enabled us to capture genuine improvements in schools’ educational performance rather than outcomes that merely reflected shifts in pupil demographics due to, for instance, neighbourhood gentrification. We chose the percentage of pupils achieving at least a passing grade in all subjects over the alternative of student grades to minimise the issue of grade inflation – which in Sweden is more prevalent in the top grades (Henrekson & Wennström, Citation2022).
Turnaround and non-turnaround schools
All conditions in this study were operationalised as “crisp sets”, meaning that schools were either in or out of any particular condition (Ragin, Citation2008). For the outcome condition, this meant that a school either achieved a turnaround or did not. To operationalise the definition of school turnaround, we began with the identification of underperforming schools. While poorly performing schools have been the subject of ongoing policy debate and media attention, particularly highlighted by Sweden’s disappointing results in the Programme for International Student Assessment rankings of 2012 and 2015 (Organisation for Economic Co-operation and Development, Citation2012, Citation2018), the Swedish policy context lacks a formal definition of low-performing schools. We chose to use the lowest performance quartile of schools – that is, the 25% worst-performing schools, a benchmark used by the Swedish School Inspectorate (Skolinspektionen, Citation2021), to identify schools with persistently poor academic results.
Utilising data spanning the years 2008–2019, we calculated a 5-year centred moving average of the SES-adjusted performance of each school for the period 2010–2017. Since the raw data for the moving average performance were based upon a residual from an ordinary least square regression that normalised pupil performance based on pupil demographics of 1,442 schools (Skolverket, Citationn.d.-a), it had a median close to 0 (0.6). The threshold for the lowest quantile was −3.2. As the outcome variable was based on the percentage of students passing all subject grades in ninth grade, the absolute distance between the two thresholds was approximately 3.8 percentage points, which translates to approximately another seven to nine students passing all subjects for a school with around 200 students in lower secondary school. Setting the thresholds for the median and quartile that defined our sample based on moving average values had the advantage of placing less weight on extreme values, which helped us capture sustained changes in school performance rather than short-term fluctuations in pupil achievement, aligning with the recommendations of school improvement and turnaround research (Jarl, Blossing, & Andersson, Citation2017; Murphy & Meyers, Citation2007).
Schools were categorised as underperforming if their moving average value fell within the lowest quartile for at least 2 consecutive years between 2010 and 2015, indicating a prolonged period of underperformance spanning potentially 6 to 9 years from 2008 to 2017. To ensure continuity and relevance of our measure, we focused on schools that maintained active educational programmes throughout the period and excluded those that existed for less than 5 years between 2008 and 2019. In total, we had a sample of 1,442 schools (data from Skolverket, Citationn.d.-a). Of these 1,442 schools, 369 were identified as underperforming – that is, approximately 25%.
Within this group of underperforming schools, we calibrated turnaround schools as schools that transitioned from the lowest quartile to performing above the median. Specifically, a school was calibrated as a turnaround case when it achieved a moving average value above the median for at least 2 consecutive years between 2013–2017 – capturing a 6- to 8-year period from 2011 to 2019 because of the way that moving averages are calculated. Of the 369 underperforming schools, 62 met our criteria for turnaround – that is, roughly 18% of all underperforming schools managed to turn around according to our operationalisation.
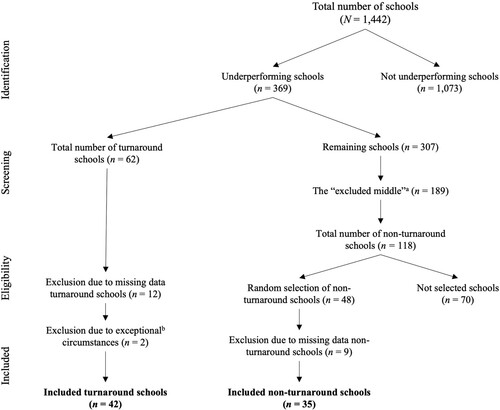
To provide a comparison group, we selected an equivalent number of non-turnaround schools. These were consistently underperforming schools that functioned as a type of control group. For this group, we used data from 2014–2019 to identify schools that remained in the lowest quartile throughout the period. Since cases in a crisp-set QCA are always entirely in or out of a condition, calibrating the negation of the outcome inevitably involves adhering to the “rule of the excluded middle” (Oana et al., Citation2021). This meant that to reduce ambiguity in the calibration of a school turnaround, we excluded schools that only transitioned from the fourth (lowest) to the third (second lowest) performance quartile. This exclusion of the middle resulted in 118 non-turnaround schools, constituting approximately 32% of all underperformers. To maintain intimacy with our cases and a balanced sample of turnaround and non-turnaround schools, we randomly selected 48 schools from the group of 118 continuously underperforming schools. This resulted in a sample of 110 schools with a ratio of 56% turnaround schools to 44% non-turnaround schools. However, when matching schools with survey data for the causal conditions, we encountered some issues with missing data. As a result, we were obliged to exclude 12 turnaround and nine non-turnaround schools. Additionally, two more turnaround schools were excluded due to exceptional circumstances. One was a bilingual school, and the other had a peculiar grade pattern with a significant drop one year. These were removed as they were considered non-representative of the sample. This left us with a final sample of N = 77 schools, comprising n = 42 turnaround schools and n = 35 non-turnaround schools. A flow chart of the sample selection process is provided in .
Figure 1. Flow chart of the sampling process.
aThe “exluded middle” are schools that only moved from 4th to 3rd quartile.
bOne was bilingual, and one had a peculiar grading pattern.
Calibration of conditions
The data for calibrating the causal conditions were collected from several public sources: the Swedish School Inspectorate’s teacher and pupil survey (Skolinspektionen, Citation2020b), the School Inspectorate’s regular inspection visits to schools and school districts (Skolinspektionen, Citation2020a), the Swedish National Agency for Education (Skolverket, Citationn.d.-b), and the Swedish Association of Local Authorities and Regions (Sveriges Kommuner och Regioner, Citation2021). When calibrating the conditions, we drew upon a mix of theoretical knowledge from previous literature, one author’s expert knowledge of the Swedish school system, archival material from the Swedish School Inspectorate, and interviews and discussions with nine experienced teachers, principals, and school administrators.
We calibrated Teacher Collaboration, Principal’s Focus on Core Operations, and High Academic Expectations in similar ways, as the data for these conditions came from the same mandatory annual surveys (Skolinspektionen, Citation2020b) that collect responses from teachers and pupils using a Likert scale. Responses were normalised into an index score by the Inspectorate, which is the school-level average, evenly distributed at 0, 3.33, 6.67, and 10 between the four options used to calculate the index score (fully agree = 10, partially agree = 6.67, partially disagree = 3.33, and fully disagree = 0). Since the outcome variable (school turnaround) was measured as change over time, our explanatory conditions were expected to exhibit variation over time (Fullan, Citation2007; Kim et al., Citation2018; Leithwood et al., Citation2010; Murphy & Meyers, Citation2007). For instance, if perceptions of the principal changed such that they were no longer seen as neglecting core operations but actively focusing on them instead, this change would suggest a potential reason for a turnaround. However, as QCA conditions can work in conjunction with other conditions, a condition that does not change can still be important when combined with a change in another condition. Thus, we operationalised the conditions Teacher Collaboration, Principal’s Focus on Core Operations, and High Academic Expectations as either an increased score over time (change) or as a consistently high score over time (state; Gresov & Drazin, Citation1997; Sebastian et al., Citation2014). To be classified as change, the index score had to increase at least .67 between the first and last observations. This meant that at least 20% of teachers increased their response by one step on the Likert scale, which was substantial enough to indicate actual change. When calibrating state, the average index score had to be above 8.34 for all observations; 8.34 was also the crossover point where respondents, on average, were closer to fully agree than partially agree for the survey item. Hence, our analytical procedure did not distinguish between change and state in a particular condition but highlighted what conditions and combinations thereof lead to a successful school turnaround.Footnote11
School District Quality Assurance was calibrated using data from the Skolinspektionen (Citation2020a) regular reports on systematic quality work. We used the survey item indicating whether or not the school district in question was assessed to be working sufficiently with systematic quality assurance, which is a binary assessment by the Inspectorate. Since this variable had fewer observations than the teacher and pupil surveys, we operationalised it only as a state condition. We used the latest observation from the inspectorate to stay as close to the turnaround time as possible.
The contextual condition Change Pressure was constructed from publicly available data on the share of pupils who leave compulsory schooling with complete grades (Skolverket (Citationn.d.-b), making them eligible for upper secondary school. This threshold determines access to further education and is commonly reported in the media and assessed by decision makers as a critical measure of success. Schools with a large share of pupils finishing elementary school without complete grades are commonly seen as underperforming (Skolinspektionen, Citation2021) and occasionally appear in the media as “the worst schools in Sweden” (The Local Sweden, Citation2016). We operationalised this condition as a crisp set based on the average ratio of pupils leaving ninth grade with complete grades between 2008 and 2014. The threshold was 90%, equal to the national average of 90.43%. The variable was thus a proxy for the external pressure from authorities, parents, media, or other stakeholders that may arise from underperforming in absolute numbers. For example, in a school with 90% of pupils or fewer with complete grades, this means a “failure rate” of at least one in 10 pupils over a substantial period, likely to have a symbolic meaning for external stakeholders.
We also constructed an additional contextual condition by splitting the sample into Urban and Non-Urban subsamples by using the general categorisation of Swedish municipalities into nine typologies depending on population size and commuter patterns (Sveriges Kommuner och Regioner, Citation2021). As mentioned earlier, Swedish schools compete for students through a universal voucher system. However, some municipalities have only one or very few schools, reducing or avoiding competition (Edmark, Citation2019; Jarl, Blossing, & Andersson, Citation2017). The relevant variation we wanted to capture was population density (as a proxy for school competition) and commuting patterns related to the supply of teachers and pupils, approximating organisational capacity and ease of reorganisation. An urban municipality either (a) has a population of at least 50,000 inhabitants, of which at least 40,000 live in the municipality’s largest city, or (b) at least 40% of the population commute daily to one of Sweden’s three largest cities: Stockholm, Göteborg, or Malmö. The remaining municipalities were categorised as “non-urban municipalities”. The data sources and calibration for each condition are summarised in .
Table 1. Conditions summarised.
All conditions were calibrated as crisp sets. To verify our choice of a crisp-set analysis, we explored the stability of our findings in relation to changes in the calibration of our different conditions (see Online Appendix 1). These additional analyses suggested that our findings were not particularly sensitive to the exact calibration of conditions, which gave us some confidence that a fuzzy-set QCA would generate broadly similar results.
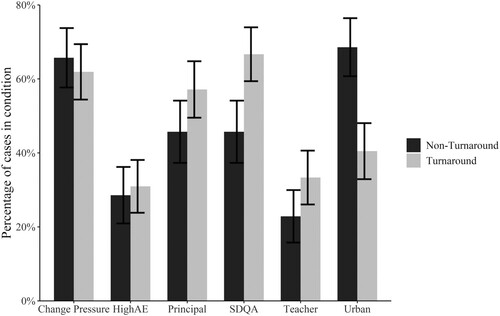
shows the distribution of causal conditions among the turnaround (lighter bars) and non-turnaround (darker bars) schools, indicating sufficient variation across all conditions – that is, the presence/non-presence of a condition was no more skewed than a 20/80 ratio as per the rule of thumb in Oana et al. (Citation2021). Most turnaround schools were in the set of schools where either or both of the conditions Principal’s Focus on Core Operation and School District Quality Assurance were present, while Teacher Collaboration and High Academic Expectations were rarer. Most turnaround schools in our sample were in non-urban municipalities, with approximately 40% of the schools in urban municipalities (the national average is approximately 34%). Finally, it is interesting to note that although about 60% of schools in our sample were subject to change pressure in terms of absolute performance, about 40% of turnaround schools were not visibly underperformers compared to the national mean. Such underperformers might have gone unnoticed if SES-adjusted data had not been utilised. For detailed descriptive statistics, see Online Appendices 2 and 3.
Figure 2. Distribution of causal conditions for turnaround and non-turnaround schools.
Note: HighAE = High Academic Expectations; SDQA = School District Quality Assurance.
Results
We performed the analysis in four steps. First, we examined a baseline set of solutions for the four conditions on the entire sample. Second, we added the contextual condition Change Pressure. These first two steps were taken to provide a reference point for the further sets of solutions and to examine the effect of adding contextual nuance in the form of Change Pressure. We then added the second contextual condition by splitting the sample into urban/non-urban subsamples for further contextual nuance. In the fourth and final step, we examined the negation of the outcome, that is, the failure to turn around, and analysed what conditions hinder schools from turning around. This is considered standard QCA practice (Oana et al., Citation2021; Schneider & Wagemann, Citation2012) and is necessary as we should not assume symmetrical causation (i.e., that the absence of a condition gives the opposite effect to its presence).
In each analysis, we investigated the conditions or combinations of conditions that were necessary and/or sufficient for the outcome. None of the conditions were necessary for school turnaround, whether alone or in combination – that is, no conditions or sets of conditions were always present whenever we observed a turnaround. For details on the necessity analysis, see Online Appendix 4.
As the analysis yielded no necessary conditions, we proceeded by analysing sufficient conditions (conditions whose presence means that the outcome will always be present). This was done through a minimisation process to present as simple solutions as possible (Ragin, Citation2000; Schneider & Wagemann, Citation2012). The analysis yielded combinations of conditionsFootnote12 that were sufficient for the outcome. We assessed the solutions in terms of consistencyFootnote13 and coverage.Footnote14 For details on the QCA minimisation algorithm employed in this study to reduce the cases to solutions, see Online Appendix 5.
Analytical Step 1
Analytical Step 1 constituted the baseline solution set for examining sufficient conditions for predicting school turnaround in the entire sample, based on the conditions Teacher Collaboration, Principal’s Focus on Core Operations, High Academic Expectations, and School District Quality Assurance. It is presented in . The rows indicate solutions resulting from the minimisation process that generated the simplest solutions possible – in terms of the presence or absence of conditions – that lead to the outcome (Schneider & Wagemann, Citation2012). Each row can be considered a “recipe” that leads to the outcome of a turnaround. The first four columns (1–4) in indicate whether a condition is present or absent in the solutions. Each condition’s presence is indicated by “●” and its absence by “Ө”. If a condition’s absence or presence is irrelevant to a specific solution, this is denoted by a blank space. The “●” and “Ө” vary in size, indicating whether the condition is core or contributory to a solution.Footnote15
Table 2. Sufficient baseline solution sets (without contextual conditions).
Columns 5–9 present different descriptives of the solution, including solution coverage, raw coverage, unique coverage, and solution consistency. Only cases with high consistency, that is, above .8 (Oana et al., Citation2021; Schneider & Wagemann, Citation2012) are displayed. The final two columns display each solution’s unique and raw number of cases based on solution coverage. Our analysis focused on solutions with more than one unique turnaround case, indicated by the dotted line in each table.
The baseline solution set only explained a moderate number of school turnarounds in the entire sample. With a solution coverage of .33, the explanatory power was relatively weak (Oana et al., Citation2021), as only a third of the turnaround instances could be explained by this solution set. However, two solutions stood out. The first was a combination of the presence of High Academic Expectations and School District Quality Assurance and the absence of Principal’s Focus on Core Operations. Since this solution was perfectly consistent and had relatively high coverage (seven cases), it was considered empirically relevant. An interpretation of this solution is that active support from the school district and a belief in pupils’ ability is sufficient for a turnaround, even without a principal focused on core operations. High academic expectations may indicate a well-functioning culture at the school level, which can be accompanied by active quality assurance from the school district in driving change (cf. Jarl, Blossing, & Andersson, Citation2017). The second solution combined Principal’s Focus on Core Operations and Teacher Collaboration and the absence of High Academic Expectations and School District Quality Assurance. This configuration explained slightly fewer cases (five) but represented an alternative path to turnaround involving only school-level factors. These two solutions suggest a substitution between functional leadership at the school or district level.
Analytical Step 2
A possible confounding factor in our baseline solution set is that we included schools that performed poorly in absolute terms and those that performed poorly based on the SES-adjusted values. This may be problematic if these represent two types of struggling schools – those seen as “problem schools” and those not generally regarded as such. Hence, we introduced the contextual condition Change Pressure to proxy how well the school performs in absolute terms, unadjusted for SES (the truth table for Analytical Step 2 is provided in Online Appendix 6). We approached this in an exploratory manner, with no ex-ante expectations on how it may impact the conditions for school turnaround. It may have asymmetrical effects, which makes it suitable to add to the QCA. The results of this analysis, presented in , yielded several sufficient combinations.
Table 3. Sufficient baseline solution sets with contextual condition.
Adding Change Pressure to the analysis improved the solution coverage substantially, from .33 in to .55 in . In other words, this solution set explained more than half of the turnaround cases. It also added nuance to the QCA model, as there were now three empirically relevant solutions out of seven, compared to two out of four in the baseline solution set. These were similar to the earlier ones, highlighting either Principal’s Focus on Core Operations and Teacher Collaboration or, alternatively, High Academic Expectations and School District Quality Assurance as core conditions.
In the first solution (Row 1 in ), where teachers collaborated to a large extent and the principal focused on the school’s core operations, the condition Change Pressure was also present. An interpretation is that for actors at the school level (teachers/principals) to initiate a turnaround process, the school must be visibly underperforming, not only relative to the SES of pupils. Unsurprisingly, teacher collaboration and a principal focusing on core operations appeared in conjunction, considering the principal’s significant role in facilitating a collaborative environment (García-Martínez et al., Citation2021). We refer to this as a type of bottom-up turnaround as it is initiated and driven at the school level.
In the second solution (Row 2), where the school district engaged in quality assurance and there were high academic expectations of pupils, the Change Pressure condition was irrelevant; its presence or absence made no difference to the outcome. This suggests that where there is no external pressure to change (i.e., no visible underperformance), turnaround may need to be initiated “from above” (i.e., by the school district). Here, heightened academic expectations of pupils combined with a school district that conducts systematic quality assurance was sufficient for school turnaround, even without pressure to change. Our interpretation is that a turnaround requires efforts at the school level, and in the absence of external pressure, such efforts may not be initiated. However, the school district can function as an external agent of change that identifies problems even in those schools that superficially seem unproblematic and thus substitute the pressure for change stemming from visible underperformance. In this solution, there seems to be a gap in the vertical governance chain, as the principal did not focus on core operations. As Adolfsson and Alvunger (Citation2020) have discussed, it might be possible for the school district to bypass the principal, who may be acting as a gatekeeper (shielding the organisation from “external influence” rather than focusing on core operations) and initiate change with the help of, for example, expert teachers. We refer to this as a bypass turnaround.
The third empirically relevant solution (Row 3) was where School District Quality Assurance and Principal’s Focus on Core Operations were present, while Teacher Collaboration, High Academic Expectations, and Change Pressure were absent. Here, both leadership functions were active and possibly synchronised due to additional organisational slack enabled by the lack of external pressure. When the principal’s autonomy is not explicitly threatened, there is less risk of project crowding, and thus, they have less reason to gatekeep the organisation (Adolfsson & Alvunger, Citation2017, Citation2020). We refer to this type of turnaround as a leeway turnaround. Bottom-up, bypass, and leeway turnarounds constituted the three main solutions in the entire sample.
Analytical Step 3
To provide a more contextually nuanced analysis of the conditions for school turnaround, we repeated the analyses on subsamples of urban and non-urban schools in . Considering schools’ context, specifically their geographical setting, has proven critical in previous Scandinavian studies (Jarl, Blossing, & Andersson, Citation2017).
Table 4. Sufficient solutions for the urban/non-urban subsamples.
The solution coverage for the urban schools shown in , Part a, was lower than for the entire sample (.47), which suggests that finding parsimonious turnaround recipes was more difficult in an urban context. The solutions identified in , Part a, had relatively limited coverage; the solution with the broadest coverage included only three cases. This solution was based on the absence of Change Pressure, Principal’s Focus on Core Operations, and High Academic Expectations. In previous models, all empirically relevant solutions with High Academic Expectations included the presence of either Principal’s Focus on Core Operations or School District Quality Assurance as contributory conditions. In an urban context where the school was not a directly visible underperformer (i.e., it only performed poorly in relation to the SES of its students), the turnaround was made possible by simply raising academic expectations. In other words, schools with relatively high SES in urban contexts may be more responsive to increasing academic expectations. The second solution (Row 2) in , Part a, was more similar to the leeway turnaround identified in the entire sample, with strong leadership from both the principal and the school district. We can also see from one of the empirically small solutions (i.e., few cases covered) that a bottom-up approach was possible, though not very common. Below, we speculate on the possible reasons for these differences.
There are several potential explanations as to why several small-coverage solutions appear in the urban subsample. The result may indicate noisy data or more significant variation in the causal pathways for school turnaround in urban settings. Most probably, there are also essential differences between urban and non-urban areas as contexts for schools that seek to turn their performance around. In urban settings, teacher turnover is more common (Borman & Dowling, Citation2008; Guarino et al., Citation2006)Footnote16, social segregation is greater (Böhlmark, Holmlund, & Lindahl, Citation2016), and there is more competition between schools (Edmark et al., Citation2014). The organisational capabilities of school districts may also differ between urban and non-urban settings. We might expect school districts in urban settings to have greater resources, while on the other hand, they are less able to focus on a single school as they cover multiple schools.
The solution coverage for non-urban schools in , Part b, was high (.84), meaning that the model explained more than 80% of the turnaround cases with the five solutions presented as rows in the table. This was markedly higher than the solution coverage for the urban subsample (.47), indicating that schools in small towns and rural communities represent a more predictable context for school turnaround.
For non-urban schools, the absence of Change Pressure seems to constitute a single sufficient condition. This is markedly different from the entire sample (), where the absence of Change Pressure had to be accompanied by strong school and/or district leadership. In contrast to the other conditions for which we have prior evidence in the literature, finding that merely performing relatively well in absolute terms constitutes a condition for school turnaround is interesting but challenging to explain.Footnote17 One possible explanation is that it may be easier for schools with relatively better results as a starting point to improve than for schools that begin their journey at the very bottom. Another explanation may be that the pupils in such schools can draw on a broader range of resources more efficiently, such as receiving help from parents, which may lead to a turnaround without the school changing very much. These are, however, only speculations.
The remaining solutions for non-urban turnarounds in , Part b (Rows 2–4), suggested a similar pattern to the analysis of the entire sample ( and ), with conditions fulfilled at the school or district level. However, the school district’s effect seemed more critical in non-urban schools. One possible explanation is that it is harder to recruit teachers and principals in non-urban contexts (Goldhaber et al., Citation2020) and that the presence of school district quality assessments can make all the difference in supporting and directing struggling schools. Also, in non-urban contexts, the school district often has fewer schools to focus on and could thus tailor efforts to specific schools.
Analytical Step 4
We next turned our attention to the negation of the outcome, that is, the causal conditions that hindered school turnaround (Schneider & Wagemann, Citation2012). Note that the non-turnaround schools in our sample had low levels of pupil performance similar to those of the turnaround schools but did not improve. We treated these as a separate analysis as we could not assume symmetric causality, that is, that the absence of the conditions would mean the absence of school turnaround.
The sufficiency analysis in explained almost half of the non-turnaround cases, that is, somewhat lower than the sufficiency analysis of turnaround schools in . Three solutions explaining non-turnarounds stood out. The first solution (Row 1) in explained about a quarter of all non-turnaround schools, based on the absence of the conditions School District Quality Assurance, Principal’s Focus on Core Operations, and Teacher Collaboration, with the presence of the contextual condition Change Pressure. This solution could be thought of as a leaderless and unsupported school with an individualistic teacher culture that is also visibly failing in terms of pupil outcome. This recipe for failure resonates with Jarl, Blossing, and Andersson (Citation2017), who unsurprisingly found that unsuccessful Swedish schools were characterised by teachers who did not collaborate and school leadership that neglected pupil achievement.
Table 5. Sufficient solutions for the negation of the outcome.
A more surprising finding was that the other two empirically relevant solutions had more conditions present than absent, which was somewhat contradictory to our theoretical expectations. There are, however, some possible explanations for why these schools fail to turn around despite fulfilling some conditions. One is that the absence of Teacher Collaboration (Row 2) is particularly important for explaining non-turnaround schools, as this is a commonality across both the first and second solutions. In other words, a lack of teacher collaboration may indicate that the school’s work environment is so poor that turnaround is unviable, even though leadership resources are in place. In the third solution (Row 3), the school may have “bet on the wrong strategy” by implementing ideas the school district fails to control. For example, one of the schools interviewed had rejected homework entirely, which might have been a disadvantage relative to other schools.
Robustness tests
First, we examined the performance trajectory, which showed that the turnaround schools in our sample continuously improved from the start of the turnaround process to its end, making it impossible for a change in a condition to postdate completion of the turnaround process, that is, minimising the risk of “reversed causality” (see Online Appendix 7). We also performed several robustness tests of the entire sample () to examine the sensitivity of the general conclusions under different assumptions. As the calibration of conditions requires making several decisions, some based on earlier work and others on expert knowledge, and because there may be measurement difficulties, it is standard practice to test alternative assumptions. To test the sensitivity of our choices made when constructing the truth table and running the minimisation algorithm, we altered the (a) consistency thresholds from .8 to .84 and .67 and the frequency cut-offs for including a solution from 1 to 2 or 3 (available in Online Appendix 8); (b) we changed the calibration of conditions (as mentioned earlier, in Online Appendix 1); and (c) we randomly corrupted and deleted cases (Online Appendix 9). We also analysed the robustness of our analysis by changing the thresholds used to define the sample of turnaround schools (Online Appendix 10). We further analysed the effect of dropping state (consistently high value) or change (substantial change to value) as part of the calibration (Online Appendix 11). Overall, our analysis was robust to changes in consistency thresholds, frequency cut-offs, changes in the threshold used to define turnaround schools, and dropping state or change in the calibration of conditions. The analysis was also robust to corruption of cases and changes to the calibration of Change Pressure but more sensitive to corruption and changes to Principal’s Focus on Core Operations and High Academic Expectations. These sensitivities suggested that 15–20 percentage points might overstate solution coverage under certain assumptions, and some of the conditions may correlate to the point that they may be interchangeable in some respects.
In-depth interviews
We complemented the QCA with in-depth interviews with school leaders (principals, deputy principals, and school district leaders). The interviews were carried out in parallel with the QCA analysis to enable a deeper understanding of the causal conditions posited.Footnote18 It was thus not meant as a complete qualitative study aimed at generating new understandings of turnaround processes. To minimise potential “recall bias” (Golden, Citation1992), we organised the interview questions around facts and event sequences (Glick et al., Citation1990). We asked respondents to reflect on the state of the school at the time of the low performance and ongoing events in its subsequent development. In this way, we aimed to obtain descriptions of how interviewees experienced the turnaround process over time. As we asked about consequential events in their career – most turnaround attempts involve considerable work and attention – we were reasonably confident that the respondents would recall the relevant events. Whenever possible, we also relied on archival documents and data from the School Inspectorate to triangulate informants’ descriptions of key events. We could do this best concerning the timing of the turnaround (using data from the School Inspectorate) and the conditions present or absent (using data from the surveys). The most challenging aspect to triangulate was whether there was an explicit turnaround strategy, as we lacked a systematic data source for this information.
We had three motives for conducting these complementary interviews. First, we wanted to test the face validity of our conditions with the main actors involved in school turnaround. Second, we wanted to examine cases more in depth that did not fit neatly into the QCA solutions (more below). Third, we wanted to explore potential unobserved conditions that we might have overlooked or failed to pick up from earlier literature. An interplay between the empirical QCA model and contextual insights gained from interviews allowed us to refine our understanding of causal conditions for school turnarounds in the empirical context studied (Ragin, Citation2008; Schneider & Wagemann, Citation2012).
summarises the schools sampled for interviews along two dimensions: turnaround and non-turnaround schools, with or without conditions present. The logic was that where conditions were present, and the school made a turnaround, the face validity of our conditions could be confirmed. If leaders of turnaround schools with conditions fulfilled speak of their turnaround resulting from them, we regard this as a validation of the conditions. Conversely, where the conditions were absent, and the school did not turn around, we expected school leaders to speak of the lack of these conditions as the reason for non-turnaround. Although QCA does not assume symmetric causality, earlier literature (Jarl, Blossing, & Andersson, Citation2017) suggests that the absence of conditions could still be detrimental to turnaround. However, the anomalies, that is, cases where conditions were present yet there was no turnaround, or conversely, where no conditions were present yet there was a turnaround, are interesting from an exploratory perspective: How could these be explained?
Table 6. Interviewed schools.
Schools A, B, and C, by and large, validated our conditions. Informants at Schools A and B spoke of high academic expectations and teacher collaboration as vital factors for their turnaround. The interviewees also discussed factors such as pupil wellbeing and the school’s financial resources. These may, however, be context-specific challenges of the two schools. In School C, a non-turnaround school lacking all conditions, the principal highlighted the lack of teacher collaboration and rapid principal turnover as reasons for continuous poor performance. Over 8 years, no fewer than six principals had passed through the school. Under such conditions, it is unsurprising that few conditions were fulfilled, and there was no turnaround.
We received more heterogenous answers for the schools in the secondary diagonal (D, E, F, and G). Informants at School D spoke about the substantial effect of the absence of teacher collaboration, even when all other factors were in place (Change Pressure, Principal’s Focus on Core Operations, High Academic Expectations, and School District Quality Assurance were present, and Teacher Collaboration was absent for School D). The principal described the school as being “on a change path”, just as the conditions indicate, but admitted that some teachers’ resistance thwarted the process. This illustrates the critical role of teachers and teacher collaboration in turning around schools, echoed in the negation analysis (Analytical Step 4), where the absence of Teacher Collaboration was identified as a single sufficient condition for non-turnaround.
Regarding Schools E, F, and G, we found case-specific factors that could explain their turnaround. School E’s turnaround may have been due to an external state-funded school development programme and a significant reorganisation. School F may have turned around because of a powerful and charismatic principal despite lacking all other conditions. It is further possible that School G turned around due to a radical shift in school culture. Just like School D, there was initial resistance from parts of the teacher collective. However, many of these teachers resigned within the first 2 years of the turnaround process, which, according to the principal, cleared the way for the turnaround. All these factors highlight the multiple paths to turnaround and specific cases unsuitable for generalisation beyond the individual school. Further details regarding case-specific conditions and summarised interview cases can be found in Online Appendix 12.
Discussion
Motivated by the scattered evidence on strategies and factors facilitating the potential for turning around poorly performing schools in school improvement research, this study set out to identify the necessary and sufficient conditions for school turnaround in Sweden, a country that has seen reports of increasing quality division in school performance (Edmark et al., Citation2014; Holmlund et al., Citation2019). Employing comparative analysis (QCA) and detailed hand-collected data on 42 turnaround schools and 35 non-turnaround schools, we have advanced the understanding of how schools can turn their fortunes around.
First, we found no silver-bullet solution to improve struggling schools. Instead, we identified three more prevalent recipes for turnaround: a bottom-up turnaround, where teachers actively collaborate and the principal has a strong focus on the school’s core operations, and a bypass turnaround, where the school district (the municipality) works actively on quality assurance in combination with teachers’ high academic expectations of pupils. In the third recipe, leeway turnaround, both school district quality assurance and principal leadership were in place, but there was no pressure to change. Without external pressure or immediate threat to their autonomy, schools may be able to work in peace, patiently and persistently maintaining their current efforts without trying to overcome challenges by taking on new development programmes or initiatives. The lack of external pressure may also give principals less reason to gatekeep the organisation.
We also explored and found recipes for persistent non-turnaround. In particular, the absence of teacher collaboration stood out as a prevalent condition that marked consistently underperforming schools. Corroborating and building upon Jarl, Blossing, and Andersson’s (Citation2017) findings, the absence of teacher collaboration was a characteristic not only of underperforming schools but also of consistent underperformers.
While no silver bullet guarantees success, a more important finding is that there may be several pathways to success. Schools need not tick all the boxes suggested by earlier research. Leadership from the principal and the school district is essential, but not necessarily in combination. Another important finding is that although teacher collaboration does not guarantee success, it remains a significant obstacle for school turnaround if left unattended or dysfunctional. A final central finding is that context matters. Schools in non-urban contexts could achieve a turnaround by promoting a collaborative culture among teachers, whereas teacher collaboration appears less central to school turnaround in the urban subsample (Borman & Dowling, Citation2008; Guarino et al., Citation2006). In urban settings, the conditions for turnaround are more complex, indicating that more tailor-made solutions might be required.
Contributions to educational research
Our paper offers contributions to educational research that seeks to study causal relationships. For decades, such research has struggled to account for the complexity of extra- and intra-organisational processes (Hallinger & Heck, Citation1998; van der Steen et al., Citation2013) and the importance of context (Meyers & Smylie, Citation2017). Using QCA to probe the causal conditions underlying school turnaround revealed several different causal pathways for underperforming schools to turn around, acknowledging the context specificity of such causal pathways. This type of analysis offers new avenues for educational research, including but not limited to school turnaround and school improvement research. For example, school improvement research may seek to unearth other contextual differences beyond the urban/rural within the framework developed in the current study, focusing on the overall conditions of school leadership, organisation of teachers, and organisational capacity.
Our findings emphasise the significance of change pressure in driving improvement and align with the existing literature on accountability (Duke & Salmonowicz, Citation2010), affirming that accountability is a fundamental factor in improvement. While we did not study individual teacher accountability but rather the accountability that stems from a school being labelled as a “poor performer”, an interpretation from our findings is that school accountability can come in different forms. Local press coverage and parent engagement may be essential for those identified as absolute underperformers. In contrast, the relatively underperforming schools might require attention from stakeholders with sufficient information to identify their poor performance. This suggests ample opportunities for research on accountability within various school-system contexts.
Research may also seek more granularity in the conditions probed in the current study – for example, whether organisational capacity is improved by utilising educational data (Herman et al., Citation2008), the extent to which the organisation and collaboration of teachers depend on some lower threshold of teacher turnover (Leithwood, Citation2007), or the extent to which school leadership should stress student pupil health and safety and discipline (Astor et al., Citation2010; Sprague et al., Citation2001). Research may also seek to compare and integrate the results from traditional least-square regression models of high-performing schools with results from QCA of the same underlying schools (Fiss et al., Citation2013; Rihoux, Citation2006).
Contributions to educational policy and practice
Showing that multiple paths to a successful turnaround are possible and moderated by context should encourage policymakers to move beyond “one-size-fits-all” improvement programmes. By identifying combinations of conditions (sufficient solutions) that constitute a bare minimum for school turnaround, we provide critical guidance to policymakers and practitioners operating within various constraints to make trade-offs between improvement efforts. At a general level, we provide the insight that some leadership resources (the principal’s focus on core operations or the school district’s quality assurance) must be in place, regardless of context, for most turnaround schools. This highlights that bureaucrats and managers at the school-district level should not disengage from quality assurance by outsourcing all responsibility to individual schools – particularly if the principal lacks the required competence.
Another general finding is that context is key. Conditions for school turnaround in urban schools are multiplex, which means that tailor-made solutions might be necessary for these schools. In some contexts, our results suggest that effective school leadership might not be necessary for a turnaround, specifically in schools with advantaged pupil populations in urban settings. In such cases, raising academic expectations is instrumental and can drive improvement – at a relatively low cost. More broadly, our findings suggest that before embarking on large-scale school improvement initiatives, it may be worthwhile to inventory and categorise the poorly performing schools to better target improvement initiatives.
Finally, certain groups of teachers can constitute an obstacle, as they may hinder full participation in a collaborative culture among teachers across the school. In such cases, school leaders should work with the teacher group to improve the collaborative culture regardless of context. However, establishing such a collaborative culture may be easier in more stable environments, such as rural settings, where teacher turnover rates are lower. In sum, the results of this study provide ways for schools and school-district leaders to make informed choices about potential pathways for school turnaround, given the local context.
Underperforming schools that embark on the type of organisational change required to achieve a turnaround often work in stressful environments characterised by intense pressure from parents, school districts, other stakeholders, and the media. Our study shows that school turnaround can and does happen without the active involvement of the school district. However, envisioning and enacting change and improvement is more challenging without active support from stakeholders outside the immediate school environment. Our study, and many others, have shown that school leadership is imperative for the effective turnaround of schools – but ideally speaking, principals should not be left to manage all on their own. Raising teachers’ professional standards and capacity building (Harris, Citation2011) and encouraging engagement from school stakeholders in the local community may be worthwhile practices for school leaders (Stone-Johnson, Citation2014).
Limitations
Our study also has limitations, several of which offer avenues to explore in future research. Two methodological limitations concern the type of QCA method employed and the qualitative data used. We employed a “crisp-set” QCA where schools were either “in” or “out” of a condition, which had the advantage of being relatively simple to operationalise and interpret results from. There is, however, also the option of using QCA with “fuzzy sets” – where schools are “more or less in” or “more or less out” of a causal condition for school turnaround – in essence, allowing for greater nuance in operationalising the conditions. Even though our sensitivity analysis indicated that – in our setting – a change in calibration would not have yielded substantially different results, fuzzy-set analysis offers a promising opportunity for future research.
Another limitation is our data. As we sampled from all schools in Sweden, we relied on available School Inspectorate data. The School Inspectorate was established in 2008, which makes data collection for earlier periods impossible. Although it was useful for our purposes, it is also easy to imagine using more qualitatively rich data – for instance, from a large-scale interview study – to operationalise the conditions. During the study and the interviews, we also came across suggestions that teacher turnover, (disruptive) pupil behaviour, and the experience and backgrounds of teachers and principals could potentially be critical to school turnaround. However, there were no reliable data sources for this information. Based on the different pathways identified in our study, it may also be interesting to carry out extensive ethnographic fieldwork in schools that fall into the different turnaround categories we identify. For the policy oriented, it may be of interest to study how many of the policy initiatives for turnaround are, in any way, contextually sensitive. It would also be interesting to explore whether a pre-programme classification of schools into potential turnaround categories would be feasible when implementing turnaround efforts.
Another potential limitation of our study pertains to the temporal sequence between our identified conditions and the turnaround process. While we cannot precisely identify when the changes in conditions occur, our research design requires that the changes precede the completion of the turnaround in our longitudinal data set. This underscores the importance of interpreting the most empirically relevant solutions, as any potential bias arising from temporal ordering is unlikely to be systematic. Future research endeavours could address these complexities by leveraging recent developments in QCA to account for temporality more effectively (Caren & Panofsky, Citation2005).
A central tenet of our theory is that context is pivotal in research on school turnaround (Boyne & Meier, Citation2009; Meyers & Smylie, Citation2017; Murphy & Meyers, Citation2007). Hence, all results from the current study are not necessarily generalisable to other school systems. Future studies in different contexts and school systems may need to explore the validity of conditions for turnaround evidenced in the current study and explore additional conditions. Other theoretically salient conditions indicated in the literature include teachers’ and principals’ qualifications (Harbatkin, Citation2023; Henry et al., Citation2020) or staff turnover (Henry et al., Citation2020; Leithwood, Citation2007), which could be explored as potential conditions for school turnaround. However, staff turnover might be challenging to include as a condition, as turnover rates could be theorised as both the cause and effect of a school turnaround process. Finally, our study is based on turnaround processes between 2008 and 2019, with turnaround noted when the school’s performance rose above the median for at least 2 consecutive years. Further research on more long-lasting turnaround processes and research on gradual decline represent important future pathways.
Supplemental Material
Download MS Word (300.5 KB)Disclosure statement
No potential conflict of interest was reported by the authors.
Data availability statement
Raw data are openly available at the Swedish National Agency for Education: https://www.skolverket.se/skolutveckling/statistik and https://www.skolverket.se/skolutveckling/statistik/salsa-statistisk-modell, the Swedish School Inspectorate https://www.skolinspektionen.se/beslut-rapporter-statistik/statistik/, and the Swedish Association of Local Authorities and Regions https://skr.se/skr/tjanster/kommunerochregioner/faktakommunerochregioner/kommungruppsindelning.2051.html
Additional information
Notes on contributors
Stefan Arora-Jonsson
Stefan Arora-Jonsson is a professor of Organisation at the Department of Business Studies at Uppsala University and a visiting professor at the Center for Educational Leadership and Excellence at the Stockholm School of Economics. His research focuses on the organisation of competition, in particular among schools.
Ema Kristina Demir
Ema Kristina Demir, PhD in Education, University of Cambridge, is an affiliated researcher at the Center for Educational Leadership and Excellence at the Stockholm School of Economics. Her research focuses on teacher social capital and professional learning, the organisation of schools, and leadership toward educational equity.
Axel Norgren
Axel Norgren is a PhD student at the Institute for Analytical Sociology at Linköping University and an affiliated researcher at the Center for Educational Leadership and Excellence at the Stockholm School of Economics.
Karl Wennberg
Karl Wennberg is a professor and director of the Center for Educational Leadership and Excellence at the Stockholm School of Economics. His research spans educational leadership, school segregation, and organisation science.
Notes
1 Performance is adjusted by the pupils’ socioeconomic background to examine a broader set of schools than the conventional lowest performing schools often found in the turnaround literature.
2 Municipalities run most Swedish schools, but about 15%–20% are run by private corporations. Our sample contained a mix of both.
3 This includes aspects such as teacher empowerment (Hitt et al., Citation2018; Kim et al., Citation2018; Murphy & Meyers, Citation2009) and teacher accountability (Duke & Salmonowicz, Citation2010).
4 This includes high academic expectations of students (Hitt & Meyers, Citation2018; Papay et al., Citation2022), information sharing networks among teachers (Sun et al., Citation2007), and a shared vision among teachers and leaders (Hitt & Meyers, Citation2018; Leithwood et al., Citation2010).
5 For information about Swedish employment laws, see https://www.government.se/government-policy/labour-law-and-work-environment/198280-employment-protection-act-lag-om-anstallningsskydd/
6 The contextual condition of Change Pressure (absolute performance) can partially be compared to the traditional “lowest performing schools” usually targeted by NCLB and similar US turnaround programmes.
7 Causal complexity refers to the occurrence of conditions in conjunction, equifinality, and causal asymmetry.
8 The “+” sign here does not imply a Boolean OR condition, but is meant to demonstrate the logic of addition in linear algebraic equations such as those used in regression models.
9 We use the gender and immigrant indices as part of a larger SES index, as used by authorities in Sweden for allocating resources to schools. From 2013 onward, the variable reflects the ratio of pupils having immigrated within the last 4 years, replacing two earlier variables on the origin of pupils and parents.
10 We can examine solutions that are closer to the definition of low performance traditionally used in US literature (absolute/unadjusted for SES) as well as relative underperformers (based on SES-adjusted data). This allows us to derive contextualised nuanced solutions applicable to a wider range of schools.
11 In Online Appendix 11, we summarise the results of an additional analysis that removes the state and change dimension to the conditions, examining which operationalisation contributes more or less to the QCA solutions.
12 A sufficient combination of conditions consists of INUS conditions, that is, insufficient conditions for the outcome but a necessary step of a combination that is unnecessary but sufficient for the outcome.
13 Consistency is the percentage of cases in a configuration that leads to the outcome.
14 Coverage is the percentage of cases out of all cases in the configuration.
15 A core condition is an INUS condition that still appears as an INUS condition under different assumptions in the minimisation process dealing with combinations of conditions not empirically observed using all “logical remainders” (not empirically observed combinations of conditions) as per the parsimonious solution or using directional expectations (theory-guided decisions) to determine which logical remainders should be included in the intermediate solution.
16 Excessive teacher turnover has been shown to suppress the positive effect of school turnaround efforts (Henry et al., Citation2020).
17 Running the analysis without Change Pressure, we get a similar solutions coverage at .8, but with School District Quality Assurance as the core condition, covering at least 50% of solutions explaining turnaround. Out of the seven cases with an absence of Change Pressure, six also have School District Quality Assurance present. As the solution coverage is weaker and only one case differs between the solutions where Change Pressure and School District Quality Assurance are absent, the solution with only the absence of Change Pressure may be irrelevant; it could be that an absence of Change Pressure must be coupled with School District Quality Assurance.
18 Written informed consent was obtained from all participants prior to the interviews, and all recordings and transcripts of interviews were anonymised. Swedish regulations only require formal ethics approval for research involving sensitive information about the participants or information about legal violations. As no such information was collected, ethics approval was not required.
References
- Abdulkadiroğlu, A., Pathak, P. A., Schellenberg, J., & Walters, C. R. (2020). Do parents value school effectiveness? American Economic Review, 110(5), 1502–1539. https://doi.org/10.1257/aer.20172040
- Adolfsson, C.-H., & Alvunger, D. (2017). The nested systems of local school development: Understanding improved interaction and capacities in the different sub-systems of schools. Improving Schools, 20(3), 195–208. https://doi.org/10.1177/1365480217710874
- Adolfsson, C.-H., & Alvunger, D. (2020). Power dynamics and policy actions in the changing landscape of local school governance. Nordic Journal of Studies in Educational Policy, 6(2), 128–142. https://doi.org/10.1080/20020317.2020.1745621
- Ahlström, B., & Aas, M. (2024). Leadership in low-and underperforming schools – Two contrasting Scandinavian cases. International Journal of Leadership in Education, 27(1), 157–178. https://doi.org/10.1080/13603124.2020.1849810
- Astor, R. A., Guerra, N., & Van Acker, R. (2010). How can we improve school safety research? Educational Researcher, 39(1), 69–78. https://doi.org/10.3102/0013189X09357619
- Bingham, A. J., Dean, S., & Castillo, J. (2019). Qualitative comparative analysis in educational policy research: Procedures, processes, and possibilities. Methodological Innovations, 12(2). https://doi.org/10.1177/2059799119840982
- Böhlmark, A., Grönqvist, E., & Vlachos, J. (2016). The headmaster ritual: The importance of management for school outcomes. The Scandinavian Journal of Economics, 118(4), 912–940. https://doi.org/10.1111/sjoe.12149
- Böhlmark, A., Holmlund, H., & Lindahl, M. (2016). Parental choice, neighbourhood segregation or cream skimming? An analysis of school segregation after a generalized choice reform. Journal of Population Economics, 29(4), 1155–1190. https://doi.org/10.1007/s00148-016-0595-y
- Borman, G. D., & Dowling, N. M. (2008). Teacher attrition and retention: A meta-analytic and narrative review of the research. Review of Educational Research, 78(3), 367–409. https://doi.org/10.3102/0034654308321455
- Boyne, G. A., & Meier, K. J. (2009). Environmental change, human resources and organizational turnaround. Journal of Management Studies, 46(5), 835–863. https://doi.org/10.1111/j.1467-6486.2008.00813.x
- Capano, G., & Pritoni, A. (2020). Exploring the determinants of higher education performance in Western Europe: A qualitative comparative analysis. Regulation & Governance, 14(4), 764–786. https://doi.org/10.1111/rego.12244
- Caren, N., & Panofsky, A. (2005). TQCA: A technique for adding temporality to qualitative comparative analysis. Sociological Methods & Research, 34(2), 147–172. https://doi.org/10.1177/0049124105277197
- Cilesiz, S., & Greckhamer, T. (2020). Qualitative comparative analysis in education research: Its current status and future potential. Review of Research in Education, 44(1), 332–369. https://doi.org/10.3102/0091732X20907347
- Cyert, R. M., & March, J. G. (1963). A behavioral theory of the firm. Prentice Hall/Pearson Education.
- de la Torre, M., Allensworth, E., Jagesic, S., Sebastian, J., Salmonowicz, M., Meyers, C., & Gerdeman, R. D. (2013). Turning around low-performing schools in Chicago. The University of Chicago Consortium on Chicago School Research.
- Duke, D., & Salmonowicz, M. (2010). Key decisions of a first-year ‘turnaround’ principal. Educational Management Administration & Leadership, 38(1), 33–58. https://doi.org/10.1177/1741143209345450
- Edmark, K. (2019). Location choices of Swedish independent schools. The Annals of Regional Science, 63(1), 219–239. https://doi.org/10.1007/s00168-019-00933-y
- Edmark, K., Frölich, M., & Wondratschek, V. (2014). Sweden’s school choice reform and equality of opportunity. Labour Economics, 30, 129–142. https://doi.org/10.1016/j.labeco.2014.04.008
- Fiss, P. C., Sharapov, D., & Cronqvist, L. (2013). Opposites attract? Opportunities and challenges for integrating large-N QCA and econometric analysis. Political Research Quarterly, 66(1), 191–198.
- Forfang, H., & Paulsen, J. M. (2024). Linking school leaders’ core practices to organizational school climate and student achievements in Norwegian high-performing and low-performing rural schools. Educational Management Administration & Leadership, 52(1), 99–115. https://doi.org/10.1177/17411432211064424
- Fullan, M. (2007). Change theory as a force for school improvement. In J. M. Burger, C. F. Webber, & P. Klinck (Eds.), Studies in educational leadership: Vol. 6. Intelligent leadership: Constructs for thinking education leaders (pp. 27–39). Springer. https://doi.org/10.1007/978-1-4020-6022-9_3
- Furnari, S., Crilly, D., Misangyi, V. F., Greckhamer, T., Fiss, P. C., & Aguilera, R. V. (2021). Capturing causal complexity: Heuristics for configurational theorizing. Academy of Management Review, 46(4), 778–799. https://doi.org/10.5465/amr.2019.0298
- García-Martínez, I., Montenegro-Rueda, M., Molina-Fernandez, E., & Fernández-Batanero, J. M. (2021). Mapping teacher collaboration for school success. School Effectiveness and School Improvement, 32(4), 631–649. https://doi.org/10.1080/09243453.2021.1925700
- Glaesser, J., & Cooper, B. (2012). Educational achievement in selective and comprehensive local education authorities: A configurational analysis. British Journal of Sociology of Education, 33(2), 223–244. https://doi.org/10.1080/01425692.2011.649833
- Glick, W. H., Huber, G. P., Miller, C. C., Doty, D. H., & Sutcliffe, K. M. (1990). Studying changes in organizational design and effectiveness: Retrospective event histories and periodic assessments. Organization Science, 1(3), 293–312. https://doi.org/10.1287/orsc.1.3.293
- Goddard, R., Goddard, Y., Kim, E. S., & Miller, R. (2015). A theoretical and empirical analysis of the roles of instructional leadership, teacher collaboration, and collective efficacy beliefs in support of student learning. American Journal of Education, 121(4), 501–530. https://doi.org/10.1086/681925
- Golden, B. R. (1992). The past is the past – Or is it? The use of retrospective accounts as indicators of past strategy. Academy of Management Journal, 35(4), 848–860. https://doi.org/10.2307/256318
- Goldhaber, D., Strunk, K. O., Brown, N., Naito, N., & Wolff, M. (2020). Teacher staffing challenges in California: Examining the uniqueness of rural school districts. AERA Open, 6(3). https://doi.org/10.1177/2332858420951833
- Gresov, C., & Drazin, R. (1997). Equifinality: Functional equivalence in organization design. Academy of Management Review, 22(2), 403–428. https://doi.org/10.5465/amr.1997.9707154064
- Greve, H. R. (1998). Performance, aspirations, and risky organizational change. Administrative Science Quarterly, 43(1), 58–86. https://doi.org/10.2307/2393591
- Guarino, C. M., Santibañez, L., & Daley, G. A. (2006). Teacher recruitment and retention: A review of the recent empirical literature. Review of Educational Research, 76(2), 173–208. https://doi.org/10.3102/00346543076002173
- Hallinger, P., & Heck, R. H. (1998). Exploring the principal’s contribution to school effectiveness: 1980-1995. School Effectiveness and School Improvement, 9(2), 157–191. https://doi.org/10.1080/0924345980090203
- Hallinger, P., & Kantamara, P. (2001). Exploring the cultural context of school improvement in Thailand. School Effectiveness and School Improvement, 12(4), 385–408. https://doi.org/10.1076/sesi.12.4.385.3446
- Hallinger, P., & Liu, S. (2016). Leadership and teacher learning in urban and rural schools in China: Meeting the dual challenges of equity and effectiveness. International Journal of Educational Development, 51, 163–173. https://doi.org/10.1016/j.ijedudev.2016.10.001
- Hansen, M. (2012). Key issues in empirically identifying chronically low-performing and turnaround schools. Journal of Education for Students Placed at Risk (JESPAR), 17(1–2), 55–69. https://doi.org/10.1080/10824669.2012.637165
- Harbatkin, E. (2023). Staffing for school turnaround in rural settings. Leadership and Policy in Schools, 22(4), 1013–1035. https://doi.org/10.1080/15700763.2022.2058963
- Hargreaves, L., Kvalsund, R., & Galton, M. (2009). Reviews of research on rural schools and their communities in British and Nordic countries: Analytical perspectives and cultural meaning. International Journal of Educational Research, 48(2), 80–88. https://doi.org/10.1016/j.ijer.2009.02.001
- Harris, A. (2011). System improvement through collective capacity building. Journal of Educational Administration, 49(6), 624–636. https://doi.org/10.1108/09578231111174785
- Heissel, J. A., & Ladd, H. F. (2018). School turnaround in North Carolina: A regression discontinuity analysis. Economics of Education Review, 62, 302–320. https://doi.org/10.1016/j.econedurev.2017.08.001
- Henrekson, M., & Wennström, J. (2022). Dumbing down: The crisis of quality and equity in a once-great school system – And how to reverse the trend. Palgrave Macmillan.
- Henry, G. T., Pham, L. D., Kho, A., & Zimmer, R. (2020). Peeking into the black box of school turnaround: A formal test of mediators and suppressors. Educational Evaluation and Policy Analysis, 42(2), 232–256. https://doi.org/10.3102/0162373720908600
- Herman, R. (2012). Scaling school turnaround. Journal of Education for Students Placed at Risk (JESPAR), 17(1–2), 25–33. https://doi.org/10.1080/10824669.2012.637166
- Herman, R., Dawson, P., Dee, T., Greene, J., Maynard, R., Redding, S., & Darwin, M. (2008). Turning around chronically low-performing schools: IES practice guide (NCEE 2008-4020). National Center for Education Evaluation and Regional Assistance, Institute of Education Sciences, U.S. Department of Education.
- Hill, K. L., Desimone, L., Wolford, T., Reitano, A., & Porter, A. (2023). Inside school turnaround: What drives success? Journal of Educational Change, 24(3), 393–423. https://doi.org/10.1007/s10833-022-09450-w
- Hitt, D. H., & Meyers, C. V. (2018). Beyond turnaround: A synthesis of relevant frameworks for leaders of sustained improvement in previously low-performing schools. School Leadership & Management, 38(1), 4–31. https://doi.org/10.1080/13632434.2017.1374943
- Hitt, D. H., Woodruff, D., Meyers, C. V., & Zhu, G. (2018). Principal competencies that make a difference: Identifying a model for leaders of school turnaround. Journal of School Leadership, 28(1), 56–81. https://doi.org/10.1177/105268461802800103
- Holmlund, H., Sjögren, A., & Öckert, B. (2019). Jämlikhet i möjligheter och utfall i den svenska skolan [Equality of opportunity and outcomes in the Swedish school system] (Bilaga 7. SOU 2019: 40). Statens Offentliga Utredningar.
- Höög, J., Johansson, O., & Olofsson, A. (2005). Successful principalship: The Swedish case. Journal of Educational Administration, 43(6), 595–606. https://doi.org/10.1108/09578230510625692
- Hopkins, D. (2001). School improvement for real. Routledge.
- Jarl, M., Andersson, K., & Blossing, U. (2017). Success or failure? Presenting a case selection strategy for studies of school improvement. Education Inquiry, 8(1), 17–32. https://doi.org/10.1080/20004508.2016.1275177
- Jarl, M., Andersson, K., & Blossing, U. (2021). Organizational characteristics of successful and failing schools: A theoretical framework for explaining variation in student achievement. School Effectiveness and School Improvement, 32(3), 448–464. https://doi.org/10.1080/09243453.2021.1903941
- Jarl, M., Blossing, U., & Andersson, K. (2017). Att organisera för skolframgång: Strategier för en likvärdig skola [Organizing for school success: Strategies for an equitable school]. Natur & Kultur.
- Jas, P., & Skelcher, C. (2005). Performance decline and turnaround in public organizations: A theoretical and empirical analysis. British Journal of Management, 16(3), 195–210. https://doi.org/10.1111/j.1467-8551.2005.00458.x
- Kim, J., Hargrave, E., & Brooks-Uy, V. (2018). The secret to sustainable school transformation: Slow and steady wins the race. Partnership for Los Angeles Schools; Public Impact. https://partnershipla.org/wp-content/uploads/2018/07/The_Secret_to_Sustainable_School_Transformation_Full_Report.pdf
- Larsson Taghizadeh, J. (2016). Power from below? The impact of protests and lobbying on school closures in Sweden [Doctoral dissertation, Uppsala Universitet]. Acta Universitatis Upsaliensis.
- Leat, D., Lofthouse, R., & Taverner, S. (2006). The road taken: Professional pathways in innovative curriculum development. Teachers and Teaching: Theory and Practice, 12(6), 657–674. https://doi.org/10.1080/13540600601029686
- Leithwood, K. (2007). The emotional side of school improvement: A leadership perspective. In T. Townsend (Ed.), International handbook of school effectiveness and improvement (pp. 615–634). Springer.
- Leithwood, K., Harris, A., & Strauss, T. (2010). Leading school turnaround: How successful leaders transform low-performing schools. Jossey-Bass.
- Liljenberg, M. (2022). Drivers of improvement at local level – Tension and support from coexisting logics. Scandinavian Journal of Educational Research, 66(2), 225–237. https://doi.org/10.1080/00313831.2020.1788157
- Liu, P. (2017). Transforming turnaround schools in China: A review. School Effectiveness and School Improvement, 28(1), 74-101. https://doi.org/10.1080/09243453.2016.1239641
- Meyers, C. (2012). The centralizing role of terminology: A consideration of achievement gap, NCLB, and School Turnaround. Peabody Journal of Education, 87(4), 468–484. https://doi.org/10.1080/0161956X.2012.705149
- Meyers, C. V., & Smylie, M. A. (2017). Five myths of school turnaround policy and practice. Leadership and Policy in Schools, 16(3), 502–523. https://doi.org/10.1080/15700763.2016.1270333
- Murphy, J., & Meyers, C. V. (2007). Turning around failing schools: Leadership lessons from the organizational sciences. Corwin Press.
- Murphy, J., & Meyers, C. V. (2009). Rebuilding organizational capacity in turnaround schools: Insights from the corporate, government, and non-profit sectors. Educational Management Administration & Leadership, 37(1), 9–27. https://doi.org/10.1177/1741143208098162
- Oana, I.-E., Schneider, C. Q., & Thomann, E. (2021). Qualitative comparative analysis using R: A beginner’s guide. Cambridge University Press.
- Organisation for Economic Co-operation and Development. (2012). PISA 2012 results. https://www.oecd.org/pisa/keyfindings/pisa-2012-results.htm
- Organisation for Economic Co-operation and Development. (2018). PISA 2015 results in focus. https://www.oecd.org/pisa/pisa-2015-results-in-focus.pdf
- Papay, J. P., Kraft, M. A., & James, J. K. (2022). Operator versus partner: A case study of blueprint school network’s model for school turnaround. Journal of Research on Educational Effectiveness, 15(2), 367–393. https://doi.org/10.1080/19345747.2021.1998737
- Peck, C., & Reitzug, U. C. (2014). School turnaround fever: The paradoxes of a historical practice promoted as a new reform. Urban Education, 49(1), 8–38. https://doi.org/10.1177/0042085912472511
- Player, D., & Katz, V. (2016). Assessing school turnaround: Evidence from Ohio. The Elementary School Journal, 116(4), 675–698. https://doi.org/10.1086/686467
- Quenzel, G., & Hurrelmann, K. (2013). The growing gender gap in education. International Journal of Adolescence and Youth, 18(2), 69–84. https://doi.org/10.1080/02673843.2012.665168
- Ragin, C. C. (2000). Fuzzy-set social science. University of Chicago Press.
- Ragin, C. C. (2008). Redesigning social inquiry: Fuzzy sets and beyond. University of Chicago Press.
- Ragin, C. C. (2014). The comparative method: Moving beyond qualitative and quantitative strategies. University of California Press.
- Ragin, C. C., & Fiss, P. C. (2008). Net effects analysis versus configurational analysis: An empirical demonstration. In. C. C. Ragin, Redesigning social inquiry: Fuzzy sets and beyond (pp. 190–212). University of Chicago Press.
- Rihoux, B. (2006). Qualitative comparative analysis (QCA) and related systematic comparative methods: Recent advances and remaining challenges for social science research. International Sociology, 21(5), 679–706. https://doi.org/10.1177/0268580906067836
- Schaffer, E., Reynolds, D., & Stringfield, S. (2012). Sustaining turnaround at the school and district levels: The high reliability schools project at Sandfields Secondary School. Journal of Education for Students Placed at Risk (JESPAR), 17(1–2), 108–127. https://doi.org/10.1080/10824669.2012.637188
- Schneider, C. Q., & Wagemann, C. (2012). Set-theoretic methods for the social sciences: A guide to qualitative comparative analysis. Cambridge University Press. https://doi.org/10.1017/cbo9781139004244
- Sebastian, J., Allensworth, E., & Stevens, D. (2014). The influence of school leadership on classroom participation: Examining configurations of organizational supports. Teachers College Record, 116(8), 1–36. https://doi.org/10.1177/016146811411600806
- Skedsmo, G., & Huber, S. (2022). The German context: School turnaround in ten schools in difficult circumstances: The need for adaptive and contextualized approaches to development and change. In R. M. Ylimaki & L. A. Brunderman (Eds.), Studies in educational leadership: Vol. 24. Evidence-based school development in changing demographic contexts (pp. 159–176). Springer. https://doi.org/10.1007/978-3-030-76837-9_11
- Skolinspektionen. (2020a). Statistik från regelbunden tillsyn [Statistics from regular inspection visits]. https://www.skolinspektionen.se/beslut-rapporter-statistik/statistik/statistik-om-tillsyn/planerad-tillsyn/regelbunden-tillsyn-2008–2022/regelbunden-tillsyn-2020/
- Skolinspektionen. (2020b). Statistik från Skolenkäten [Statistics from the school survey]. https://www.skolinspektionen.se/beslut-rapporter-statistik/statistik/statistik-fran-skolenkaten/
- Skolinspektionen. (2021). Långvarigt låga kunskapsresultat [Long-term low pupil achievement]. https://skolinspektionen.se/globalassets/02-beslut-rapporter-stat/granskningsrapporter/tkg/2021/langvarigt-laga-kunskapsresultat/kvalitetsgranskningsrapport-langvarigt-laga-kunskapsresultat.pdf
- Skolverket. (n.d.-a). SALSA – En statistik modell [SALSA – A statistical model]. https://www.skolverket.se/skolutveckling/statistik/salsa-statistisk-modell
- Skolverket. (n.d.-b). Statistik [Statistics]. Retrieved August 1, 2022, from https://www.skolverket.se/skolutveckling/statistik/sok-statistik-om-forskola-skola-och-vuxenutbildning?sok=SokA
- Sprague, J., Walker, H., Golly, A., White, K., Myers, D. R., & Shannon, T. (2001). Translating research into effective practice: The effects of a universal staff and student intervention on indicators of discipline and school safety. Education and Treatment of Children, 24(4), 495–511.
- Stone-Johnson, C. (2014). Responsible leadership. Educational Administration Quarterly, 50(4), 645–674. https://doi.org/10.1177/0013161X13510004
- Sun, H., Creemers, B. P. M., & de Jong, R. (2007). Contextual factors and effective school improvement. School Effectiveness and School Improvement, 18(1), 93–122. https://doi.org/10.1080/09243450601058287
- Sveriges Kommuner och Regioner. (2021). Kommungruppsindelning [Municipal grouping]. Retrieved March 1, 2022, from https://skr.se/skr/tjanster/kommunerochregioner/faktakommunerochregioner/kommungruppsindelning.2051.html
- Tao, Y. (2022). School turnaround through network governance: The role of turnaround schools in China’s Shanghai City. School Effectiveness and School Improvement, 33(1), 86–103. https://doi.org/10.1080/09243453.2021.1942929
- The Local Sweden. (2016, September 13). Here are the best and worst schools in Sweden. https://www.thelocal.se/20160913/here-are-the-best-and-worst-schools-in-sweden/
- Thomann, E. (2020). Qualitative Comparative Analysis for comparative policy analysis. In B. G. Peters & G. Fontaine (Eds.), Handbook of research methods and applications in comparative policy analysis (pp. 254–276). Edward Elgar Publishing.
- van der Steen, M., van Twist, M., Fenger, M., & Cointre, S. L. (2013). Complex causality in improving underperforming schools: A complex adaptive systems approach. Policy & Politics, 41(4), 551–567. https://doi.org/10.1332/030557312X655800
- Yu, Z., & Jiang, X. (2022). How school climate affects student performance: A fuzzy set qualitative comparative analysis based on the perspective of education system. Mathematical Problems in Engineering, 2022, Article 7975433. https://doi.org/10.1155/2022/7975433