
ABSTRACT
Purpose
To compare an analog visual scale in grading anterior chamber cells (ACC) to a modified Standardization of Uveitis Nomenclature (SUN) ACC scale.
Method
A graphical representation of anterior chamber cells as a reference and a test set was created and shown to two groups of experienced uveitis experts. Group 1 was given the analog scale in written format, while group two was given the reference images for comparison. Each test subject was asked to provide the best approximation for each grade.
Results
Eleven graders participated in phase 1. Correct grading occurred in 87.4% of cases. Discrepancies were seen at all grades. Only 3 of 11 graders were able to achieve a perfect score. Seven graders participated in phase 2. Agreement was 95.2% with 4/7 graders achieving a perfect score. Discrepancies were seen at higher grades only.
Conclusions
ACC grading is improved by a visual grading scale, and interobserver variability is reduced.
Assessing and monitoring inflammation is critical when managing patients with uveitis. Upon reaching certain thresholds of activity, therapies are either introduced, modified, or substituted based on their perceived efficacy. In addition to the importance of this information in patient care, degree of activity and its change often serve as primary or secondary outcome measures in clinical trials. For both purposes, quantitative measurements are preferred. In the anterior segment, the quantification of cells and flare was first proposed in 1959 by Hogan, Kimura and Thygeson.Citation1 Their methodology consisting in observing the anterior segment through a slit lamp with high magnification, a small beam of light, and high illumination, is still today the basis for the quantification of anterior segment inflammation. Over the years, minor modifications, mainly related to the cell count per high-power field and the number of ordinal steps were proposed by various authors.Citation2,Citation3 In 2005, the Standardization of Uveitis Nomenclature Working Group agreed upon and published standards on the grading of inflammation (), and these have been used since, with or without further modifications, in reporting clinical studies and in assessing response in pivotal trials.Citation4
Table 1. The SUN Working Group Grading Scheme.
However, this method relies on the subjective evaluation of the number of cells by a trained observer and is thus susceptible to interobserver variations.Citation5 Although the interobserver agreement within 1 clinical grade is high (kappa range, 0.81–1.00), the agreement within the same grade is low (range, 0.34–0.43). Adding to the conundrum, the wide range of cells per high-power field in grade 3 and grade 4 limit the ability to accurately determine the exact grade and any change within.Citation6
Because the number of cells is a critical component of disease diagnosis and treatment, more objective and precise methods to quantify the number of cells has been suggested, with optical coherence tomography (OCT) often named as a potential solution.Citation7 Lowder et al. first proposed using OCT for this purpose in 2004, but others have proposed similar concepts.Citation6,Citation8,Citation9 However, concern over particles sized less than the axial resolution of the OCT that would be missed may prevent its uniform implementation.Citation8,Citation10 In our cumulative experience, OCT use for this purpose is limited and most devices do not have the necessary resolutions needed to enable a precise cell count. Beyond clinical treatment, this inability to consistently assess the level of anterior chamber cells between different graders poses difficulties in clinical studies where the need to ensure consensus among investigators/graders is of paramount importance. The inability of experienced graders to reach high reproducibility on ACC grade severity also may result in inconclusive data on clinical trials evaluating drug efficacy.
Pattern recognition concepts can help to overcome these obstacles. Human brains use pattern recognition/detection as a way to make learning easier, particularly in deterministic contexts.Citation11 This concept has been applied to visual grading scales, and is commonly employed in medical imaging,Citation12–14 as well as several other areas of medicine.Citation15–19 Grading scales have also been used in ophthalmology, from the grading of cataracts,Citation20,Citation21 diabetic retinopathy,Citation22 and glaucoma.Citation23 These scales rely on grading of recorded images. However, despite the ability to visualize cells in the anterior chamber with a slit-lamp, there is no available technology which enables high-quality photography of the anterior chamber. An alternative would be to provide a clinician with a reference set of images and to grade anterior chamber cells based on a best approximation of a patient’s anterior chamber to a standardized set of images. Such an approach has been used in clinical studies of cataracts.Citation24
The purpose of this study was to develop a set of images based on SUN scale for ACC and to determine if it can provide a better inter-grader consensus than simple observation. To address criticism of the existing SUN scale, steps were set to follow a linear increase in cell numbers and focused on the steps between 0 to the lower 3+, most commonly observed in clinical studies.
Materials and methods
Definition of a modified scale and generation of digital images
The SUN scale was modified to provide a linear increase in the maximum number of cells per step up to a maximum of 30 cells. At each step beyond step 1, the maximum number of cells were increased 3-fold per level. For level one, we used the maximum cell count corresponding to 0.5 in the SUN scale. Any number of cells above 30 was set as a level 4 + .
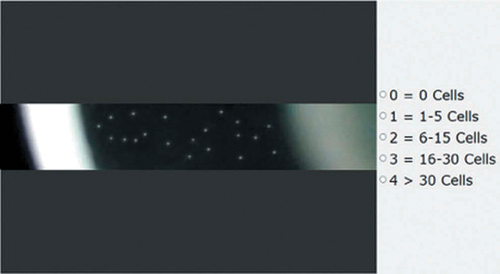
Next a set of representative images were created showing the maximum number of cells per level. A graphical representation of a high-power field slit beam through the anterior chamber was created using Photoshop (Adobe, San Jose, CA, USA) which mimicked the slit beam appearance through the cornea, anterior chamber and lens surface to simulate the clinical assessment of ACC (). Cells were represented as white dots and dimensioned to represent lymphocytes. These were distributed throughout the anterior chamber at the upper limit of each grade in an inhomogeneous fashion. Flare was omitted in these representations. A set of test images were generated to represent cell counts intermediate within each grade level.
Figure 1. A representative screenshot of phase 1: The left side shows a single image to be graded, and the right side shows the grading scale (equivalent to the 1mm3 high power field in the SUN criteria). The grader is instructed to choose the grade that best represents the number of cells on the left image. Once a grade from the right side is chosen, the image is replaced automatically and the process repeated until the last image is graded.
Test subject selection and testing procedure:
During an international congress on uveitis held in Taiwan, senior uveitis experts with 15 or more years of experience were asked to evaluate the test images according the protocol described below. The images were shown on a laptop computer in a quiet area of the congress hall away from the main crowd under moderate lighting conditions.
In the first phase, the experts were asked to grade standalone images according to the scale in . Each grader was supplied with a set of images and the modified numeric SUN grading scheme with which to base his/her classification []. Within each set, each image was shown twice, with the sequence of presentation randomly assigned automatically and the process repeated.
Table 2. Tarsier-Grading Image Scale (TGIS).
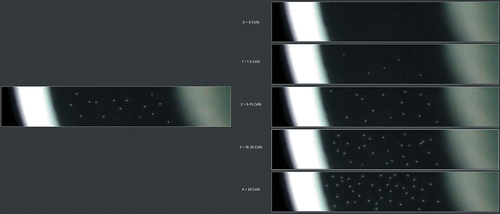
In the second phase, a separate group of experts graded the same images used in the first phase, but were this time given an electronic set of images representing the Tarsier’s grading image scale (TGIS), positioned to the right of the test image []. In this phase, the first two images were used for training purposes after each test subject received a brief explanation on the score mechanics. To facilitate the administration of the test, and minimize bias in both study phases, an intuitive graphical user interface was created in Python. In the second phase, test subjects were placed in front of the computer, given minimal instructions on the scoring principles and how to enter their assessment. They were given no further instructions. Test subjects were not aware of the transition from the training to scoring phase.
Figure 2. Screenshot from the second phase analysis: On the left side is a single image to be graded, and the right side shows the TGIS provided to the grader. The grader is instructed to click on one of the five images on the right side of the screen that best represents the number of cells on the left image. Once an image from the right side is chosen, the image is replaced.
Statistical methods
Statistical analyses were performed using SAS v9.4 (SAS®, SAS Institute Cary, NC USA) software. As a measure of accuracy, the mean bias between ACC grade given by the clinician and the actual grade, and its standard deviation (with 95% confidence intervals) are estimated from random effects analysis of variance models programmed in SAS using the MIXED procedure, since multiple measurements are taken from the same slide and the model takes into consideration the intra-image correlation.
The precision of a measurement expresses the closeness of agreement (degree of scatter) between a series of measurements obtained from multiple sampling of the same homogeneous sample under the prescribed conditions. Precision may be considered at two levels: repeatability and reproducibility. Repeatability expresses the precision under the same operating conditions over a short interval of time. Reproducibility expresses the precision between different operating conditions.
The above-mentioned statistics and their 95% two-sided confidence intervals (CI) were calculated using a random effects analysis of variance models programmed in SAS statistical software V9.4 (SAS Institute, Cary NC, USA) using the PROC MIXED procedure. The CI of the reproducibility was calculated with bootstrap methodology using 10,000 simulated samples.
The intra-class correlation coefficient (ICC) was used as an index of inter and intra-grader reliability. ICC coefficients are interpreted in a similar manner to correlation coefficients: an ICC > 0.80 - excellent; 0.60 ≤ ICC ≤ 0.80 - good; 0.40≤ ICC≤ 0.60 – moderate; < 0.40 - poor. The ICCs were calculated from each of the models’ variance components as the ratio of the between-grater error variance and the total variance. For estimation of intra-observer reliability, similar models were used but data was entered into the models per grater, enabling measurement of the ICC for repeated measurements (i.e., read/re-read reliability). The average intra-observer reliability was calculated from each rater’s individual reliability.
Results
Phase 1: image grading against the TGIS grading scale
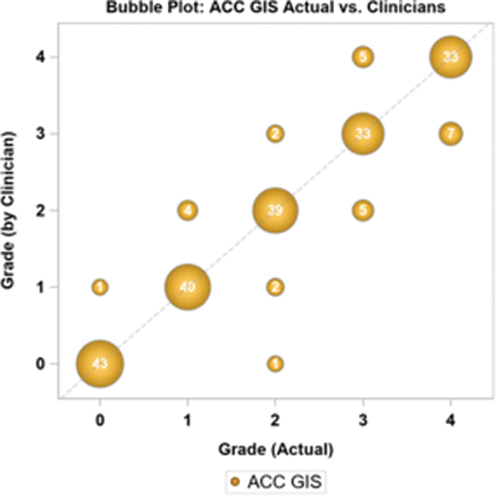
Eleven graders participated in the first phase of the study, grading 10 different images, each presented randomly twice with 2 images per level. The initial image with three test subjects, and the first two images with one test subject had to be discarded because they did not understand how to properly enter their score, and inadvertently pressed the wrong score. In the results are presented the results for all clinicians, where the number within the bubble and the size of the bubble represents the number of times a given value was scored. The exact scores for each participant are found in supplemental . In 188/215 cases (87.4%), the ACC grade recorded by the clinician is equivalent to the true grade of the image, with more discrepancies observed at higher cell numbers. Only 3 of 11 graders could achieve a perfect score. The mean bias between the clinician scores and the actual image was −0.020 (95% CI: −0.126, 0.086) grade units. Repeatability and reproducibility are shown in .
Table 3. Repeatability and reproducibility of clinician scores using the TGIS grading scale.
Figure 3. Bubble plot of actual ACC GIS score versus the clinician scores using the grading scale.
Phase 2: image grading against a standardized set of TGIS images
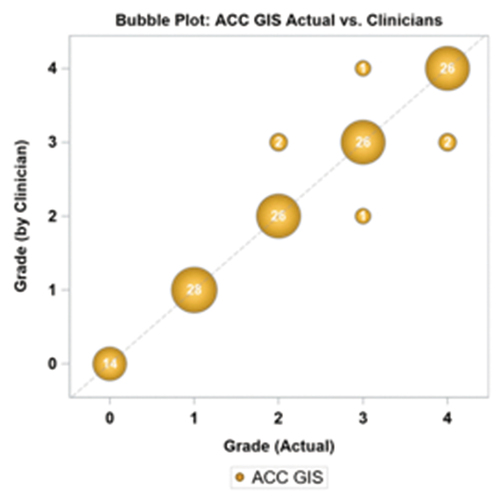
In the second phase, 7 clinicians completed the test sequence. Each clinician was shown a sample image per ACC TGIS grade and was asked to assign an ACC grade to the tested images according to the closest similarity with the sample slides. As in the first phase 10 images were used and presented twice in a random sequence, except for the grade 0 where the 2 images were only presented once. All test subjects successfully entered an answer for each image. The level of agreement was 95.2% (120/126), higher than in phase 1 of the study (87.4%). presents the bubble plot of clinician grades versus the actual image. In supplemental are presented the individual test results for all participants. Discrepancies were again noted mainly with higher cell counts, and only 3/7 clinicians did not get a perfect score. Two test subjects made several errors in assessment, present in more than one grade. The mean bias was 0, and repeatability and reproducibility in grade units were 0.214 (CV% = 9.64%) and 0.163 (CV% = 7.4%). shows improved repeatability and reproducibility relative to phase I.
Table 4. Repeatability and reproducibility of clinician scores using the TGIS grading images.
Figure 4. Bubble plot of actual ACC TGIS score versus the clinician scores using the standardized image set.
Discussion
It is well accepted that visual grading scales and automated methods are superior to observation alone, yet in the case of anterior chamber cells, the methodology used in clinical practice and randomized clinical trials has been simple observation.Citation8,Citation24 The current study adds to this assertion. Using the current observational SUN criteria, uveitis experts achieve an interobserver agreement of ±1 clinical grade (kappa range, 0.81–1.00), while the agreement within the same grade is low (range, 0.34–0.43).Citation5 This limits its applicability in clinical studies and imposes a “higher” bar to demonstrate clinical efficacy of anti-inflammatory medications for the anterior segment. An additional limitation, is the challenge of grading inflammation at grade 3 and above, where a clinician is expected to count 30+ moving cells present within the examination window. In practice, physicians rely on their training and experience to “ball park” the number of cells and decide on a grade. Indeed, grades 3 and 4 of the SUN classification were found to be subject to significant bias among graders.Citation5
The TGIS attempts to address both issues by providing a set of reference images which allow a clinician to compare cell density within the examination window rather than having to count cells. The scale is also limited to a lesser number of cells in the higher grades, while the scale provided a more linear increase at each grade level beyond grade 1. Specific instructions (appendix A) are also provided to help in achieving uniformity in the measurement when used clinically. This study found that grading without reference images lead to inconsistencies in grading starting at grade 1, but were largely limited to ± 1 grade as previously shown.Citation5 More inconsistencies were seen at higher grades, despite the fact that test subjects could take as much time as they wanted to judge the static test images. As shown in , we found TGIS contributed to a significant increase in inter-grading consistency of images representing different levels of ACC. The modified SUN grading scheme in conjunction with the TGIS provided less subjective and more reproducible assessments of ACC.
We did notice some inconsistencies using TGIS at higher grade levels, but several grade errors were recorded from only 2 graders, and only 3/7 provided an alternate grade score (supplemental ). Appropriate training on the use of the scale with test images may well reduce these discrepancies further, as training in pattern recognition has been shown to work well in improving consistency in reporting when other ophthalmic grading schemes.Citation20,Citation24 Further studies may show that TGIS can be used to standardize reporting of cells among clinicians and thus be used to certify clinicians prior to the start of clinical studies. In the future, imaging technology will provide better quantification methods which will be needed in pivotal studies, but a role for a simple standardized clinical assessment in less critical settings will remain.
In clinical studies, the range of ACC is often SUN grade 2+ or less.Citation25 With a requirement of a loss of 2 grades of activity or a grade of 0 as a definition of efficacy, meeting these criteria for new anti-inflammatory medications is challenging as it essentially has to eliminate any residual activity to be considered efficacious. In addition, grade 3 covers a broad range. Any improvement within the grade cannot be acknowledged in the present scale. By narrowing the range of cells in each of the grades and minimizing the number of overall grades, TGIS provides a greater discriminatory power in the effective assessment range in which physicians are most effective in providing a clinical judgment. This may render the TGIS scale particularly useful in the assessment of treatment responses in clinical trials.
Among the limitations of the current study are the limited numbers of test subjects, and the non clinical nature of the study, as is a focus on only the cellular response without any consideration for flare. Its strength is its ability to reproduce what has been reported in the clinical environment and the demonstration that a visual scale can provide more robust, reproducible responses by a variety of clinicians. The next steps will involve the validation of the scale in a clinical setting with multiple observers, and its use along side the existing SUN criteria in the management of patients with anterior uveitis. Following validation, it is hoped that the uveitis community will be willing to adopt it both in daily clinical use and in study settings. TGIS may be an important step toward a more systematic method of ACC counting.
Financial disclosure
MD de Smet: Tarsier (C,F); D Haim-Langford: Tarsier (E P I); R Neumann: Tarsier (C); M Kremer: Tarsier (C); E Cunningham: Tarsier C; L Deutsch: Tarsier (F); Z Milman: Tarsier (E)
Supplemental Material
Download MS Word (86.3 KB)Supplemental Material
Download MS Word (106.9 KB)Acknowledgments
The authors gratefully acknowledge the support of Oded Haim-Langford, the software developer of the system used in the first and second phases of this study
Supplementary material
Supplemental data for this article can be accessed on the publisher’s website.
Additional information
Funding
Related Research Data
References
- Hogan MJ, Kimura SJ, Thygeson P. Signs and symptoms of uveitis I. Anterior uveitis. Am J Ophthalmol. 1959;47(5 Pt 2):155–170. doi:10.1016/S0002-9394(14)78239-X.
- Schlaegel T. Essentials of Uveitis. New York City, USA: Little, Brown, Inc; 1969. 325.
- Nussenblatt RB, Palestine AG. Uveitis: Fundamentals and Clinical Practice. first ed. Chicago: Year Book; 1989.
- Jabs DA, Nussenblatt RB, Rosenbaum JT. Standardization of Uveitis nomenclature working G. Standardization of uveitis nomenclature for reporting clinical data. Results of the first international workshop. Am J Ophthalmol. 2005;140:509–516.
- Kempen JH, Ganesh SK, Sangwan VS, Rathinam SR. Interobserver agreement in grading activity and site of inflammation in eyes of patients with uveitis. Am J Ophthalmol. 2008;146(6):813–8 e1. doi:10.1016/j.ajo.2008.06.004.
- Sharma S, Lowder CY, Vasanji A, Baynes K, Kaiser PK, Srivastava SK. Automated analysis of anterior chamber inflammation by spectral-domain optical coherence tomography. Ophthalmol. 2015;122(7):1464–1470. doi:10.1016/j.ophtha.2015.02.032.
- Li Y, Lowder C, Zhang X, Huang D. Anterior chamber cell grading by optical coherence tomography. Invest Ophthalmol Vis Sci. 2013;54(1):258–265. doi:10.1167/iovs.12-10477.
- Agarwal A, Ashokkumar D, Jacob S, Agarwal A, Saravanan Y. High-speed optical coherence tomography for imaging anterior chamber inflammatory reaction in uveitis: clinical correlation and grading. Am J Ophthalmol. 2009;147(3):413–6 e3. doi:10.1016/j.ajo.2008.09.024.
- Invernizzi A, Marchi S, Aldigeri R, et al. Objective quantification of anterior chamber inflammation: measuring cells and flare by anterior segment optical coherence tomography. Ophthalmol. 2017;124(11):1670–1677. doi:10.1016/j.ophtha.2017.05.013.
- Choi WJ, Pepple KL, Wang RK. Automated three-dimensional cell counting method for grading uveitis of rodent eye in vivo with optical coherence tomography. J Biophotonics. 2018;11(9):e201800140. doi:10.1002/jbio.201800140.
- Konovalov A, Krajbich I. Neurocomputational dynamics of sequence learning. Neuron. 2018;98(6):1282–93 e4. doi:10.1016/j.neuron.2018.05.013.
- Hofmann M, Bezrukov I, Mantlik F, et al. MRI-based attenuation correction for whole-body PET/MRI: quantitative evaluation of segmentation- and atlas-based methods. J Nucl Med. 2011;52(9):1392–1399. doi:10.2967/jnumed.110.078949.
- Zu C, Wang Z, Zhang D, et al. Robust multi-atlas label propagation by deep sparse representation. Pattern Recognit. 2017;63:511–517. doi:10.1016/j.patcog.2016.09.028
- Hofmann M, Steinke F, Scheel V, et al. MRI-based attenuation correction for PET/MRI: a novel approach combining pattern recognition and atlas registration. J Nucl Med. 2008;49(11):1875–1883. doi:10.2967/jnumed.107.049353.
- Suther KR, Hopp E, Smevik B, et al. Can visual analogue scale be used in radiologic subjective image quality assessment? Pediatr Radiol. 2018;48(11):1567–1575. doi:10.1007/s00247-018-4187-8.
- Lopes R, Betrouni N. Fractal and multifractal analysis: a review. Med Image Anal. 2009;13(4):634–649. doi:10.1016/j.media.2009.05.003.
- Ogura A, Kamakura A, Kaneko Y, Kitaoka T, Hayashi N, Taniguchi A. Comparison of grayscale and color-scale renderings of digital medical images for diagnostic interpretation. Radiol Phys Technol. 2017;10(3):359–363. doi:10.1007/s12194-017-0393-6.
- Braverman B, Tambasco M. Scale-specific multifractal medical image analysis. Comput Math Methods Med. 2013;2013:262931. doi:10.1155/2013/262931.
- Blondheim DS, Beeri R, Feinberg MS, et al. Reliability of visual assessment of global and segmental left ventricular function: a multicenter study by the Israeli Echocardiography Research Group. J Am Soc Echocardiogr. 2010;23(3):258–264. doi:10.1016/j.echo.2009.12.020.
- Early Treatment Diabetic Retinopathy Study Research Group. Grading diabetic retinopathy from stereoscopic color fundus photographs - an extension of the modified Airlie House classification. ETDRS report number 10. Ophthalmol. 1991;98:786–806. doi:10.1016/S0161-6420(13)38012-9.
- Gomez-Valverde JJ, Anton A, Fatti G, et al. Automatic glaucoma classification using color fundus images based on convolutional neural networks and transfer learning. Biomed Opt Express. 2019;10(2):892–913. doi:10.1364/BOE.10.000892.
- Chylack LT Jr., Wolfe JK, Singer DM, et al. The lens opacities classification system III. The longitudinal study of cataract study group. Arch Ophthalmol. 1993;111(6):831–836. doi:10.1001/archopht.1993.01090060119035.
- Shaheen I, Akram M, editors. An integrated framework for clinical grading of cataract. 1rst International Conference on Next Generation Computing Applications (NextComp); 2017; Mauritius: IEEE.
- Ramanan AV, Dick AD, Guly C, et al. Tocilizumab in patients with anti-TNF refractory juvenile idiopathic arthritis-associated uveitis (APTITUDE): a multicentre, single-arm, phase 2 trial. Lancet Rheumatol. 2020;2(3):e135–e41. doi:10.1016/S2665-9913(20)30008-4.
- Lowder C, Belfort R Jr., Lightman S, et al. Dexamethasone intravitreal implant for noninfectious intermediate or posterior uveitis. Arch Ophthalmol. 2011;129(5):545–553. doi:10.1001/archophthalmol.2010.339.
Appendix A:
Instructions for clinicians while using the Tarsier GIS
Please dim the lights in the examination room
Use a narrow-slit bean 1 mm x 1 mm
Set the light intensity to the maximum (use Halogen light slit)
Go to magnification X16 of the slit beam box of magnification (if older versions Haag-Streit use the higher magnification of the two)
Set the slit beam at an angle of 45 from the vertical (first locking position on the HS slit lamp)
Focus midway between the cornea and the iris (to provide a clear illuminated path between the endothelial surface of the cornea and the surface of the lens or edge of the iris - get a good complete illumination of the anterior chamber slit beam while avoiding over illumination from reflected light)
Evaluate the most representative area and match the visualized cells density in the slit lamp to the closest TGIS (GRADING IMAGE SCALE).