
ABSTRACT
Purpose
To quantify retinochoroidal vascular parameters using swept-source optical coherence tomography (SS-OCTA) in quiescent posterior and panuveitis.
Methods
In this cross-sectional study, subjects with quiescent posterior and panuveitis underwent fundus imaging using SS-OCTA (DRI Triton®, Topcon, Japan). The metrics calculated were fractal dimension (FD), foveal avascular zone (FAZ) area, retinal vascularity index (capillary density index-CDI), and choroidal vascularity index (CVI).
Results
We included 38 eyes of 20 patients, 9 males aged 34.7 ± 10.5 years, 30 eyes of 30 age- and gender-matched healthy controls, 10 females aged 33.6 ± 8.5 years. Comparing patients with controls, we found a lower FD (p < .001), larger FAZ (p > .001), lower CDI in the superficial plexus (p = .019), and lower CVI (p < .001). We also found lower retinal and choroidal and thicknesses (p < .001 and p = .025, respectively).
Conclusions
Patients with quiescent posterior and panuveitis have a significantly reduced retinochoroidal vascular density compared to healthy control subjects.
Uveitis is a sight-threatening inflammation of the uveal tissue that can be caused by infectious or noninfectious etiologies. If not treated in a timely manner, uveitis can lead to blinding complications. Uveitis is estimated to be the cause of 5–10% of blindness or visual impairment worldwide.Citation1,Citation2 Up to 20% of legal blindness in developed countries can be attributed to complications of uveitis.Citation3,Citation4
The frequency of visual loss (20/60 or worse) with posterior uveitis can be as high as 50%.Citation3,Citation5–8 Among patients with panuveitis, the frequency of visual loss is even 60%.Citation3,Citation5,Citation6 Patients with posterior or panuveitis can develop complications such as (chronic) macular edema, epiretinal membrane, vasculitis, papillitis, retinal artery or vein occlusions, retinal necrosis, tractional retinal detachment, choroidal or retinal neovascularization, vitreous hemorrhage, glaucoma and cataract leading to further visual loss.Citation4
Diagnostic tools such as fluorescein angiography (FA), indocyanine green angiography (ICGA), optical coherence tomography (OCT), and OCT angiography (OCTA) play an important role in the diagnosis and in the management of the uveitis.Citation9–12 The latter is a revolutionary dye-less imaging method that provides three-dimensional mapping of the retinal and choroidal microvasculature.Citation10,Citation13 Thus, it can be used to detect non-invasively microvascular changes in retina and choroid with high resolution.
Recently, OCTA has been used to analyze the retinal and choroidal vascular densities of various uveitic entities such as HLA B-27 associated anterior uveitis, ocular tuberculosis, panuveitis, Vogt-Koyanagi-Harada’s disease, intermediate uveitis, and optic neuritis.Citation10 These studies showed that even in uveitic entities where the primary anatomical location of uveitis is not the retinal vasculature (i.e. retinal vasculitis), microcirculation can still be affected in patients with posterior/panuveitis. These alterations have been identified by calculation of parameters such as retinal vascular densities and foveal avascular zone (FAZ) areas. Whether these retinal vascular changes have a long-term bearing on the health of the outer retina, including the retinal photoreceptors and retinal pigment epithelium (RPE), is yet to be demonstrated. Similarly, these retinal vascular alterations have not been correlated with visual acuity in subjects with quiescent ocular inflammatory disease.
In this study, we enrolled subjects with posterior/panuveitis and analyzed their retinochoroidal vasculature using OCTA in the quiescent stage of the disease and correlated their best-corrected visual acuity with parameters quantifying the retinal microvasculature. In addition, we compared these parameters between patients with quiescent uveitis and normal control subjects to understand the pathological mechanisms behind suboptimal visual recovery.
Materials and methods
Study design and study subjects
This was a cross-sectional study conducted at the Retina Services of the Advanced Eye Center, PGI Chandigarh between February 2020 and January 2021. Our study included consecutive patients of quiescent posterior or panuveitis. The subjects were screened by two uveitis experts to determine whether the disease is active or quiescent. Quiescence was determined clinically with the absence of anterior cells/flare, vitreous cells and haze, active choroiditis or retinitis, and no sign of inflammation on optic nerve confirmed using FA and ICGA.
Cooperative subjects above 18 years of age willing to undergo OCTA were included. In addition, normal healthy subjects with no known ocular disease (“controls”) were included for comparison. The exclusion criteria were hazy media due to various reasons such as cataract, small pupil (less than 3 mm) and vitreous hemorrhage, and poor image quality on OCTA (signal strength <40) or with artifacts such as motion artifact. Subjects with macular pathologies such as scars, healed scars/pigmented retinochoroidal lesions, subfoveal fibrous bands, epiretinal membranes, or traction bands were also excluded. Patients with macular edema were excluded from the study because the presence of cystoid spaces can affect the retinal parameters on OCTA. History of retinal surgery such as pars plana vitrectomy (PPV) or any intravitreal injections including anti-vascular endothelial growth factor (anti-VEGF) therapies and dexamethasone implant were also criteria for exclusion. Patients having other concomitant disease that can affect retinal vasculature such as optic neuropathy, glaucoma, and age-related macular degeneration were also excluded. Cataract surgery performed 3 months prior was not an exclusion criterium. Written informed consent was obtained from all individual participants included in the study by the principles of the Declaration of Helsinki.
Study procedures
We enrolled 20 patients with quiescent posterior/panuveitis and 30 healthy control subjects with no known ocular or systemic disease (only right eye of control subjects were selected for analysis). All enrolled patients underwent a comprehensive ophthalmic examination including best-corrected visual acuity by Snellen’s chart (converted to LogMAR units for statistical analysis). Pupils of the patients were dilated by instilling tropicamide 0.8%. Following ancillary investigations were performed: swept-source optical coherence tomography (SS-OCT) (DRI Triton, Topcon®, Tokyo, Japan), color fundus, and autofluorescence. FA and ICGA were completed to determine the activity of the disease as deemed by the treating uveitis specialist (Heidelberg, Spectralis®, and Germany). Optical coherence tomography angiography (OCTA) was performed on swept-source imaging device (DRI Triton, Topcon). The individual was instructed to fixate with the eye being measured on the internal fixation target within view of the examiner real-time. OCTA using 3 × 3 mm view centered on the fovea was done. The acquisition of the scans was repeated and the images with the least amount of motion artifacts were selected for further analysis.
Measurement of fractal dimension
Fractal analysis is a geometric measure of the complexity of the retinal microvascular tissue and is measured as a ratio using mathematical models. This novel analysis has been applied to several retinal conditions recently to study the complexity of retinal vascular branching, and its rarefication in vascular disorders such as diabetic retinopathy and retinal detachment.Citation14–16 The OCTA images were processed using ImageJ for fractal analysis. The OCTA images (en face) of the superficial and deep retinal plexuses were binarized, and then skeletonized was processed on public domain software ImageJ (National Institutes of Health, Bethesda, USA). Fractal analysis was performed using Fractalyse® (ThéMa, Besançon Cedex, France) using the box-counting method. The fractal analysis generates the fractal dimension (FD) of the image. A higher FD indicates a denser and complex vascular branching pattern.
Measurement of FAZ
The FAZ area in the SCP was measured by two independent experienced investigators. The graders were manually outline the inner border of foveal capillaries in the FAZ using Image software (http://imagej.nih.gov/ij/; provided in the public domain by the National Institutes of Health, Bethesda, MD, USA). The total number of pixels in the FAZ area was converted into millimeters squared for analysis. Eyes with significant image distortion or artifact preventing accurate measurement of the FAZ and vessel density were excluded.
Measurement of retinal vascularity index
The retinal vascularity index was calculated in terms of capillary density index (CDI). A custom semi-automated algorithm was used to quantify the CDI and fractal dimension (FD). For CDI, all OCTA images were analyzed using ImageJ. Using the Niblack thresholding and ROI manager, all images were binarized and converted to 8-bits with a mean pixel value and standard deviation of all points. Subsequently, the luminal area (LA) was highlighted within the circle with the brightness set to 0 and 254. The LA in the individual quadrant was merged with the corresponding threshold area and measured using ROI manager. The CDI of each quadrant was defined as the percentage of capillary density over the stromal area at the macula region. The global CDI is the average CDI value within the 1.5 mm-radius circle centering on the subfoveal region. CDI was obtained at both, superficial and deep retinal capillary plexus.
Measurement of choroid vascularity index (CVI)
In order to measure the CVI, image binarization was performed for all the scans obtained from patients. A subfoveal scan (central B-scan) was chosen for image analyses. The image was processed on public domain software Image J (National Institutes of Health, Bethesda, USA). Polygon tool will be used to select the total choroid area (TCA), which will be added in the region of interest (ROI) manager. After converting the image into 8 bit, Niblack auto local thresholding will be subsequently applied which gives the mean pixel value with standard deviation for all the points. On the SS-OCT scans, the luminal Area (LA) was highlighted by applying the color threshold. In order to determine the LA within the selected polygon, both the areas in ROI manager were selected and merged by ‘AND’ operation of Image J. The composite third area was added to the to the ROI manager. The first area represents the total of the choroid selected, and the third composite area is the vascular or LA. Stromal area (SA), which corresponds to the interstitial or stromal component of the choroid, was obtained by calculating the differences between TCA and LA. The CVI was calculated by dividing LA by TCA.
Statistical methods
Statistical analysis was done using SPSS© version 26 for Windows (IBM Inc., Chicago, IL, USA). Data entries were performed in pre-designed forms and excel sheets using Microsoft Excel 2016© for Windows. All data were checked for their normality using Kolmogorov–Smirnov test within each group. The data are presented as mean ± standard deviation. For categorical data, their association with the groups were analyzed using the Fisher’s exact test. The various retinochoroidal parameters were checked between the two groups using Students t test. The differences between the retinochoroidal metrics between the control subjects and patients with quiescent uveitis were ascertained by analysis of variance (ANOVA) test. Pearson’s correlation test was used to determine the effect of signal strength and age on the retinochoroidal parameters such as FD and central macular thickness. Regression analysis was performed to determine the effect of these factors on the retinochoroidal parameters. A p value <.05 was considered statistically significant.
Results
Demographic profile
This study included 38 eyes of 20 patients with quiescent posterior or panuveitis, 9 males and 11 females with a mean age of 34.7 ± 10.5 years. Mean follow-up was 13.3 ± 6.1 months. The diagnosis of the included subjects was as follows: healed choroiditis (17 eyes), idiopathic retinal vasculitis (6 eyes), Behcet’s disease (4 eyes), sarcoid-related panuveitis (2 eyes), tubercular choroidal granuloma (2 eyes), and undifferentiated panuveitis (7 eyes). We also included 30 eyes of 30 normal control subjects (10 females, 20 males) with no known ocular disease, with a mean age of 33.6 ± 8.5 years. There was no difference between healthy control subjects and patients in age (p = .71) and gender distribution (p = .15).
shows the study parameters for patients and controls for both OD and OS. We found no differences between the left and right eye in patients. Visual acuity in patients was significantly lower compared to control subjects (0.49 ± 0.59 versus 0.070 ± 0.075, p = .006). We found no differences in signal strength between patients and controls.
Table 1. Retinal and choroidal vascular density indices and other metrics among patients and control subjects.
Retinal parameters
The fractal dimension in patients was significantly lower compared to control subjects, both in the superficial and deep plexus (1.34 ± 0.09 versus 1.51 ± 0.06 and 1.49 ± 0.12 versus 1.65 ± 0.05 respectively, both p < .001) (). The foveal avascular zone area, determined in the superficial plexus only, was significantly higher than the control subjects (0.34 ± 0.08 mm2 versus 0.26 ± 0.08 mm2, p < .001). The capillary density index (see ) was significantly lower in patients compared to control subjects for the superficial (66.1 ± 5.4% versus 69.7 ± 4.0%, p = .019). We found no difference for the deep capillary plexus. The central macular thickness was significantly lower in patients compared to control subjects (199 ± 37 µm versus 255 ± 31 µm, p < .001).
Figure 1. The figure shows calculation of the fractal dimension (FD) of the superficial retinal capillary plexus on en face optical coherence tomography (OCTA) in a normal subject (a-c) and a patient with posterior uveitis (healed) (d-f). The superficial plexus of the normal subject on OCTA is shown in A. The postprocessing skeletonized image is shown in B. The FD graph is depicted in C. The superficial plexus of the patient on OCTA is shown in D. Corresponding skeletonized image and FD graph is shown in E and F.
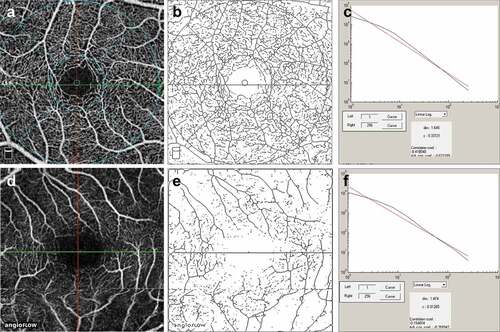
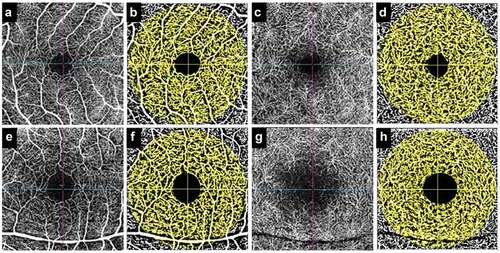
Figure 2. Figure shows an example of calculation of retinal vascular density (capillary density index) of the superficial and deep capillary plexus in a healthy control (a-d) and a patient with quiescent panuveitis (e-h). The superficial plexus (a) of the healthy control has been processed (b), and the deep plexus is represented by C (pre-processed) and D (post-processing). Similarly, the superficial plexus of the patient is shown in E and F (pre- and post-processing), and deep plexus is shown in G and H (pre- and post-processing). The larger area of foveal avascular zone and reduced capillary density can be appreciated in the patient versus healthy control.
Choroidal parameters
The choroidal thickness in the foveal center in patients was significantly lower compared to control subjects (252 ± 22 µm versus 279 ± 58 µm, p = .025). The CVI, calculated by obtaining the TCA and LA, was significantly lower in patients compared to control subjects (62.5 ± 3.1% versus to 66.1 ± 1.7%, p < .001).
The signal strength showed a significant correlation with the fractal dimension both for the superficial and deep plexus (r = 0.38, p = .001 and r = 0.25, p = .043, respectively). Further, age showed a significant correlation with central macular thickness (r = −0.31, p = .11). We therefore applied regression analysis to account for these covariates. However, this did not change the trends described above.
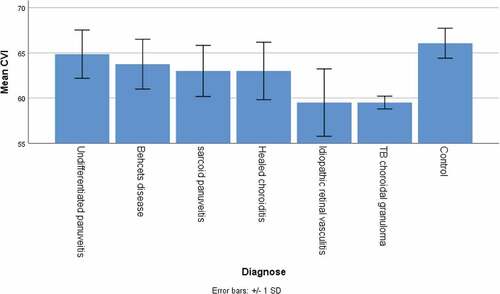
We further looked for possible differences between the different types of uveitis, including both left and right eyes because of the low number per type. Significant differences were present for FD of the deep plexus (p = .047) and CVI (p = .049), visualized in . For clarity we included the controls in these figures as well. For all other parameters we found no differences between the uveitis types (all p > .10).
Figure 3. Analysis of the mean fractal dimension (FD) among the different types of uveitis showed that there were significant differences between the control subjects who had a higher FD in the deep plexus compared to patients with uveitis, specifically Behcet’s disease which showed the lowest FD.
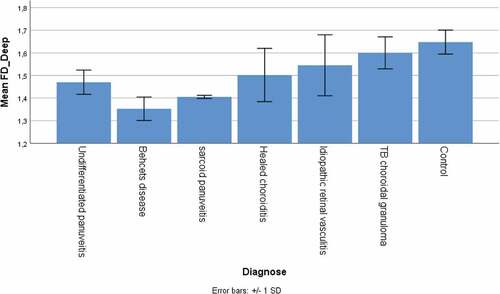
Figure 4. The analysis of mean choroidal vascularity index (CVI) among different types of uveitis revealed a higher CVI among control subjects compared to patients with healed uveitis. Subjects with tuberculosis and retinal vasculitis had the lowest CVI.
Discussion
Posterior uveitis and panuveitis result in involvement of the retinochoroidal structures with a propensity to cause structural damage and permanent vision loss. Therefore, the primary aim in the management of uveitis includes rapid control of inflammation, maintenance of quiescence and prevention of future recurrences. Active episodes of uveitis are known to result in alterations involving the photoreceptors, retinal pigment epithelium and the choriocapillaris causing severe visual loss. In addition, complications of uveitis such as choroidal neovascularization or cystoid macular edema can also result in visual loss even after the primary uveitic entity has achieved quiescence.
The current study was performed with a goal to understand the retinochoroidal vascular alterations in posterior uveitis/panuveitis once quiescence is achieved and in the absence of complications such as choroidal neovascularization or cystoid macular edema. The rationale behind this study was to ascertain the cause of suboptimal visual gain in subjects with healed disease – especially those without macular alterations such as subretinal fibrosis or scarring. We included only those eyes which did not have scars, pigmented retinochoroidal lesions, subfoveal fibrous bands, epiretinal membranes, or traction bands, to prevent any confounding factors. In addition, none of the eyes in our series underwent previous vitreoretinal surgeries.
We observed reduced retinal and choroidal vascular indices in subjects with quiescent uveitis compared to healthy control subjects. highlights the significant differences in the CDI (both superficial and deep retinal plexuses) and CVI (choriocapillaris) when comparing patients with control subjects. It shows a reduction in the density of retinal vasculature in both the superficial and deep retinal layers in posterior uveitis/panuveitis. This reduction was accompanied by a decrease in both central macular thickness and subfoveal choroidal thickness values in patients compared to control subjects. Thus, we hypothesize that when patients with active posterior/panuveitis achieve quiescence, there is a reduction in retinal and choroidal thickness values, which is accompanied by reduction in vascular density as a secondary phenomenon due to the ensuing atrophy.
A reduction in retinal and choroidal thickness in patients with healed/quiescent disease has been previously demonstrated by other authors. Karampelas et al.Citation17 showed a reduction in choroidal thickness among patients with idiopathic panuveitis compared to healthy control subjects. The authors also measured Haller’s layer thickness values and found them to be reduced as well.Citation17 Similar reduction in outer retinal layer thicknesses has been observed in patients with healed long-standing birdshot chorioretinopathy by Symes et al.Citation18 Bittencourt et al. evaluated eyes with myopia, noninfectious uveitis, and healthy controls for choroidal thickness values. They observed thinner choroid in patients with uveitis compared to both healthy controls and myopic patients.Citation19 Thus, our study agrees with previously reported literature in this regard.
We also observed reduced FD values in both superficial and deep retinal plexus among patients with uveitis compared to healthy control subjects. FD values is a geometric measure of the complexity of vascular branching pattern. Thus, a lower FD value indicates less complex branching and therefore, rarefication of blood vessels. On the other hand, higher FD values indicates complex and multiple branching patterns. We found lower FD values in the subjects with uveitis compared to normal controls. This indicates the relative rarefication of blood vessels in both superficial and deep retinal plexuses in patients with quiescent uveitis. Thus, apart from reduction in density, analysis of FD demonstrates that there is an actual reduction in vessel branching within the retinal layers. Previously, a reduced FD has been shown by Agarwal et al.Citation14 in subjects with rhegmatogenous retinal detachment following surgical intervention compared to control subjects. The authors concluded that a reduction in FD values correlated well with the suboptimal visual gain experienced by the patients in the postoperative period.Citation14 We observed a similar finding in our index study.
We also observed that the FAZ area was enlarged in patients with quiescent posterior uveitis and panuveitis compared to control subjects. The FAZ area has been shown to correlate well with disease severity and vascular compromise in conditions such as diabetes mellitus.Citation20–22 In the context of quiescent uveitis, the decrease (Is not increase?) in FAZ area compared to control population is a novel finding of our study. This further supports the hypothesis that ensuing inflammation leads to long-term damage to retinal microvasculature leading to permanent reduction in parafoveal vascularity.
For studying the retinochoroidal vasculature in different types of uveitis, we performed an ANOVA and observed significant differences in the mean FD in the deep plexus (0.047) and CVI (0.049). A lower mean FD in the deep plexus was observed in the patients with Behcet’s disease, sarcoidosis, and healed choroiditis. These entities affect the choriocapillaris perfusion and deep choroidal perfusion adversely, explaining the lower values of mean FD in these eyes. Similarly, the CVI was significantly lower in eyes with deep choroidal pathologies such as tuberculosis, sarcoidosis, and healed choroiditis.
It is likely that retinitis lesions can have more impact on the retinal vasculature, and choroiditis lesions can affect the choroidal vasculature more. In our study, we included patients with healed choroiditis (17 eyes), idiopathic retinal vasculitis (6 eyes), Behcet’s disease (4 eyes), sarcoid-related panuveitis (2 eyes), tubercular choroidal granuloma (2 eyes), and undifferentiated panuveitis (7 eyes). It is likely that all the diseases (except retinal vasculitis) may have an impact on both retinal and choroidal vasculature. We did not include patients with necrotizing retinitis in our study, because the analysis of retinal vasculature on OCTA in these patients leads to segmentation errors and inaccurate vessel measurements. In the future, it may be beneficial to identify different subsets of uveitis patients based on the layers of the retinochoroid affected by the disease.
Our study has various limitations. Being a cross-sectional study, it did not evaluate long-term retinochoroidal changes as the disease evolved from an active to an inactive state. The study also has a modest sample size. However, we excluded several patients with retinal scars and fibrosis, a relatively common occurrence in posterior uveitis. The study also considered both eyes if the patient had bilateral disease, which is another limitation in the analysis.
In summary, our study reports significantly lower retinochoroidal vascular parameters in patients with quiescent posterior uveitis and panuveitis. Parameters such as FAZ area, FD, CDI, and CVI are useful as imaging biomarkers in assessing damage to the retinal and choroidal microvasculature.
Declaration of interest
The authors report no conflicts of interest. The authors alone are responsible for the content and writing of the paper.
Financial disclosures
The authors have no financial disclosure/proprietary interest. The authors report no conflicts of interest. The authors alone are responsible for the content and preparation of this manuscript.
References
- Chang JH-M, Wakefield D. Uveitis: a global perspective. Ocul Immunol Inflamm. 2002;10(4):263–279. doi:10.1076/ocii.10.4.263.15592.
- Miserocchi E, Fogliato G, Modorati G, Bandello F. Review on the worldwide epidemiology of uveitis. Eur J Ophthalmol. 2013;23(5):705–717. doi:10.5301/ejo.5000278.
- Rothova A, Suttorp-van Schulten MS, Frits Treffers W, Kijlstra A. Causes and frequency of blindness in patients with intraocular inflammatory disease. Br J Ophthalmol. 1996;80(4):332–336. doi:10.1136/bjo.80.4.332.
- Durrani OM, Meads CA, Murray PI. Uveitis: a potentially blinding disease. Ophthalmol J Int Ophtalmol Int J Ophthalmol Z Augenheilkd. 2004;218(4):223–236. doi:10.1159/000078612.
- Agrawal R, Gunasekeran DV, Agarwal A, et al. Visual morbidity in ocular tuberculosis - collaborative ocular tuberculosis study (COTS)-1: report #6. Ocul Immunol Inflamm. Published online June 30 2020:1–9. doi:10.1080/09273948.2020.1774905.
- Pistilli M, Joffe MM, Gangaputra SS, et al. Visual acuity outcome over time in non-infectious uveitis. Ocul Immunol Inflamm. Published online December 10 2019:1–8. doi:10.1080/09273948.2019.1687733.
- Kempen JH, Van Natta ML, Altaweel MM, et al. Factors predicting visual acuity outcome in intermediate, posterior, and panuveitis: the multicenter uveitis steroid treatment (MUST) trial. Am J Ophthalmol. 2015;160(6):1133–1141.e9.doi:10.1016/j.ajo.2015.09.017.
- Dick AD, Tundia N, Sorg R, et al. Risk of ocular complications in patients with noninfectious intermediate uveitis, posterior uveitis, or panuveitis. Ophthalmology. 2016;123(3):655–662.doi:10.1016/j.ophtha.2015.10.028.
- Dingerkus VLS, Munk MR, Brinkmann MP, et al. Optical coherence tomography angiography (OCTA) as a new diagnostic tool in uveitis. J Ophthalmic Inflamm Infect. 2019;9(1):10.doi:10.1186/s12348-019-0176-9.
- Marchese A, Agarwal A, Moretti AG. et al. Advances in imaging of uveitis. Ther Adv Ophthalmol. 2020;12:2515841420917781. doi:10.1177/2515841420917781.
- Agarwal A, Aggarwal K, Gupta V. Infectious uveitis: an Asian perspective. Eye Lond Engl. 2019;33(1):50–65. doi:10.1038/s41433-018-0224-y.
- Vira J, Marchese A, Singh RB, Agarwal A. Swept-source optical coherence tomography imaging of the retinochoroid and beyond. Expert Rev Med Devices. 2020;17(5):413–426. doi:10.1080/17434440.2020.1755256.
- Rocholz R, Corvi F, Weichsel J, Schmidt S, Staurenghi G. OCT angiography (OCTA) in retinal diagnostics. In: Bille JF, ed. High Resolution Imaging in Microscopy and Ophthalmology: New Frontiers in Biomedical Optics. Cham, Switzerland: Springer; 2019:135–160. Accessed September 18, 2020 http://www.ncbi.nlm.nih.gov/books/NBK554041/
- Agarwal A, Aggarwal K, Akella M, et al. Fractal dimension and optical coherence tomography angiography features of the central macula after repair of rhegmatogenous retinal detachments. Retina Phila Pa. 2019;39(11):2167–2177.doi:10.1097/IAE.0000000000002276.
- Hashmi S, Lopez J, Chiu B, Sarrafpour S, Gupta A, Young J. Fractal dimension analysis of OCTA images of diabetic retinopathy using circular mass-radius method. Ophthalmic Surg Lasers Imaging Retina. 2021;52(3):116–122. doi:10.3928/23258160-20210302-01.
- Alam M, Le D, Lim JI, Yao X. Vascular complexity analysis in optical coherence tomography angiography of diabetic retinopathy. Retina Phila Pa. 2021;41(3):538–545. doi:10.1097/IAE.0000000000002874.
- Karampelas M, Sim DA, Keane PA, et al. Choroidal assessment in idiopathic panuveitis using optical coherence tomography. Graefes Arch Clin Exp Ophthalmol Albrecht Von Graefes Arch Klin Exp Ophthalmol. 2013;251(8):2029–2036.doi:10.1007/s00417-013-2330-7.
- Symes R, Young M, Forooghian F. Quantitative assessment of retinal degeneration in birdshot chorioretinopathy using optical coherence tomography. Ophthalmic Surg Lasers Imaging Retina. 2015;46(10):1009–1012. doi:10.3928/23258160-20151027-04.
- Bittencourt MG, Kherani S, Ferraz DA, et al. Variation of choroidal thickness and vessel diameter in patients with posterior non-infectious uveitis. J Ophthalmic Inflamm Infect. 2014;4(1):14.doi:10.1186/s12348-014-0014-z.
- Park YG, Kim M, Roh YJ. Evaluation of foveal and parafoveal microvascular changes using optical coherence tomography angiography in type 2 diabetes patients without clinical diabetic retinopathy in South Korea. J Diabetes Res. 2020;2020:6210865. doi:10.1155/2020/6210865.
- Abdelshafy M, Abdelshafy A. Correlations between optical coherence tomography angiography parameters and the visual acuity in patients with diabetic retinopathy. Clin Ophthalmol Auckl NZ. 2020;14:1107–1115. doi:10.2147/OPTH.S248881.
- Stana D, Potop V, Istrate SL, et al. Foveal avascular zone area measurements using OCT angiography in patients with type 2 diabetes mellitus associated with essential hypertension. Rom J Ophthalmol. 2019;63(4):354–359. doi:10.22336/rjo.2019.55.