
ABSTRACT
This study aims to investigate the effect of a systemic lipopolysaccharide (LPS) stimulus in the course of laser-induced choroidal neovascularization (CNV) in C57BL/6 J mice. A group of CNV-subjected mice received 1 mg/kg LPS via the tail vein immediately after CNV induction. Mouse eyes were monitored in vivo with fluorescein angiography for 2 weeks. In situ hybridization and flow cytometry were performed in the retina at different time points. LPS led to increased fluorescein leakage 3 days after CNV, correlated with a large influx of monocyte-derived macrophages and increase of pro-inflammatory microglia/macrophages in the retina. Additionally, LPS enhanced Vegfα mRNA expression by Glul-expressing cells but not Aif1 positive microglia/macrophages in the laser lesion. These findings suggest that systemic LPS exposure has transient detrimental effects in the course of CNV through activation of microglia/macrophages to a pro-inflammatory phenotype and supports the important role of these cells in the CNV course.
Several studies have implicated inflammation in the development and progression of retinal diseases such as diabetic retinopathy and age-related macular degeneration (AMD).Citation1,Citation2 Activation of resident microglia and infiltration of monocyte-derived macrophages from the periphery have been documented in mouse models of eye disease, including choroidal neovascularization (CNV), a characteristic of wet AMD.Citation3,Citation4 The reduction of vascular leakage through suppression of retinal immune cells reactivity after local injection of polysialic acid or after oral administration of the colony-stimulating factor 1 inhibitor PLX5622 further supports the involvement of innate immune cells activation in the progression of CNV.Citation5,Citation6 Activation of retinal Müller glia by infiltrating macrophages during CNV has been also reported, suggesting that macrophages interact with Müller cells to orchestrate the inflammatory response.Citation4,Citation7
Systemic inflammatory stimuli can trigger the activation of innate immune cells in the central nervous system. In murine prion and Alzheimer’s disease models, for instance, systemic exposure to lipopolysaccharide (LPS) led to increased brain microglia activation accompanied by increased cytokine production and neurodegeneration.Citation8,Citation9 Likewise, in the retina, systemic LPS-induced inflammation increased the number of reactive microglia and photoreceptor loss, and worsened synaptic function in a model of inherited retinal dystrophy in rats.Citation10 In agreement with these studies, in diabetic patients, an association between high levels of LPS in blood serum and the progression of microvascular complications of diabetes has been reported, suggesting that systemic LPS may be involved in diabetic retinal pathology.Citation11
LPS is an endotoxin that can elicit inflammatory responses by binding mainly to the pattern recognition receptor Toll-like receptor 4 (TLR4).Citation12 According to previous studies, TLR4 signaling over-activation induces the production of pro-inflammatory cytokines in the retina, which may contribute to the formation of choroidal neovascularization.Citation13 In humans, LPS is released by gram-negative bacteria in the gastrointestinal tract and very low or undetectable levels are present in the circulation, due to the inability of LPS to cross the healthy intestinal epithelium.Citation14 Disruption of the intestinal barrier function can cause LPS transport into the systemic circulation, leading to flu-like symptoms and septic shock among others.Citation15 Systemic LPS exposure has been correlated with several diseases such as autism,Citation16 sporadic amyotrophic lateral sclerosis, Alzheimer’s disease,Citation17 allergic airway disease in childrenCitation18 and others. Specifically in the retina, a correlation between systemic LPS and progression of diabetic retinopathy has been proposed (for a recent review see,Citation19) whilst in healthy volunteers that received LPS intravenously, leukocytosis in the blood was correlated with increased numbers of immune cells in ocular microvessels, retinal vasodilation, and vascular dysregulation.Citation20 A connection between the gut microbiome and retinal disease has gained attention during the last yearsCitation21 and specific bacteria have been proposed as potential biomarkers for diagnosis of neovascular AMD.Citation22 However, whether bacteria are involved in the formation of CNV remains to be elucidated.
Here, we utilized a murine model of CNV to investigate whether a systemic LPS stimulus immediately after CNV induction, may affect CNV progression. This model has been previously established by others, first in non-human primates and later in rodents.Citation23,Citation24 It is based on the use of laser photocoagulation to disrupt the layer that separates the retinal pigment epithelium and the choroid, the Bruch’s membrane, leading to development of new blood vessels, similar to that observed in patients suffering from wet AMD.Citation24 The laser-induced CNV model has a high success rate and it has become the most used rodent model for the study of neovascular AMD.
The data obtained in the present study suggest that systemic LPS exposure immediately after the CNV induction exacerbates fluorescein leakage during CNV mainly by (1) increasing the infiltration of pro-inflammatory monocyte-derived macrophages into the CNV lesion, (2) increasing microglia activation to a pro-inflammatory phenotype and (3) enhancing Vegfα mRNA expression by Glul-expressing cells adjacent to the lesion area.
Materials and methods
Experimental animals
This study was approved by the local Animal Ethics Committee (Veterinärdienst des Kantons Bern: BE 136/16 and BE34/20) and conformed to the Association for Research in Vision and Ophthalmology Statement for the Use of Animals in Ophthalmic and Vision Research. Adult 3–6 months old male and female C57BL6/J mice were used. Animals were housed under controlled temperature and humidity conditions in ventilated cages with a 12-h light–dark cycle and had access to food and water ad libitum. Before and after CNV induction or in vivo imaging, the mice were anesthetized and anesthesia was reversed, respectively, as described elsewhere.Citation25 At the end of the experiments, mice were euthanized with CO2 inhalation followed by decapitation. All efforts were made to minimize animal suffering.
Systemic inflammation and laser-induced choroidal neovascularization
CNV was induced in anesthetized mice with laser photocoagulation using a 532 nm argon laser (Visulas 532s; Carl Zeiss Meditec AG, Oberkochen, Germany) according to previous studies.Citation6 Three laser spots around the optic nerve head were applied per eye (50 μm size, 300 mV intensity, 100 ms duration) and both eyes were lasered per mouse. A group of mice was injected intravenously (tail vein) with a single dose of LPS from E. coli (1 mg/kg; Sigma-Aldrich, GmbH, Buchs, Switzerland in 1x sterile phosphate buffer saline, PBS, pH 7.4), immediately after the CNV induction (CNV+LPS group). A second group of mice received the same volume of PBS instead of LPS (CNV group). Since LPS pre-conditioning has been reported to have beneficial effects on CNV progression,Citation26 a third group of mice was injected with the same dose of LPS 1 week before the CNV induction to test whether we can detect a similar beneficial effect. In vivo imaging was performed at different time points after the CNV induction as described below. Mice were randomly assigned to the CNV or CNV + LPS groups. The experiment was performed twice and 4–6 mice per experimental group were treated per session.
In vivo imaging and fluorescein leakage measurements
Anesthetized mice were monitored in vivo using fluorescein angiography (FA) to visualize the retinal vasculature and to monitor the fluorescein leakage. Mice were imaged 3 days (d3), 7 days (d7) and 14 days (d14) after the CNV induction. FA was performed using a Heidelberg Spectralis system (Heidelberg Spectralis HRA 2; Heidelberg Engineering GmbH, Heidelberg, Germany) and a non-contact 55° wide field lens (Heidelberg Engineering GmbH) as described elsewhere.Citation6,Citation25 We have recently shown that measurement of fluorescein leakage correlates well with CNV measurements ex vivo.Citation27 Thus, the Heyex software version 1.10.2.0 (Heidelberg Engineering Inc., Franklin, USA) was used for the delineation and measurement of fluorescein leakage areas. Lesions with hemorrhages were excluded from the analysis. Fluorescein leakage areas were measured in pixel and were normalized to baseline.
Immunohistochemistry and microscopy
All subsequent experiments were conducted in mice that were exposed to LPS immediately after the CNV induction, since the effects of the immediate exposure of CNV-subjected mice to LPS have not been reported in the literature so far. Eyes were fixed in 4% paraformaldehyde solution (PFA in 1x PBS, pH 7.4) overnight, were embedded in paraffin and 5 μm sections were collected on Superfrost slides using a microtome (Leica Biosystems, Muttenz, Switzerland). The slides were deparaffinized, rehydrated, and incubated in Tris-EDTA buffer (pH 9.0, 95°C, 10 min). Slices were blocked for 30 min with 5% normal goat serum (NGS, Lucerna-Chem AG, Luzern, Switzerland) in 0.2% Triton X-100 in 1x PBS (blocking buffer) and incubated with a rabbit polyclonal antibody against the microglia/macrophage marker ionized calcium-binding adapter molecule 1 (anti-iba1 rabbit polyclonal antibody, 1:500, Cat # 016–20001, FUJIFILM Wako Shibayagi, Japan) overnight at 4°C in blocking buffer. The slides were washed in 1x PBS and incubated with the secondary antibody goat anti-rabbit Alexa Fluor 594 conjugate (1:1000, Cat # A11012, ThermoFisher scientific, Waltham, MA, USA) for 1 h at room temperature. Cell nuclei were labelled using mounting medium with DAPI (Vector Laboratories, Reactolab SA, Servion, Switzerland). Images were acquired on a fluorescence Nikon Eclipse 80i microscope (Nikon, Tokyo, Japan).
Flow cytometry
For flow cytometry experiments, six laser spots were applied per eye. Retinas from CNV-subjected and PBS-challenged mice (CNV group), and CNV-subjected and LPS-challenged mice (CNV+LPS group) were mechanically detached from euthanized mice 3 or 7 days after the laser application. Retinas from naïve mice were used as controls and both retinas of each mouse were analyzed as one sample. Tissues were processed according to previous studies.Citation28 Samples were stained with fluorescent-labeled anti-mouse monoclonal antibodies against the extracellular markers: leukocyte common antigen CD45, expressed by leukocytes and in lower levels by microgliaCitation29,Citation30 (CD45-APC/Cy7; clone 30-F11; Cat # 103115, 1:400), CD11 antigen-like family member B (CD11b-APC; clone M1/70; Cat # 101212, 1:200), which is expressed by myeloid-lineage cells and microgliaCitation29 and the pro-inflammatory activation marker costimulatory molecule CD80 (CD80-BV421; clone 16–10A1; Cat # 104725, 1:100). B-lymphocytes, T cells, natural killer cells and granulocytes were excluded from the analysis using FITC conjugated monoclonal antibodies against CD19 (clone 6D5; Cat # 115505, 1:200), CD3 (clone 17A2; Cat # 100203, 1:200), NK1.1 (clone PK136; Cat # 108705, 1:200) and Ly6G (clone 1A8; Cat # 127605, 1:200). Samples were fixed with 2% PFA, were permeabilized and stained with fluorescent-labeled antibodies against the intracellular microglia/macrophages activation markers CD68-PerCP/Cy5.5 (monoclonal, clone FA-11; Cat # 137010, 1:100) and Arginase 1-PE (Arg1; polyclonal, cat # IC5868P; 1:100). Zombie Green Fixable Viability Kit (Cat # 423111; 1:800) was used for detection of dead cells, according to manufacturer’s instructions. Prior to antibody staining, samples were incubated with TruStain FcX™ PLUS (anti-mouse CD16/32; clone S17011E; Cat # 156603, 1:200) to block non-specific staining. An LSR II Cytometer System with the BD FACSDiva software version 4.1 (BD Biosciences, Allschwil, Switzerland) was used for data acquisition. The Flowjo single-cell analysis software version 10 (TreeStar, Ashland, OR) was used for the analysis of the flow cytometry data. All antibodies were purchased from Biolegend (San Diego, CA, USA) apart from Arg1 that was purchased from R&D systems (Minneapolis, MIN, USA). The experiment was performed 3 times and 3–4 mice per experimental group were used for each experiment. Eyes with obvious intraocular hemorrhages were excluded from the analysis.
In situ hybridization (ISH)
Paraffin eye sections of 5 μm thickness were processed for in situ hybridization using BaseScope probes (Advanced Cell Diagnostics SRL, Vignate, Italy) to detect Vegfα (Cat # 823291-C2; target region: 1304–1655), Tlr4 (Cat # 891651-C2; target region: 395–536), Glul (Cat # 891661; target region: 146–273) and Aif1 (Cat # 891671; target region: 620–760) mRNA with a BaseScope™ Duplex Reagent Kit (Advanced Cell Diagnostics SRL, Vignate, Italy) according to manufacturer instructions. Briefly, slides were incubated for 1 h at 60°C in a HybEZ™ II oven (Advanced Cell Diagnostics SRL, Vignate, Italy) and de-paraffinization was performed with serial immersion in xylene and 100% ethanol. The slides were dried in the oven at 60°C, and endogenous peroxidase activity was blocked with incubation in hydrogen peroxide provided with the kit. The slides were washed in distilled water, were boiled for 15 min in target retrieval reagent and were left to dry overnight at room temperature. Protease III was added to each section and incubated at 40°C for 15 min. The slides were washed with distilled water and the probe mix (Vegfα and Aif1 or Tlr4 and Aif1 or Vegfα and Glul) was added to each section and incubated for 2 h at 40°C. Signal amplification and color detection were performed with serial incubations in different amplification buffers, followed by signal detection buffers provided with the kit. Horse radish peroxidase (HRP)-red and alkaline phosphatase (AP)-green chromogenic substrates were used for sequential signal detection of Vegfα and Aif1, Tlr4 and Aif1, and Vegfα and Glul, respectively. The slides were counterstained with hematoxylin for nuclear labeling, imaged under a 3D Histech Slide Pannoramic Scanner microscope (3D HISTECH, Budapest, Hungary) and analyzed using the CaseViewer 2.3 image analysis software (3D HISTECH, Budapest, Hungary).
Statistics
GraphPad Prism software version 8.0 (San Diego, CA, USA) was used for statistical analysis. Fluorescein leakage measurements are presented as mean ± standard error of the mean (SEM) and were compared between different groups using two-way ANOVA followed by Sidak’s multiple comparison test. The flow cytometry data are presented as mean ± standard deviation (SD) and were analyzed using one-way ANOVA, followed by Tukey’s multiple comparison test. The data in were compared using unpaired t-test. P values <.05 were considered statistically significant. Fold changes were calculated by dividing the value of the treated group by the value of the naïve group.
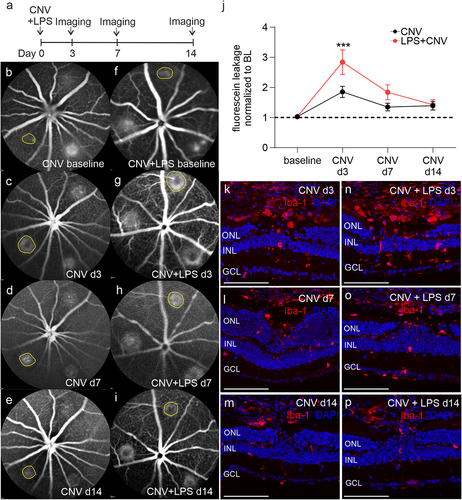
Figure 1. Increased fluorescein leakage and Iba-1 positive cells accumulation in CNV-subjected mice after a systemic LPS challenge. Experimental setup (a) and representative fluorescein angiography (FA) images in CNV-subjected mice (b, c, d, e) and mice that received a single dose of LPS immediately after the CNV induction (f, g, h, i) on the indicated time points post CNV. A single laser spot per FA image is indicated (yellow circle). (j). Comparison of fluorescein leakage areas between the CNV and CNV+LPS groups (***p < .001, 2-way ANOVA followed by Sidak’s multiple comparison test, n = 11 and 9 mice corresponding to 28 and 18 spots for the CNV and the CNV+LPS group, respectively; the results are representative of 2 independent experiments). Immunohistochemical studies against Iba-1 (red) in retinal sections from CNV d3 (k), CNV d7 (l), CNV d14 (m) and CNV+LPS d3 (n), CNV+LPS d7 (o) and CNV+LPS d14 (p) mice (n = 3 mice per condition). DAPI (blue) was used for nuclear staining. GCL, ganglion cell layer; INL, inner nuclear layer; ONL, outer nuclear layer. Scale bars: 200 μm.
Results
Systemic LPS challenge immediately after CNV leads to larger fluorescein leakage areas
Fluorescein leakage was evident immediately after the laser-induced disruption of the Bruch’s membrane ( f). A 1.83-fold increase in fluorescein leakage areas was observed from baseline to CNV d3 ( c, j). At later time points, fluorescein leakage area was decreased to 1.32-fold and 1.36-fold of baseline levels on CNV d7 and CNV d14, respectively (, e, j). In the CNV+LPS d3 group fluorescein leakage areas were significantly higher compared to the CNV d3 group (2.81-fold increase compared to baseline), while no statistically significant difference was observed in CNV+LPS d7 (1.81-fold increase compared to baseline) (). On d14 fluorescein leakage areas were comparable between the CNV and the CNV+LPS group (, i, jj). In mice that received an intravenous injection of LPS 1 week before the CNV induction fluorescein leakage areas were statistically smaller compared to the CNV group in all time points examined, in agreement with previous studiesCitation26 (Supplementary Figure 1).
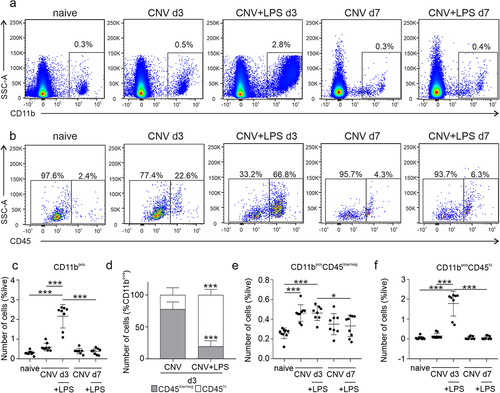
Figure 2. Flow cytometry analysis of microglia/macrophages population in the retina of CNV ± LPS challenged mice. (a) Live single cells were gated based on the expression of CD11b. (b) CD11bpos cells were further gated as CD11bposCD45low and CD11bposCD45hi, representing microglia and monocyte-derived macrophages, respectively. (c) Quantification of CD11bpos cells (***p < .001; one-way ANOVA followed by Tukey’s post-hoc analysis). (d) Percentages of CD45low and CD45hi cells in the total CD11bpos cells population (***p < .001 compared to CNV; unpaired t-test). Quantification of CD11bposCD45low/neg cells (e) and CD11bposCD45hi cells (f), expressed as a presentence of the total live cell population in the sample (e: *p = .029 and ***p < .001; f: ***p < .001; one-way ANOVA followed by Tukey’s post-hoc analysis). The results are representative of 3 independent experiments (n = 10 naïve, n = 9 CNV d3, n = 8 CNV+LPS d3, n = 8 CNV d7, n = 9 CNV+LPS d7).
Iba-1 positive cells accumulate in the laser lesions on CNV d3
Immunohistochemistry against the microglia/macrophage marker Iba-1 revealed accumulation of Iba-1 positive cells in the lesion site of the CNV d3 and CNV+LPS d3 groups, whilst in the CNV+LPS d3 more Iba-1 positive signal was detected compared to the CNV d3 group (). On CNV d7 and CNV d14 less Iba-1 positive cells was detected around the laser lesion compared to d3, irrespective of LPS challenge (). In order to quantify the numbers of microglia and macrophages in the whole retina of the different experimental groups, we performed flow cytometry analysis.
Effect of LPS on microglia/macrophages dynamics during CNV – Flow cytometry analysis
Flow cytometry was performed according to the gating strategy illustrated in Supplementary Figure 2. After selection of single and live FITC negative (FITCneg) cells, cells were gated for the expression of CD11b (CD11bpos; ), an integrin known to be expressed in monocytes, macrophages, and microglia.Citation29 To distinguish between microglia and monocyte-derived macrophages, the CD11bpos cells were further gated for the lymphocyte common antigen CD45, which is expressed in high levels by monocyte-derived macrophages (CD11bposCD45hi; ) and low to intermediate levels by adult microglia (CD11bposCD45low/neg; ).Citation30 On CNV d3, CD11bpos cells were increased by 2.0-fold compared to naïve retinas but no statistical difference was detected between the 2 groups (). The LPS challenge led to a further 7.2-fold increase of CD11bpos cells compared to naïve, which was significantly higher from the CNV d3 group ( ). No significant changes were detected on d7 (). The composition of the CD11bpos cell population differed between the CNV d3 and the CNV+LPS d3 groups. Specifically, 77.8% of CD11bpos cells in the CNV d3 group were CD11bposCD45low/neg and 22.2% were CD11bposCD45hi. Intriguingly, in the presence of LPS the majority of CD11bpos cells were CD11bposCD45hi (80.5%) and only 19.5% were CD11bposCD45low/neg (). However, the number of microglia cells, expressed as a percentage of the total cell population in the samples, was comparable between the CNV d3 and the CNV+LPS d3 groups (1.8-fold increase compared to naive for both groups), indicating that a single LPS challenge does not affect the total number of retinal microglia cells compared to the CNV group (). No statistically significant differences on the number of microglia cells compared to naïve were observed on CNV d7 or CNV+LPS d7 (). Contrariwise, LPS led to a 33.6-fold increase of monocytes/macrophages on d3, which was significantly higher from the CNV d3 retinas, where an increase of 2.9-fold compared to naïve was detected (). No differences were observed at the later time point of d7 ().
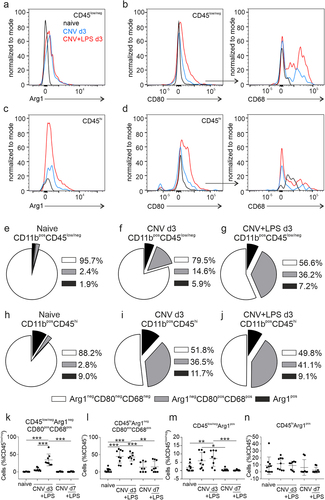
CD11bposCD45low/neg microglia and CD11bposCD45hi macrophages were subsequently gated for the expression of Arg1 - one of the best characterized markers of anti-inflammatory microglia/macrophagesCitation31 - as Arg1 negative (Arg1neg) and Arg1 positive (Arg1pos) populations. In the Arg1neg population, CD80 positive cells (CD80pos) were identified and further gated as CD68 positive cells (CD68pos; Supplementary Figure 2). Upregulation of CD80 and CD68 is indicative of a pro-inflammatory phenotype: the costimulatory molecule CD80 is upregulated by antigen presenting cells in response to inflammation and CD68 is expressed in the lysosomal membranes of microglia and monocytes/macrophages and its upregulation denotes actively phagocytic cells.Citation32,Citation33 The fluorescence intensity of the activation markers Arg1, CD80 and CD68 by microglia and macrophages were increased in the CNV ± LPS d3 groups compared to naïve (, e). The composition of microglia (CD11bposCD45low/neg) and monocyte-derived macrophages (CD11bposCD45hi) in the naïve retinas and the different experimental groups on d3 is illustrated in pie charts in . In the naïve groups a very small portion of microglia and macrophages expressed the activations markers Arg1 or CD80 and CD68 (). In the CNV d3 group, 14.6% of microglia and 36.5% of macrophages expressed both CD68 and CD80, while 5.9% of microglia and 11.7% of macrophages were Arg1pos (). In the CNV+LPS d3 group these percentages were 36.2% and 41.1%, for CD68posCD80pos microglia and macrophages, respectively and 7.2% and 9.1%, for Arg1pos microglia and macrophages, respectively (). The data used for the creation of pie charts are shown as bar graphs in . CNV d3 significantly increased the percentage of pro-inflammatory macrophages compared to naïve, but no significant changes in the percentage of pro-inflammatory microglia were detected, even if a 12.7-fold increase was noticed (). LPS on the other hand, led to a significant increase in the percentage of pro-inflammatory microglia and macrophages as well as Argpos microglia (). Statistically significant changes between the CNV d3 and the CNV+LPS d3 groups were only detected in the percentages of CD80posCD68pos microglia cells, where LPS increased the polarization of microglia towards a pro-inflammatory phenotype (). No differences were observed between the two groups (CNV d3 and CNV+LPS d3) on the percentage of CD80posCD68pos macrophages () and no significant changes were observed on d7.
Figure 3. Expression of activation markers by microglia and monocyte-derived macrophages on CNV ± LPS d3. Representative overlaid histograms of the Arg1 signal of CD11bposCD45low (a) and CD11bposCD45hi (c) populations in the naïve group and the CNV and CNV+LPS d3 groups. Representative overlaid histograms of the CD80 signal expressed by CD11bposCD45lowArg1neg (b, left panel) and by CD11bposCD45hiArg1neg cells (d, left panel) and of the CD68 signal expressed by CD11bposCD45lowArg1negCD80pos (b, right panel) and CD11bposCD45hiArg1negCD80pos cells (d, right panel) in the different experimental groups. Pie charts showing the composition of microglia and macrophages in the different experimental groups. The percentages of Arg1negCD80negCD68neg, Arg1negCD80posCD68pos and Arg1pos cells in the total population of CD11bposCD45low/neg microglia (e, f, g for naïve, CNV d3 and CNV+LPS d3, respectively) and CD11bposCD45hi monocyte-derived macrophages (h, i, j for naïve, CNV d3 and CNV+LPS d3, respectively) are shown. The statistical analysis of the data used for the creation of the pie charts are presented in k, l, m and n (k: ***p < .001; l: **p = .002, ***p < .001; m: *p = .011, **p = .010, ***p < .001; one-way ANOVA followed by Tukey’s post-hoc analysis). The results are representative of 3 independent experiments (n = 10 naïve, n = 9 CNV d3, n = 8 CNV+LPS d3, n = 8 CNV d7, n = 9 CNV+LPS d7).
Effect of LPS on Vegfα and Tlr4 expression during the acute phase of CNV
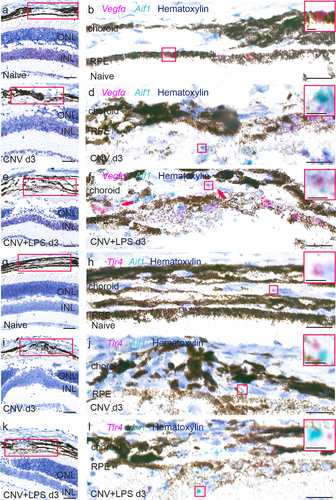
The role of VEGF-A in CNV formation has been well documented in the past,Citation34 whilst LPS-induced upregulation of VEGF-A and TLR4 in monocytes has been previously reported.Citation35,Citation36 Since we found elevated numbers of microglia/macrophages in our CNV ± LPS groups, we aimed to investigate whether the LPS challenge may lead to increased expression of Vegfα and/or Tlr4 mRNA from microglia/macrophages in the acute phase of CNV (CNV d3). In the retina of naïve mice, Vegfα mRNA was mainly found in the inner nuclear layer (INL), the ganglion cell layer (GCL) and the RPE (), in agreement with previous studies.Citation37 In CNV d3, Vegfα mRNA was found in the inner retina as well, and adjacent to the lesion area (). Upregulation of Vegfα mRNA was noticed in the presence of LPS, mainly adjacent to the lesion area, where larger clusters of Vegfα mRNA spots were detected (). In both experimental groups there were areas with close proximity between the Vegfα and the Aif1 staining, suggesting Vegfα expression by Iba-1 positive cells in the CNV area (arrows and inserts in ). However, the majority of Vegfα mRNA signal was not co-localized with Aif1 suggesting that microglia/macrophages are not the main source of Vegfα upregulation caused by the LPS challenge. Tlr4 mRNA was detected mainly in the inner retinaCitation38 and only a few positive spots were detected in the choroid of naïve mice (), while no notable upregulation was observed in the CNV or CNV+LPS groups (). However, areas with close proximity between the Tlr4 and the Aif1 expression were also detected ().
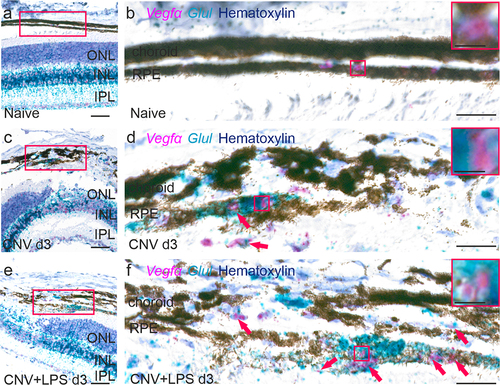
Figure 4. Expression of Vegfα, Aif1 and Tlr4 mRNA in the retinas of CNV ± LPS-challenged mice. Representative BaseScope images of Vegfα and Aif1 mRNA expression in naïve (a, b), CNV d3 (c, d) and CNV+LPS d3 (e, f) mice (n = 3 mice per condition). Higher magnification images of red squares in A, C and E are shown in B, D and F, respectively. Red squares in B, D, F are magnified in inserts. Representative BaseScope images of Tlr4 and Aif1 mRNA expression in naïve (g, h), CNV d3 (i, j) and CNV+LPS d3 (k, l) mice. Higher magnification images of red squares in G, I and K are shown in H, J and L, respectively. Red squares in Η, J and L are magnified in inserts. Red arrows indicate close proximity between Vegfα and Aif1 mRNA expression. INL, inner nuclear layer; ONL, outer nuclear layer; RPE, retinal pigment epithelium. Scale bars: 100 μm (A, C, E, G, I, K) 20 μm (B, D, F, H, J, L) and 5 μm (inserts).
Effect of LPS on Vegfα expression from Glul-expressing cells during the acute phase of CNV
Müller cells are an important source of VEGF-A in ocular neovascularization modelsCitation37,Citation39 and genetic depletion of Müller cell–derived VEGF-A, using conditional knockout mice, reduces retinal neovascularization in a murine diabetes model.Citation40 Since Glul is mainly expressed by Müller cells and astrocytes in the mouse retina,Citation41 we used a Glul and Vegfα mRNA probes to investigate whether LPS leads to upregulation of Vegfα expression by glial cells. In naïve mice, Glul was detected throughout the entire retinal thickness as well as in the RPE and choroid (). In the CNV d3 group, enhanced Glul expression was detected in the choroid-RPE in the lesion area and in close proximity with Vegfα expression (). In the CNV+LPS d3 group Glul expression was further upregulated in the lesion area and adjacent expression of Glul and Vegfα mRNA was more pronounced (), indicating increased Vegfα expression by Glul positive cells.
Figure 5. Expression of Vegfα and Glul mRNA in the retinas of CNV ± LPS-challenged mice. Representative BaseScope images of Vegfα and Glul mRNA expression in naïve (a, b), CNV d3 (c, d) and CNV+LPS d3 (e, f) mice (n = 3 mice per condition). Higher magnification images of red squares in A, C and E are shown in B, D and F, respectively. Red squares in B, D, F are magnified in inserts. Red arrows indicate close proximity between Vegfα and Glul mRNA expression. INL, inner nuclear layer; IPL, inner plexiform layer; ONL, outer nuclear layer; RPE, retinal pigment epithelium. Scale bars: 100 μm (A, C, E) 20 μm (B, D, F) and 5 μm (inserts).
Discussion
Microglia and monocyte-derived macrophages are key constituents of the inflammatory response. We have previously shown that when suppressing the inflammatory responses, through inhibition of the colony stimulation factor-1 receptor (CSF1R), increased involution of CNV is observed in mice.Citation6 In support to that study, we show here that enhancement of the inflammatory response by systemic LPS exposure immediately after CNV, through shifting of microglia to a pro-inflammatory phenotype and large influx of pro-inflammatory macrophages from the periphery into the retina () correlates with exacerbation of fluorescein leakage () and increase of Vegfα mRNA expression by Glul-expressing cells adjacent to the CNV lesion () at the earliest time point examined.
Exacerbation of CNV through intravitreal LPS injection 1 day before laser photocoagulation has been previously reported in rats.Citation42 Specifically, it has been shown that LPS, through TLR4 activation, upregulates the expression of CXC chemokine receptors 4 and 7 (CXCR4 and CXCR7) in choroid-retinal endothelial cells and this contributes to increased CNV lesions. Systemic administration of LPS can also elicit inflammatory responses in the retina (and the central nervous system in general), can worsen retinal pathology,Citation10,Citation25 and it has been associated with abnormal vascular development and retinal dysfunction.Citation43 However, previous studies reported that intraperitoneal injection of low-dose LPS before the CNV induction reduced the CNV size via induction of IL-10 production from macrophages.Citation26 We also observed reduction of fluorescein leakage when LPS was administered 1 week before the CNV damage (Supplementary Figure 1). Likewise, LPS pre-conditioning afforded protection in retinal ischemia models.Citation44,Citation45 In a murine model of middle cerebral artery occlusion (MCAO), a single LPS exposure 2 days before MCAO resulted in reduced activation of brain microglia, reduced infiltration of immune cells from the periphery and reduced activation of immune cells in the blood, and these effects were correlated with neuroprotection.Citation46 We speculate that LPS exposure before the induction of CNV renders retinal microglia/macrophages and blood monocytes hypo-responsive to activation by subsequent CNV. Given the role of these cells in inflammation and their involvement in CNVCitation6,Citation47,Citation48 we assume that this hypo-responsiveness of immune cells to the CNV damage accounts for the beneficial effects of LPS pre-conditioning. On the other hand, LPS exposure immediately after the lesion seems to enhance the inflammatory response.
The increased numbers of microglia and monocyte-derived macrophages that we observed during the early course of CNV are in agreement with previous studies. For instance, histology in postmortem retinas of AMD patients revealed the presence of monocyte-derived macrophages in the sub-retinal space,Citation49 and infiltration of monocyte-derived macrophages into the retina has been also shown in a murine CNV model.Citation4 Indeed, experiments using depletion of circulating monocytes or blockade of their recruitment into the retina via genetic depletion of chemokine (C–C motif) ligand 2 (Ccl2) or its receptor (Ccr2), revealed the important role of monocyte-derived macrophages in CNV formation.Citation47,Citation48,Citation50 However, other studies have shown that microglia are the dominant population of immune cells in the sub-retinal space in different murine retinal degeneration models, where they act by restricting rather than hastening disease progression.Citation51 Our flow cytometry data show that during CNV, microglia are indeed the dominant population of immune cells in the retina (). Importantly, the LPS challenge changes the equilibrium towards a monocyte-derived cells dominance through the large infiltration of pro-inflammatory monocyte-derived macrophages. Rather unexpectedly, we observed that LPS did not alter the population of microglia cells compared to the CNV group, suggesting that it did not influence microglia proliferation. We have previously shown that four daily intravenous injections of 1 mg/kg LPS lead to increased numbers of microglia in the retina of Balb/c mice,Citation25 while an older study, employing a brain injury model, suggested that four daily intraperitoneal LPS challenges failed to trigger microglia proliferation in the brain.Citation52 More recent studies have shown that a single intraperitoneal injection of 100 μg/kg, 1 mg/kg, or 5 mg/kg LPS leads to microglia proliferation in the brain.Citation53,Citation54 Thus, the LPS treatment regimen and the disease model that is used in each individual study, may be important factors determining variability in experimental outcomes.
Additionally, we found a higher percentage of CD80posCD68pos microglia in the retina after the LPS challenge compared to the CNV d3 group (). LPS is known to trigger activation of microglia/macrophages towards a pro-inflammatory phenotype both in vitro and in vivo (for a recent review see,Citation55) but anti-inflammatory macrophages are thought to have a more important role in angiogenesis and neovascularization.Citation56,Citation57 For instance, a previous study reported that injection of anti-inflammatory CD206pos bone marrow-derived macrophages into the vitreous of CNV-subjected mice increased CNV lesions, while injection of pro-inflammatory CD80pos macrophages reduced CNV lesions.Citation58 Here, we found a moderate increase of Arg1pos microglia in the CNV+LPS d3 group, which however was much lower compared to the increase observed in CD80posCD68pos cells (). These data suggest that systemic LPS triggers the polarization of microglia towards a dominant pro-inflammatory phenotype and in the same time leads to a large influx of pro-inflammatory monocyte-derived macrophages, whilst these events correlate with exacerbation of the CNV leakage areas.
CD80pos macrophages were able to produce VEGF-A during early degeneration before the onset of neovascularization in a bone regeneration mouse model, while CD80neg macrophages failed to do so.Citation59 According to other studies, pro-inflammatory macrophages produce not only several pro-inflammatory cytokines but VEGF-A as well,Citation60,Citation61 whilst LPS can trigger production of VEGF-A in the eye after intravitreal injection. Moreover, a recent study suggested that co-inhibition of placental growth factor (PGF) and VEGF-A was effective in reducing vascular leakage through reduction of PGF and VEGF-A expression from Iba-1 positive cells.Citation62 Here, we did detect higher expression of Vegfα mRNA in the lesion area upon the LPS challenge, but we did not observe any apparent alterations in Vegfα expressed from Aif1 positive microglia/macrophages (). However, we did detect enhanced adjacent expression of Vegfα and Glul in the CNV+LPS d3 group, suggesting that Glul-expressing cells upregulate Vegfα expression after the LPS challenge (). Glul is mainly expressed by Müller cells and astrocytes in the retina,Citation63,Citation64 but Glul expression from RPE cells and from melanocytes, macrophages, fibroblasts, and mast cells in the choroid has been also reported.Citation65 Bi-directional interaction between activated microglia/macrophages and Müller cells, in response to retinal injury, has been suggested to elevate the initial inflammatory responseCitation4,Citation7,Citation66 whilst, upregulation of Vegfα mRNA in RPE cells leads to microglia recruitment towards the RPE.Citation67 We speculate that LPS contributes to exacerbation of fluorescein leakage during early CNV, by the transient increase of pro-inflammatory microglia/macrophages, which leads to upregulation of Vegfα expression by Müller and RPE cells, and this would be in agreement with previous in vitro studies.Citation68 However, the involvement of other Glul-expressing cells, such as melanocytes, fibroblasts, and choroidal macrophages cannot be excluded.
Taken together, the present study demonstrates the transient detrimental effects of systemic LPS exposure immediately after CNV induction in mice and highlights its different effect on microglia and monocyte-derived macrophage populations in the retina. Importantly, a single dose of LPS immediately after the laser lesion leads to increased influx of pro-inflammatory monocyte-derived macrophages into the lesion area as well as upregulation of Vegfα expression by Glul-expressing but not Aif1 positive cells. On the other hand, microglia participate in the immune response by shifting to a pro-inflammatory activation status without proliferating. Thus, in contrast to the common assumption that pro-inflammatory macrophages inhibit CNV development, while anti-inflammatory macrophages increase it,Citation57,Citation58,Citation69 our study shows that an enhancement of pro-inflammatory microglia/macrophages status by LPS correlates with larger CNV leakage areas in the early onset of the disease. Whether and how these immune cells participate in LPS-induced Vegfα upregulation and increased fluorescein leakage remains to be investigated and more studies are needed to elucidate the effect of chronic inflammation in the course of CNV.
Supplemental Material
Download Zip (923.7 KB)Acknowledgments
The authors would like to thank the Department for BioMedical Research (DBMR) of the University of Bern for the facilities and scientific and technical assistance.
Disclosure statement
I.T., Boehringer Ingelheim (F); B.S., None; P.E., Novartis Pharma Schweiz (C); M.S.Z.,Bayer (F, C), Heidelberg Engineering (S), Novartis (C, I), Boehringer Ingelheim (F); P.M.B., Boehringer Ingelheim (E); D. K., Boehringer Ingelheim (F).
Supplementary material
Supplemental data for this article can be accessed online at https://doi.org/10.1080/09273948.2022.2147547
Additional information
Funding
References
- Ambati J, Atkinson JP, Gelfand BD. Immunology of age-related macular degeneration. Nat Rev Immunol. 2013 Jun;13(6):438–451. doi:10.1038/nri3459.
- Rubsam A, Parikh S, Fort PE. Role of inflammation in diabetic retinopathy. Int J Mol Sci. 2018 Mar 22;19(4):942. doi:10.3390/ijms19040942.
- Crespo-Garcia S, Reichhart N, Hernandez-Matas C, et al. In vivo analysis of the time and spatial activation pattern of microglia in the retina following laser-induced choroidal neovascularization. Exp Eye Res. 2015 Oct;139:13–21. doi:10.1016/j.exer.2015.07.012.
- Caicedo A, Espinosa-Heidmann DG, Pina Y, Hernandez EP, Cousins SW. Blood-derived macrophages infiltrate the retina and activate Muller glial cells under experimental choroidal neovascularization. Exp Eye Res. 2005 Jul;81(1):38–47. doi:10.1016/j.exer.2005.01.013.
- Karlstetter M, Kopatz J, Aslanidis A, et al. Polysialic acid blocks mononuclear phagocyte reactivity, inhibits complement activation, and protects from vascular damage in the retina. EMBO Mol Med. 2017 Feb;9(2):154–166. doi:10.15252/emmm.201606627.
- Schwarzer P, Kokona D, Ebneter A, Zinkernagel MS. Effect of inhibition of colony-stimulating factor 1 receptor on choroidal neovascularization in mice. Am J Pathol. 2020 Feb;190(2):412–425. doi:10.1016/j.ajpath.2019.10.011.
- Di Pierdomenico J, Martinez-Vacas A, Hernandez-Munoz D, et al. Coordinated intervention of microglial and muller cells in light-induced retinal degeneration. Invest Ophthalmol Vis Sci. 2020 Mar 9;61(3):47. doi: 10.1167/iovs.61.3.47.
- Combrinck MI, Perry VH, Cunningham C. Peripheral infection evokes exaggerated sickness behaviour in pre-clinical murine prion disease. Neuroscience. 2002;112(1):7–11. doi:10.1016/s0306-4522(02)00030-1.
- Sly LM, Krzesicki RF, Brashler JR, et al. Endogenous brain cytokine mRNA and inflammatory responses to lipopolysaccharide are elevated in the Tg2576 transgenic mouse model of Alzheimer’s disease. Brain Res Bull. 2001 Dec;56(6):581–588. doi:10.1016/s0361-9230(01)00730-4.
- Noailles A, Maneu V, Campello L, Lax P, Cuenca N. Systemic inflammation induced by lipopolysaccharide aggravates inherited retinal dystrophy. Cell Death Dis. 2018 Mar 2;9(3):350. doi:10.1038/s41419-018-0355-x.
- Lassenius MI, Pietilainen KH, Kaartinen K, et al. Bacterial endotoxin activity in human serum is associated with dyslipidemia, insulin resistance, obesity, and chronic inflammation. Diabetes Care. 2011 Aug;34(8):1809–1815. doi:10.2337/dc10-2197.
- Poltorak A, Smirnova I, He X, et al. Genetic and physical mapping of the Lps locus: identification of the toll-4 receptor as a candidate gene in the critical region. Blood Cells Mol Dis. 1998 Sep;24(3):340–355. doi:10.1006/bcmd.1998.0201.
- Klettner A, Roider J. Retinal pigment epithelium expressed toll-like receptors and their potential role in age-related macular degeneration. Int J Mol Sci. 2021 Aug 4;22(16):8387. doi:10.3390/ijms22168387.
- Benoit R, Rowe S, Watkins SC, et al. Pure endotoxin does not pass across the intestinal epithelium in vitro. Shock. 1998 Jul;10(1):43–48. doi:10.1097/00024382-199807000-00008.
- Ostrowski SR, Berg RM, Windelov NA, et al. Coagulopathy, catecholamines, and biomarkers of endothelial damage in experimental human endotoxemia and in patients with severe sepsis: a prospective study. J Crit Care. 2013 Oct;28(5):586–596. doi:10.1016/j.jcrc.2013.04.010.
- Emanuele E, Orsi P, Boso M, et al. Low-grade endotoxemia in patients with severe autism. Neurosci Lett. 2010 Mar 8;471(3):162–165. doi: 10.1016/j.neulet.2010.01.033.
- Zhang R, Miller RG, Gascon R, et al. Circulating endotoxin and systemic immune activation in sporadic amyotrophic lateral sclerosis (sALS). J Neuroimmunol. 2009 Jan 3;206(1–2):121–124. doi: 10.1016/j.jneuroim.2008.09.017.
- Braun-Fahrlander C, Riedler J, Herz U, et al. Environmental exposure to endotoxin and its relation to asthma in school-age children. N Engl J Med. 2002 Sep 19;347(12):869–877. doi: 10.1056/NEJMoa020057.
- Qin X, Zou H. The role of lipopolysaccharides in diabetic retinopathy. BMC Ophthalmol. 2022 Feb 22;22(1):86. doi:10.1186/s12886-022-02296-z.
- Kolodjaschna J, Berisha F, Lasta M, Polska E, Fuchsjager-Mayrl G, Schmetterer L. Reactivity of retinal blood flow to 100% oxygen breathing after lipopolysaccharide administration in healthy subjects. Exp Eye Res. 2008 Aug;87(2):131–136. doi:10.1016/j.exer.2008.05.006.
- Grant MB, Bernstein PS, Boesze-Battaglia K, et al. Inside out: relations between the microbiome, nutrition, and eye health. Exp Eye Res. 2022 Aug 27;224:109216. doi:10.1016/j.exer.2022.109216.
- Zysset-Burri DC, Keller I, Berger LE, et al. Associations of the intestinal microbiome with the complement system in neovascular age-related macular degeneration. NPJ Genom Med. 2020;5:34. doi:10.1038/s41525-020-00141-0.
- Ryan SJ. The development of an experimental model of subretinal neovascularization in disciform macular degeneration. Trans Am Ophthalmol Soc. 1979;77:707–745.
- Tobe T, Ortega S, Luna JD, et al. Targeted disruption of the FGF2 gene does not prevent choroidal neovascularization in a murine model. Am J Pathol. 1998 Nov;153(5):1641–1646. doi:10.1016/S0002-9440(10)65753-7.
- Kokona D, Ebneter A, Escher P, Zinkernagel MS. Colony-stimulating factor 1 receptor inhibition prevents disruption of the blood-retina barrier during chronic inflammation. J Neuroinflammation. 2018 Dec 12;15(1):340. doi:10.1186/s12974-018-1373-4.
- Matsumura N, Kamei M, Tsujikawa M, Suzuki M, Xie P, Nishida K. Low-dose lipopolysaccharide pretreatment suppresses choroidal neovascularization via IL-10 induction. PLoS One. 2012;7(7):e39890. doi:10.1371/journal.pone.0039890.
- Tsioti, I, Liu X, Schwarzer P, Zinkernagel MS, Kokona D. Multimodal imaging of experimental choroidal neovascularization. Int J Ophthalmol. 2022;15(6):886–893. doi:10.18240/ijo.2022.06.05.
- Ebneter A, Kokona D, Schneider N, Zinkernagel MS. Microglia activation and recruitment of circulating macrophages during ischemic experimental branch retinal vein occlusion. Invest Ophthalmol Vis Sci. 2017 Feb 1;58(2):944–953. doi:10.1167/iovs.16-20474.
- Grabert K, Michoel T, Karavolos MH, et al. Microglial brain region-dependent diversity and selective regional sensitivities to aging. Nat Neurosci. 2016 Mar;19(3):504–516. doi:10.1038/nn.4222.
- O’Koren EG, Mathew R, Saban DR. Fate mapping reveals that microglia and recruited monocyte-derived macrophages are definitively distinguishable by phenotype in the retina. Sci Rep. 2016 Feb 9;6:20636. doi:10.1038/srep20636.
- Munder M, Eichmann K, Moran JM, Centeno F, Soler G, Modolell M. Th1/Th2-regulated expression of arginase isoforms in murine macrophages and dendritic cells.J Immunol.1999 Oct 1;163(7):3771–3777.
- Salomon B, Bluestone JA. Complexities of CD28/B7: CTLA-4 costimulatory pathways in autoimmunity and transplantation. Annu Rev Immunol. 2001;19:225–252. doi:10.1146/annurev.immunol.19.1.225.
- Zotova E, Bharambe V, Cheaveau M, et al. Inflammatory components in human Alzheimer’s disease and after active amyloid-beta42 immunization. Brain. 2013 Sep;136(Pt 9):2677–2696. doi:10.1093/brain/awt210.
- Spilsbury K, Garrett KL, Shen WY, Constable IJ, Rakoczy PE. Overexpression of vascular endothelial growth factor (VEGF) in the retinal pigment epithelium leads to the development of choroidal neovascularization. Am J Pathol. 2000 Jul;157(1):135–144. doi:10.1016/S0002-9440(10)64525-7.
- Earle KA, Zitouni K, Nourooz-Zadeh J. Lipopolysaccharide-induced VEGF production and ambient oxidative stress in Type 2 diabetes. J Clin Endocrinol Metab. 2019 Jan 1;104(1):1–6. doi:10.1210/jc.2018-00836.
- Wan J, Shan Y, Fan Y, et al. NF-kappaB inhibition attenuates LPS-induced TLR4 activation in monocyte cells. Mol Med Rep. 2016 Nov;14(5):4505–4510. doi:10.3892/mmr.2016.5825.
- Pierce EA, Avery RL, Foley ED, Aiello LP, Smith LE. Vascular endothelial growth factor/vascular permeability factor expression in a mouse model of retinal neovascularization. Proc Natl Acad Sci U S A. 1995 Jan 31;92(3):905–909. doi:10.1073/pnas.92.3.905.
- Semba K, Namekata K, Guo X, Harada C, Harada T, Mitamura Y. Renin-angiotensin system regulates neurodegeneration in a mouse model of normal tension glaucoma. Cell Death Dis. 2014 Jul 17;5:e1333. doi:10.1038/cddis.2014.296.
- Rodrigues M, Xin X, Jee K, et al. VEGF secreted by hypoxic muller cells induces MMP-2 expression and activity in endothelial cells to promote retinal neovascularization in proliferative diabetic retinopathy. Diabetes. 2013 Nov;62(11):3863–3873. doi:10.2337/db13-0014.
- Wang J, Xu X, Elliott MH, Zhu M, Le YZ. Muller cell-derived VEGF is essential for diabetes-induced retinal inflammation and vascular leakage. Diabetes. 2010 Sep;59(9):2297–2305. doi:10.2337/db09-1420.
- Chang ML, Wu CH, Jiang-Shieh YF, Shieh JY, Wen CY. Reactive changes of retinal astrocytes and Muller glial cells in kainate-induced neuroexcitotoxicity. J Anat. 2007 Jan;210(1):54–65. doi:10.1111/j.1469-7580.2006.00671.x.
- Feng YF, Guo H, Yuan F, Shen MQ, Mohanraj R. Lipopolysaccharide promotes choroidal neovascularization by up-regulation of CXCR4 and CXCR7 expression in choroid endothelial cell. PLoS One. 2015;10(8):e0136175. doi:10.1371/journal.pone.0136175.
- Tremblay S, Miloudi K, Chaychi S, et al. Systemic inflammation perturbs developmental retinal angiogenesis and neuroretinal function. Invest Ophthalmol Vis Sci. 2013 Dec 17;54(13):8125–8139. doi: 10.1167/iovs.13-12496.
- Franco PJ, Fernandez DC, Sande PH, et al. Effect of bacterial lipopolysaccharide on ischemic damage in the rat retina. Invest Ophthalmol Vis Sci. 2008 Oct;49(10):4604–4612. doi:10.1167/iovs.08-2054.
- Halder SK, Matsunaga H, Ishii KJ, Akira S, Miyake K, Ueda H. Retinal cell type-specific prevention of ischemia-induced damages by LPS-TLR4 signaling through microglia. J Neurochem. 2013 Jul;126(2):243–260. doi:10.1111/jnc.12262.
- Rosenzweig HL, Lessov NS, Henshall DC, Minami M, Simon RP, Stenzel-Poore MP. Endotoxin preconditioning prevents cellular inflammatory response during ischemic neuroprotection in mice. Stroke. 2004 Nov;35(11):2576–2581. doi:10.1161/01.STR.0000143450.04438.ae.
- Sakurai E, Anand A, Ambati BK, van Rooijen N, Ambati J. Macrophage depletion inhibits experimental choroidal neovascularization. Invest Ophthalmol Vis Sci. 2003 Aug;44(8):3578–3585. doi:10.1167/iovs.03-0097.
- Tsutsumi C, Sonoda KH, Egashira K, et al. The critical role of ocular-infiltrating macrophages in the development of choroidal neovascularization. J Leukoc Biol. 2003 Jul;74(1):25–32. doi:10.1189/jlb.0902436.
- Sennlaub F, Auvynet C, Calippe B, et al. CCR2(+) monocytes infiltrate atrophic lesions in age-related macular disease and mediate photoreceptor degeneration in experimental subretinal inflammation in Cx3cr1 deficient mice. EMBO Mol Med. 2013 Nov;5(11):1775–1793. doi:10.1002/emmm.201302692.
- Robbie SJ, Georgiadis A, Barker SE, et al. Enhanced Ccl2-Ccr2 signaling drives more severe choroidal neovascularization with aging. Neurobiol Aging. 2016 Apr;40:110–119. doi:10.1016/j.neurobiolaging.2015.12.019.
- Yu C, Roubeix C, Sennlaub F, Saban DR. Microglia versus monocytes: distinct roles in degenerative diseases of the retina. Trends Neurosci. 2020 Jun;43(6):433–449. doi:10.1016/j.tins.2020.03.012.
- Chen Z, Jalabi W, Shpargel KB, et al. Lipopolysaccharide-induced microglial activation and neuroprotection against experimental brain injury is independent of hematogenous TLR4. J Neurosci. 2012 Aug 22;32(34):11706–11715. doi: 10.1523/JNEUROSCI.0730-12.2012.
- Furube E, Kawai S, Inagaki H, Takagi S, Miyata S. Brain region-dependent heterogeneity and dose-dependent difference in transient microglia population increase during lipopolysaccharide-induced inflammation. Sci Rep. 2018 Feb 2;8(1):2203. doi:10.1038/s41598-018-20643-3.
- Torii K, Takagi S, Yoshimura R, Miyata S. Microglial proliferation attenuates sickness responses in adult mice during endotoxin-induced inflammation. J Neuroimmunol. 2022 Apr 15;365:577832. doi:10.1016/j.jneuroim.2022.577832.
- Orecchioni M, Ghosheh Y, Pramod AB, Ley K. Corrigendum: macrophage polarization: different gene signatures in M1(LPS+) vs. Classically and M2(LPS-) vs. Alternatively activated macrophages. Front Immunol. 2020;11:234. doi:10.3389/fimmu.2020.00234.
- Jetten N, Verbruggen S, Gijbels MJ, Post MJ, De Winther MP, Donners MM. Anti-inflammatory M2, but not pro-inflammatory M1 macrophages promote angiogenesis in vivo. Angiogenesis. 2014 Jan;17(1):109–118. doi:10.1007/s10456-013-9381-6.
- Yang Y, Liu F, Tang M, et al. Macrophage polarization in experimental and clinical choroidal neovascularization. Sci Rep. 2016 Aug 4;6:30933. doi:10.1038/srep30933.
- Zandi S, Nakao S, Chun KH, et al. ROCK-isoform-specific polarization of macrophages associated with age-related macular degeneration. Cell Rep. 2015 Feb 24;10(7):1173–1186. doi: 10.1016/j.celrep.2015.01.050.
- Stefanowski J, Lang A, Rauch A, et al. Spatial distribution of macrophages during callus formation and maturation reveals close crosstalk between macrophages and newly forming vessels. Front Immunol. 2019;10:2588. doi:10.3389/fimmu.2019.02588.
- Zhong B, Du J, Liu F, et al. Activation of the mTOR/HIF-1alpha/VEGF axis promotes M1 macrophage polarization in non-eosinophilic chronic rhinosinusitis with nasal polyps. Allergy. 2022 Feb;77(2):643–646. doi:10.1111/all.15050.
- Spiller KL, Anfang RR, Spiller KJ, et al. The role of macrophage phenotype in vascularization of tissue engineering scaffolds. Biomaterials. 2014 May;35(15):4477–4488. doi:10.1016/j.biomaterials.2014.02.012.
- Balser C, Wolf A, Herb M, Langmann T. Co-inhibition of PGF and VEGF blocks their expression in mononuclear phagocytes and limits neovascularization and leakage in the murine retina. J Neuroinflammation. 2019 Feb 7;16(1):26. doi:10.1186/s12974-019-1419-2.
- Orozco LD, Chen HH, Cox C, et al. Integration of eQTL and a single-cell atlas in the human eye identifies causal genes for age-related macular degeneration. Cell Rep. 2020 Jan 28;30(4):1246–59 e6. doi: 10.1016/j.celrep.2019.12.082.
- Linser PJ, Sorrentino M, Moscona AA. Cellular compartmentalization of carbonic anhydrase-C and glutamine synthetase in developing and mature mouse neural retina. Brain Res. 1984 Mar;315(1):65–71. doi:10.1016/0165-3806(84)90077-4.
- Voigt AP, Mulfaul K, Mullin NK, et al. Single-cell transcriptomics of the human retinal pigment epithelium and choroid in health and macular degeneration. Proc Natl Acad Sci U S A. 2019 Nov 26;116(48):24100–24107. doi: 10.1073/pnas.1914143116.
- Wang M, Ma W, Zhao L, Fariss RN, Wong WT. Adaptive muller cell responses to microglial activation mediate neuroprotection and coordinate inflammation in the retina. J Neuroinflammation. 2011 Dec 7;8:173. doi:10.1186/1742-2094-8-173.
- Jo DH, Yun JH, Cho CS, Kim JH, Kim JH, Cho CH. Interaction between microglia and retinal pigment epithelial cells determines the integrity of outer blood-retinal barrier in diabetic retinopathy. Glia. 2019 Feb;67(2):321–331. doi:10.1002/glia.23542.
- Nurnberg C, Kociok N, Brockmann C, et al. Myeloid cells contribute indirectly to VEGF expression upon hypoxia via activation of muller cells. Exp Eye Res. 2018 Jan;166:56–69. doi:10.1016/j.exer.2017.10.011.
- Wang Y, Chang T, Wu T, et al. M2 macrophages promote vasculogenesis during retinal neovascularization by regulating bone marrow-derived cells via SDF-1/VEGF. Cell Tissue Res. 2020 Jun;380(3):469–486. doi:10.1007/s00441-019-03166-9.