
 ?Mathematical formulae have been encoded as MathML and are displayed in this HTML version using MathJax in order to improve their display. Uncheck the box to turn MathJax off. This feature requires Javascript. Click on a formula to zoom.
ABSTRACT
The Hess and the Harms screen test each have different testing distances. While the Harms screen test is usually performed at 2.5 m, the Hess screen test is performed at 0.5 m. The geometry of the closer testing distance of the Hess screen test requires an increase of the convergence angle by 6°. This study investigates the quantitative differences between the two frequently employed screen tests. Ocular deviation of 18 normal subjects and 36 patients with congenital or acquired paralytic or concomitant strabismus were assessed with a complete orthoptic examination including alternate prism cover testing at near (nPCT) and far (fPCT), as well as Hess and Harms screen testing. One-way ANOVA was used for statistical analysis. The Hess test recorded more overall exodeviation compared to the Harms test for patients (mean difference −3.50°, 95% limits of agreement (CI) = [−4.79, −2.21], p < .001), and controls (mean difference −1.78°, CI = [−2.99, −0.56], p = .004). For vertical deviations, there was no statistically significant difference between the two tests for patients (mean difference +0.75°, CI = [−0.41, +1.91], p = .251), and controls (mean difference −0.28°, CI = [−0.68, −0.11], p = 0.231). This study emphasizes the importance to consider the divergence bias when comparing the Hess to the Harms screen test, which is likely explained by the greater vergence demand dependent on the closer testing distance. The exodeviation shift tended to be more pronounced in patients than controls, which may imply that patients with strabismus have an impaired convergence drive.
Introduction
Screen tests such as the Hess and the Harms test to map ocular deviation for the assessment of patients with double vision are popular in many countries, especially in Europe.Citation1 They are particularly useful in the differential diagnosis of various clinical types of strabismus. The graphical representation helps to identify general patterns including comitant, restrictive, or paralytic strabismus, as well as the affected eye or the affected muscle.Citation2,Citation3
In a healthy subject, driven by sensory and motor fusion, the optical axes are aligned in such a way that both foveae are directed at the viewing target simultaneously, referred to as binocular single vision. Misalignment of one of the foveae, i.e. by strabismus, will induce double vision. On the other hand, offering a different stimulus to each of the foveae separately will lead to superimposition of the two separate images, termed “confusion.” Both the Hess and Harms haploscopic screen tests are based on the principle of confusion, which is induced by color differentiation of the two eyes. Normal retinal correspondence is a prerequisite for such haploscopic screen tests.
Walter Rudolf Hess designed the Hess screen test in 1908.Citation4 By means of color dissociation, the deviation of each eye is plotted on a hyperbolic tangent screen at a viewing distance of 0.5 m. In the modern version, the patient wears complementary red-green glasses that allow each eye to either see the painted red fixation target or the patient-guided red projected laser. The direction of gaze in the absence of fusion at nine positions of gaze is plotted for each eye separately on a hyperbolic tangent screen. The Lees and Lancaster screen are further modifications of Hess’ method.Citation3,Citation5,Citation6
Heinrich Harms described his version of a screen test in 1941.Citation7,Citation8 The test comprises a large rectilinear tangent screen with a central fixation light. The patient wears a helmet that projects a white cross on to the screen, which allows the examiner to precisely move the patient’s head to an eccentric gaze position. With the fixating eye covered by a dark red glass, the patient is asked to capture the central fixation light with a patient-guided green projected circle seen by the non-covered eye. Different from the Hess test, the Harms test is recorded at a far viewing distance of 2.5 m.
Preference as to which screen test to use in the clinical setting varies widely amongst practices and countries. Although both the Hess and Harms screen tests are frequently and sometimes interchangeably employed, little is known about the quantitative comparison of the two methods relative to each other and compared to prism cover testing. This study aims at comparing the results of the different tests in strabismus patients and healthy controls and discussing the clinical significance.
Materials and methods
Subjects
Patients with strabismus of all age groups and healthy controls with no complaint of double vision or asthenopia were enrolled in the study. Exclusion criteria were patients with anomalous retinal correspondence, eccentric fixation, or suppression unable to perform Hess and Harms screen testing, extreme angles of strabismus (>60 prism diopters (PD)), and severe limitation (<15 degrees (°)) of ocular movements. This study was part of a prospective study conducted with approval of the local ethic committee (Zurich, Switzerland).Citation9 Written consent in accordance with the Declaration of Helsinki was obtained from all participants. All subjects underwent complete orthoptic and ophthalmologic examination by the same study team including alternate prism cover testing at near (nPCT) and at far (fPCT), Hess screen testing, and Harms screen testing. For better comparability, as the Hess test is routinely performed without use of correction glasses (impracticability of red-green glasses worn over spectacle correction), all tests were performed without refractive correction except in two subjects as uncorrected visual acuity was to poor. The convergence angle required for the different testing distances was defined as.
Hess screen test
A modern adaptation of the original Hess testCitation4 was used (). The test constitutes of a screen with a red-lined grid. It covers 30° of visual field divided in 5°-steps from the center in each of the four directions of gaze, based on the projection of two non-nested, head-fixed horizontal and vertical rotation axes. Subjects are seated 0.5 m in front of the screen with their head on a chinrest and the forehead leaning on a forehead-rest for best stabilization. Subjects hold a red laser-pointer and wear red-green glasses, which allow them to see the painted red grid only with the green covered eye and the red laser pointer only with the red covered eye in ambient room light. They are asked to point with the red laser pointer at nine specific positions on the grid (i.e. 0 ± 15° horizontally and vertically). Indicated points are noted on a graphical Hess-screen chart by the examiner. After one eye is tested, the same procedure is repeated with the other eye (colors of the glasses are changed to the other eye). The horizontal and vertical difference between the locations of the red light and the target positions on the red grid correspond to the phoria, i.e. the ocular misalignment in the absence of binocular fusion. For the statistical analysis, only the horizontal and vertical deviation in primary position was considered, as this was the only position measured with all the tests being compared here. The Hess data for these subjects have been published previously.Citation9
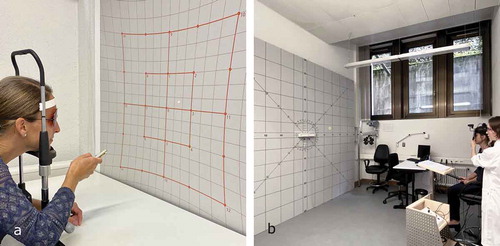
Figure 1. Photographs of (a) Hess test performed at near distance (0.5 m). The right eye (red glass) sees the red laser pointer held by the subject and the left eye (green glass) sees the red grid; (b) of Harms test performed at far distance (2.5 m). The left eye (dark red glass) fixates the center light while the patient is asked to capture it by the green circle seen only with the right, non-covered eye. The examiner aligns the head position guided by the head-mounted projection of a white cross
Harms screen test
A large standard Harms screen test was usedCitation8 (). The Harms screen test constitutes a screen with dimensions of 2.9 m × 2.9 m with a black grid and a white light in the center. Subjects sit 2.5 m from the screen. They wear a helmet with a light projecting a white cross, which allows the examiner to align the head in the center position and consecutively into eight eccentric gaze positions (0 ± 25°). The fixating eye is covered by a dark red glass, and its relative position is measured by asking the patient to capture the central fixation light with a patient-guided green projected circle, which is seen by the non-covered eye in a dark room. The horizontal and vertical eye misalignment is defined by the distance of the subjectively perceived fixation light (pointed at with the green circle) and the center of the Harms tangent screen. The output data are recorded numerically.
Alternating prism cover test
Horizontal and vertical prism bars with increments of 1 PD from 0 to 2 PD, increments of 2 PD from 4 to 20 PD, and increments of 5 PD from 20 to 50 PD were used. 1 PD is defined as . For the nPCT, subjects are asked to look at a fixation target held at 0.3 m distance in primary gaze position. For the fPCT, the fixation target is straight ahead at 5 m. Prisms are held in front of the non-dominant or paralytic eye. While alternately covering one eye with a hand-held occluder preventing a binocularly useful fixation interval, prisms are increased until correction saccades of the eye behind the prism are eliminated. Horizontal and vertical prisms are stacked if both a horizontal and vertical deviation is present. By convention, positive values are assigned to esodeviations (i.e., convergent horizontal deviations), and negative values to exodeviations (i.e., divergent horizontal deviations). For vertical deviations, hyperdeviation of the right eye was assigned a positive value, and hyperdeviation of the left eye was assigned a negative value, respectively.
Data analysis
The results of the Hess and Harms screen tests were digitized using MATLAB software (MATLAB R2019b, 2019, The MathWorks Inc, Natick, MA). For both tests, horizontal and vertical deviation at the center fixation point was determined by the deviation of the eye with the smaller range of movement in incomitant strabismus, corresponding to the primary squint angle. In comitant strabismus, the arithmetic mean of both eyes was calculated. To match the results of the nPCT and fPCT, positive values were assigned to esodeviations and negative values were assigned to exodeviations, respectively. For the current statistical analysis, only the deviation in primary position was considered. A repeated measures one factor ANOVA with multiple comparisons was performed to compare the results of the different tests. In addition, mean differences with 95% limits of agreement were calculated and graphically represented in mean difference plots and folded empirical cumulative distribution plots.Citation10
Results
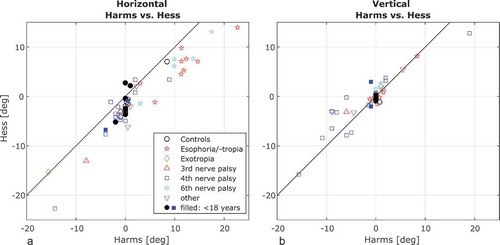
We analyzed 54 subjects (36 strabismus patients, 18 healthy volunteers) aged 6 to 81 years (median, 36 years), with 9 subjects being <18 years. Types of strabismus included congenital or acquired cranial nerve palsies (2 third, 16 fourth, and 5 sixth nerve palsies), comitant strabismus (9 convergent, 1 divergent), and others (1 Miller Fisher syndrome, 1 thyroid eye disease, 1 meningioma with orbital apex syndrome). The Lang stereo acuity test was negative in 11 of the patients, but none of the patients had visual suppression (see exclusion criteria). The horizontal and vertical deviations measured by the Harms and Hess screen test for different types of strabismus are plotted in . As expected, the horizontal measurements are more scattered for horizontal deviations such as esophoria/-tropia and 6th nerve palsy, whereas vertical measurements are more scattered for vertical deviations such as 4th nerve palsy. Most of the normal controls had a small exophoria at near as recorded with the Hess screen test.
Figure 2. Horizontal (a) and vertical (b) deviations are plotted for the Hess and the Harms test for each type of strabismus and normal controls. Subjects <18 years are indicated with a solid marker
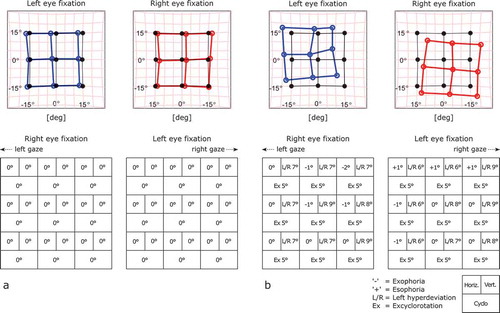
An ANOVA found a significant effect of the type of test on horizontal deviation (F = 32.86; df = 4.212; p < .001). Comparing the results of the two screen tests, there was significantly more overall exodeviation measured by the Hess test compared to the Harms test for both controls (p = .003) and patients (p < .001) (). gives an example of (a) a healthy control with orthophoria in the Harms test and a small exodeviation in the Hess test, and (b) a patient with a fourth nerve palsy where the associated exodeviation is clearly more pronounced in the Hess test. The same near-far incomitance was demonstrated by the exodeviation shift found in the Hess test and the nPCT relative to the fPCT for patients (p < .001 and p < .001), but not for controls (p = .068 and p = .098). Comparing the tests at near (Hess and nPCT), more exodeviation was and measured with the nPCT in patients in controls, although not statistically significant (p = 0.886 and p = 0.076).
Table 1. Results of one-way ANOVA with multiple comparisons for horizontal and vertical deviations
Figure 3. Graphical representations of Hess (top) and Harms screen test (bottom). (a) Shows a small exodeviation shift in the Hess relative to the Harms screen test in a healthy control. (b) Pronounced exodeviation shift in a patient with a congenital fourth nerve palsy
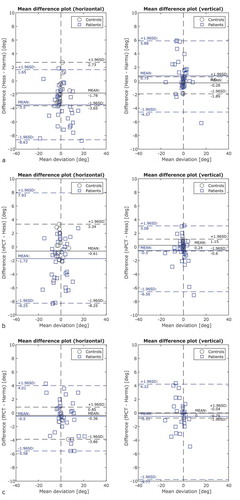
The mean difference plot in illustrates the exodeviation shift of the Hess compared to the Harms test for horizontal deviations. The effect is more pronounced for patients (mean difference −3.46°, 95% limits of agreement [−8.62, +1.64] than for controls (−1.77°, [−3.65, +2.73])). There was no systematic bias for vertical deviations for both patients (+0.75°, [−4.47, +5.88]), and controls (−0.33°, [−1.89, +0.27]). The exodeviation shift is less pronounced comparing nPCT and Hess test (), whereas the mean difference between fPCT and Harms test is close to zero ().
Figure 4. The difference of (a) Hess and Harms, (b) nPCT and Hess, and (c) fPCT and Harms are plotted against the mean of each of the two tests for controls and patients separately. 95% limits of agreement are represented by the upper and lower dotted line, the solid line represents the mean of the differences
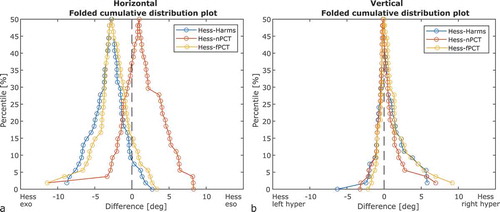
The differences between the Harms, nPCT, and fPCT compared to the Hess test are visualized in folded empirical distribution (mountain) plots,Citation10 where ranked differences are drawn for horizontal () and vertical () deviations. For horizontal deviations, the peaks shifted to the negative x-axis value indicate a similar exodeviation bias for the Hess compared to Harms and fPCT, and the peak shifted to the positive x-axis value indicates a small esodeviation bias for the Hess compared to nPCT. There is more spread of the data for the nPCT as compared to the other tests. For vertical deviations, the peaks were narrower and aligned close to zero.
Figure 5. Graphical representation of ranked differences for both patients and controls with folded cumulative distribution (mountain) plots for horizontal (a) and vertical (b) deviations. The peaks represent the median differences for Hess-Harms (blue), Hess-nPCT (red), and Hess – fPCT (yellow). While for horizontal measurements there is a systematic bias between the tests (exodeviation shift for Harms and fPCT compared to Hess and esodeviation shift for nPCT compared to Hess), vertical measurements are more congruent with the peaks aligned close to zero
Discussion
The Hess and the Harms test both are haploscopic screen tests that are widely used, especially in European countries, to map ocular deviation. In our study, we found a significant exodeviation shift in the Hess test and nPCT compared to the Harms test for horizontal eye position in strabismus patients, that appears related to the nearer viewing distance of both the Hess test and nPCT relative to the Harms test.
An exodeviation shift in the Hess test and nPCT compared to the Harms test was also found for the controls. An exodeviation at near is a relatively frequent finding in healthy subjects and can be symptomatic or asymptomatic.Citation11,Citation12 None of our controls complained of double vision or asthenopic symptoms.
When comparing the Hess test to the nPCT, the latter shows an additional exodeviation shift for patients but not controls, although not statistically significant. Again, this seems mainly related to different testing distances of the Hess test (0.5 m) and nPCT (0.3 m) and possibly to different methods of dissociation (alternate occlusion versus red-green dissociation). Besides, horizontal nPCT measurements appear to have a larger variability than the other tests, as represented by the mountain plots in . Focusing on the near target in the nPCT demands a high degree of patient cooperation and attention, especially in children, and may therefore be prone to measurement errors. In addition, PCT is performed with prism bars which have bigger increments at larger angles (with 5 PD at large angles >20 PD).
Different examination distances in the tests discussed here have an important impact on the vergence demand to maintain binocular alignment.Citation13 The Hess test is performed at 0.5 m, whereas the Harms test is usually performed at 2.5 m. Based on geometrical considerations alone, the closer testing distance necessitates an increase of the convergence angle resulting in an apparent exophoria of about −6°. However, the measured exodeviation shift from the Harms compared to the Hess test was less than that, i.e. −3.50° for patients and −1.78° for normal controls (). This implies that the amount of ocular deviation measured further depends on other factors influencing binocular vision such as the degree of convergence effort as well as method and length of ocular dissociation.Citation1
Overall, the exodeviation shift between Hess and Harms was more pronounced in patients than in controls, which may imply that patients with strabismus have an impaired convergence drive.
While horizontal vergence is subject to considerable variability, vertical vergence amplitudes have narrower limits for physiological reasons, as the fusional demand is much smaller in the vertical compared to the horizontal plane.Citation14,Citation15 This is well represented by the lack of systematic bias between the testing methods for vertical measurements in our data ().
Our statistical analysis was limited to the ocular misalignment at primary position, as secondary and tertiary eye positions were recorded at different angles of eccentricity in the Harms and Hess test. Since vergence demand and thus phoria changes with gaze position,Citation16 assessment of gaze-dependent measurement bias of screen tests would be particularly important in incomitant strabismus. As the Hess test is routinely carried out without refractive correction, we decided that all tests were performed without refractive correction for better comparability (except for two subjects). However, uncorrected refractive errors may affect the accommodative effort and thus the vergence angle especially at near.
This study emphasizes the importance of considering the vergence bias at different examination distances when comparing the Hess screen test and nPCT to the Harms screen test. They cannot be used interchangeably, especially when patient follow-up and treatment decisions rely on quantification of ocular deviation.
Conflicts of interest
The authors declare that they have no conflict of interest.
Acknowledgments
The authors thank Marco Penner for technical support.
Additional information
Funding
References
- von Noorden GK. Binocular Vision and Ocular Motility. 6th ed ed. St. Louis: Mosby; 2002:190–194 p.
- Roper-Hall G. The Hess screen test. Am Orthopt J. 2006;56(1):166–174. doi:10.3368/aoj.56.1.166.
- Roodhooft JM. Screen tests used to map out ocular deviations. Bull Soc Belge Ophtalmol. 2007;(305):57–67.
- Hess Walter R, Hess WR. Ein einfaches messendes Verfahren zur Motilitätsprüfung der Augen. Zeitschrift für Augenheilkunde. 1916;35:201–219.
- Christoff A, Guyton DL. The Lancaster red-green test. Am Orthopt J. 2006;56(1):157–165. doi:10.3368/aoj.56.1.157.
- Timms C. The Lees screen test. Am Orthopt J. 2006;56:180–183. doi:10.3368/aoj.56.1.180.
- Tyedmers M, Roper-Hall G. The harms tangent screen test. Am Orthopt J. 2006;56(1):175–179. doi:10.3368/aoj.56.1.175.
- Harms H. Über die Untersuchung von Augenmuskellähmungen. Albrecht Von Graefes Arch Für Ophthalmol. 1941;144(1):129–149. doi:10.1007/BF01854361.
- Weber KP, Rappoport D, Dysli M, et al. Strabismus measurements with novel video goggles. Ophthalmology. 2017;124(12):1849–1856. doi:10.1016/j.ophtha.2017.06.020.
- Monti KL. Folded empirical distribution function curves—mountain plots. Am Stat. 1995;49:342–345.
- MM-L M, ACH Y, Scheiman M, Chen X. Vergence and accommodative dysfunctions in emmetropic and myopic Chinese young adults. J Ophthalmol, 2019;2019:5904903. https://www.ncbi.nlm.nih.gov/pmc/articles/PMC6664731/. Published July 17, 2019. Accessed November 26, 2019
- Rouse MW, Borsting E, Hyman L, et al. Frequency of convergence insufficiency among fifth and sixth graders. The convergence insufficiency and reading study (CIRS) group. Optom Vis Sci Off Publ Am Acad Optom. 1999;76(9):643–649. doi:10.1097/00006324-199909000-00022.
- Zee DS, Levi L. Neurological aspects of vergence eye movements. Rev Neurol (Paris). 1989;145:613–620.
- Sharma K, Abdul-Rahim AS. Vertical fusion amplitude in normal adults. Am J Ophthalmol. 1992;114(5):636–637. doi:10.1016/S0002-9394(14)74499-X.
- Hara N, Steffen H, Roberts DC, Zee DS. Effect of horizontal vergence on the motor and sensory components of vertical fusion. Invest Ophthalmol Vis Sci. 1998;39:2268–2276.
- Dysli M, Abegg M. Gaze-dependent phoria and vergence adaptation. J Vis. 2016;16(3):2. doi:10.1167/16.3.2.