
ABSTRACT
Purpose: To compare severity of visual field (VF) loss at first presentation in glaucoma clinics in England and Tanzania.
Methods: Large archives of VF records from automated perimetry were used to retrospectively examine vision loss at first presentation in glaucoma clinics in Tanzania (N = 1,502) and England (N = 9,264). Mean deviation (MD) of the worse eye at the first hospital visit was used as an estimate of detectable VF loss severity.
Results: In Tanzania, 44.7% {CI95%: 42.2, 47.2} of patients presented with severe VF loss (< −20 dB), versus 4.6% {4.1, 5.0} in England. If we consider late presentation to also include cases of advanced loss (-12.01 dB to -20 dB), then the proportion of patients presenting late was 58.1% {55.6, 60.6} and 14.0% {13.3, 14.7}, respectively. The proportion of late presentations was greater in Tanzania at all ages, but the difference was particularly pronounced among working-age adults, with 50.3% {46.9, 53.7} of 18–65-year-olds presenting with advanced or severe VF loss, versus 10.2% {9.3, 11.3} in England. In both countries, men were more likely to present late than women.
Conclusions: Late presentation of glaucoma is a problem in England, and an even greater challenge in Tanzania. Possible solutions are discussed, including increased community eye-care, and a more proactive approach to case finding through the use of disruptive new technologies, such as low-cost, portable diagnostic aids.
Introduction
Glaucoma is the third leading cause of blindness worldwide, affecting approximately 3.5% of adults aged 40–80 years old.Citation1 Glaucoma prevalence is even higher in Africa (4.8%), where the number of cases is expected to almost double from 10.3 to 19.1 million people between 2020 and 2040.Citation2 If untreated, glaucoma leads to progressive, irreversible loss of visual function. It is therefore important to detect cases early – or at least to prevent people presenting with advanced loss.
Currently, however, the detection of glaucoma often occurs late. For example, in EnglandCitation3,Citation4,Citation5, CanadaCitation6, and AustraliaCitation7, it is estimated that as many as one in five patients with glaucomatous visual field (VF) loss already has advanced damage in at least one eye by the time they first present to a glaucoma clinic. The problem is likely to be even greater in Sub-Saharan Africa where primary eye care services are more sparsely distributed. For example, a large population-based study in Nigeria found that in 682 people with glaucoma, 94.4% were unaware that they had the condition.Citation8 Furthermore, one in five of these individuals was already blind (visual acuity <3/60 in better eye), with the main cause attributable to glaucoma. Similarly, a prospective study of government-run glaucoma clinics in Botswana found that one in seven individuals was blind at presentation (visual acuity <3/60 in better eye).Citation9 This suggests that not only is glaucoma prevalent in Sub-Saharan Africa, but that the problem is compounded by late presentation. Other studies suggest the problem of late presentation may be even worse. For example, one prominent review of glaucoma in Sub-Saharan Africa estimated that “up to 50% of cases [are] already blind in one eye at presentation”Citation10, and similar figures have been reported in individual studies from across the continent (for a recent summary, see Abdull et al., 2015Citation11)
In many of these previous studies, however, severity at presentation has been characterized by visual acuity alone: a relatively crude measure of glaucomatous sight loss (i.e., which primarily affects peripheral vision). Unlike in Europe and elsewhereCitation3–Citation7, we know of no studies that have conducted a detailed analysis of VF loss at presentation, or which have examined how VF loss varies with age, sex, or in defect pattern. Such quantitative data on late presentation are needed for developing appropriate public health policies and interventions: particularly those targeted at earlier disease detection. There have also been no attempts to directly compare the severity of VF loss at presentation between countries in Sub-Saharan Africa and more affluent nations. A like-for-like comparison would be helpful for understanding the extent to which the late presentation of glaucoma is a particular challenge in Sub-Saharan Africa, versus a more general problem globally.
In the present study, we used retrospective data to compare disease severity, as estimated by VF loss, in patients attending hospital glaucoma clinics in Tanzania and England. Large-scale data from standard automated perimetry (SAP) were extracted from the electronic medical records of routine clinical practices. Only data from patients’ first appointment (and their worse eye) were analyzed, in order to examine the detectable level of glaucomatous VF loss at presentation. The hypothesis was that the proportion of cases detected late (with advanced or severe VF loss) would be greater in Tanzania. We also used demographic data to study associations of age and sex on late presentation.
Methods
Tanzania dataset
VF data were extracted retrospectively from the electronic medical records (2009–2017) of Kilimanjaro Christian Medical Centre’s Department of Ophthalmology: a large referral and training institution in Northern Tanzania. Basic demographic information (sex, age at time of test) were also extracted. Only patients with test data for both eyes and a recorded clinical diagnosis of glaucoma were included. Patients with additional ophthalmic conditions recorded (e.g., pseudophakia or early-cataract) were included in the reported data, but the overall pattern of results was unchanged if these individuals were removed (see Supplemental Material 1).
The raw dataset contained a total of 10,286 VFs, recorded on the Humphrey Visual Field Analyzer (HFA, Carl Zeiss Meditec, Dublin, CA, USA). The study eye for each patient was defined as the eye with the worse (more negative) HFA mean deviation (MD) at the first clinic visit. MD is a summary measure of VF loss, relative to age-similar population norms, with more negative values indicating greater overall VF loss. The worse eye was selected as a surrogate measure of the ‘detectable’ level of glaucomatous VF loss. This yielded 1,502 VFs, each pertaining to the first examination of a single individual (worse eye only).
Data extraction and analysis took place in 2018, and was approved by the Research Ethics Committee of the Kilimanjaro Christian Medical University College.
England dataset
VF data were extracted retrospectively from the Medisoft databases (Medisoft Ltd., Leeds, UK) used in three regional glaucoma clinics (Cheltenham General Hospital Gloucestershire Eye Unit, N = 50,144 examinations; Queen Alexandra Hospital in Portsmouth, N = 31,879 examinations; and The Calderdale and Huddersfield NHS Foundation Trust Hospital, N = 70,955 examinations). These data were recorded between 1989 and 2012, and data extraction took place in 2012 as described previously.Citation12 Recorded clinical diagnoses of glaucoma were not available, so as a proxy (and to remove possible false-positive referrals), patients were only included if they attended three or more appointments at the glaucoma clinic; although, as in the Tanzania dataset, only the data from the very first appointment are reported. This dataset yielded 9,264 records with the same format as the Tanzania dataset (one record per person; worse eye only; first appointment only). Data access was granted by the Caldicott Guardian at each center. Subsequent analyses of the data were approved by a research ethics committee of City, University of London. This study adhered to the Declaration of Helsinki.
VF testing protocol
There were no differences in VF testing protocol between the four testing sites (1 × Tanzania, 3 × England). All sites used the same hardware (Humphrey Visual Field Analyzer), provided the same information to patients prior to testing, and administered the test in accordance with the manufacturer’s recommendations, with a trained technician present throughout. All testing was performed using a Goldmann size III stimulus, a 24–2 test pattern, and the Swedish Interactive Testing Algorithm (SITA Standard or SITA Fast).
Quantifying the severity of detectable sight loss
VF loss in the worse eye, quantified by MD, was used as a measure of detectable sight loss. In accordance with established criteriaCitation13, VF loss was categorized as Early (MD better than −5 dB), Moderate (MD −5.01 to −12 dB), Advanced (MD −12.01 dB to −20 dB), or Severe (MD −20.01 dB or worse). Alternative methods for staging VF loss severity have been developed (e.g., the Enhanced Glaucoma Severity Staging System.Citation14) However, the use of these more complex methods did not change the present findings, so these data are reported in the Supplemental Material only (Supplemental Material 2).
Analysis
Data were analyzed in MATLAB R2016a (The MathWorks, Natick, USA). Severity of VF loss was analyzed by examining distributions of MD (a continuous variable), and also by computing the proportion of individuals falling into each stage of VF loss severity (see previous). Confidence intervals for key statistics were derived using bootstrapping (N = 20,000; bias-corrected and accelerated method). Individual visual fields were plotted for inspection using custom MATLAB software which we have made freely available online (https://github.com/petejonze/VfPlot). Crude Relative Risk ratios were computed to examine the association between late presentation (advanced or severe VF loss) and age, sex, or country. For example, to compute the association with sex, the data were stratified by age (decades) and country (England, Tanzania). Relative Risk was then calculated as the ratio of the proportion of men to the proportion of women presenting with advanced or severe VF loss (<−12 dB). RR is expected to have a value of one under the null hypothesis that men and women are equally affected by late presentation of glaucoma. An overall age-standardized RR was calculated using Monte Carlo sampling.
Results
Overall
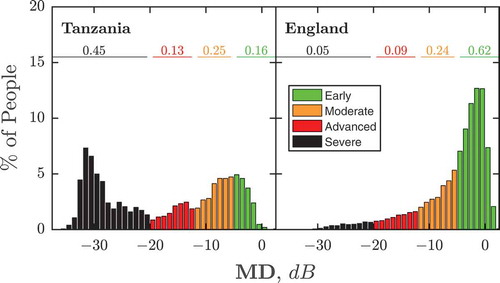
As shown in , average VF loss at first presentation was greater in Tanzania than England (Median MD {Quartiles}: −15.7 {-6.9, −29.0} vs −3.4 {-1.2, −7.7} dB; Mann–Whitney U-test: P ≪ 0.001). Furthermore, a greater proportion of individuals exhibited severe loss (Percent {CI95}; Tanzania: 44.7% {42.2, 47.2} vs England: 4.6% {4.1, 5.0}). This corresponds to a Relative Risk ratio for presenting with severe visual field loss in Tanzania of 9.8 {CI95: 8.8, 11.0}. In England, the proportion of late presentations was lower than in Tanzania, but still substantial. For example, 14.0% {CI95: 13.3, 14.7} of new patients exhibited advanced or severe VF loss, compared to 58.1% {55.6, 60.6} in Tanzania.
Figure 1. Histograms showing VF loss severity at first presentation, for new glaucoma patients in Tanzania (left) and England (right). Numbers show the proportion of individuals with early (≥ −5 dB), moderate (−5.01 dB to −12 dB), advanced (−12.01 dB to −20 dB), or severe (< −20 dB) VF loss in their worse eye.
High levels of late presentation in Tanzania are also evident in , which shows data from individual eyes: systematically selected to show a representative sample of VF loss severities within each population (see Figure Legend for details regarding selection process). From these data, it can be further seen that the spatial distribution of VF loss was heterogeneous across individuals, but that the most common pattern of early field-loss in both populations was a loss of vision in peripheral superior and/or nasal regions (for further spatial analyses, see Supplemental Material 3).
Figure 2. VF data for a representative sample of individuals (worse eye only). In both datasets, 41 individuals were sampled uniformly from 0th, 2.5th, 5th, …, 100th percentile of VF loss severity (MD). The bottom right panel (grey square) shows the average field of all patients at their first appointment (worse eye only; all eyes converted to left-eye format before mean-averaging values, pointwise, across all individuals). Note the greater number of individuals presenting with severe VF loss in Tanzania, but also that some eyes in the England cohort exhibited substantial VF loss.
Age
The age of patients at first presentation was distributed similarly in Tanzania and England (see ), although median age was 3.8 years lower in the Tanzanian population (Median {CI95}: Tanzania: 63.0 {62.4, 64.0}; England: 66.8 {66.6, 67.0}). At almost all ages, however, the proportion of individuals presenting with advanced or severe VF loss was greater in Tanzania (see ).
Figure 3. VF loss severity at first presentation as a function of age. (a) Histograms. In both datasets, patient ages followed similar (‘gumbel max’) distributions (blue dashed lines), though the median age was older in the England population (67 vs. 63 years). (b) Proportion of individuals with advanced loss, as a function of age. Lines indicate least-square polynomial spline fits to the data (NB: the point marked with the black cross was not included in this fit).
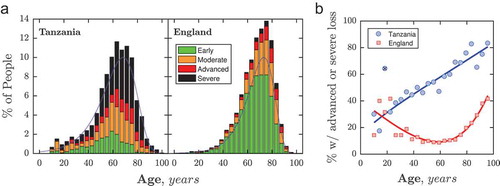
In both countries, the majority of individuals presenting with advanced or severe VF loss were aged 60+ years (Tanzania: 66%; England: 76%). However, among younger patients, the proportion of individuals presenting late in Tanzania increased steadily, from 24% at age 10 to 58% at age 60 (, blue curve). In contrast, the proportion of individuals exhibiting advanced or severe loss in England was similar to Tanzania at childhood (25% at aged 10), but then declined to 8% by age 60 (, red curve). This trend difference meant that younger, working-age adults in Tanzania were disproportionately likely to present late, versus their peers in England: Overall, 50.3% {46.9, 53.7} of adults of prime working age (18–65 years) presented with advanced or severe VF loss in Tanzania, compared to 10.2% {9.3, 11.3} in England. This corresponds to a Relative Risk ratio for late presentation (advanced or severe VF loss) of 4.9 {4.4, 5.6} for 18–65-year-olds, compared to 4.3 {4.0, 4.6} for individuals age 65+.
Sex
In Tanzania, a greater proportion of men presented with advanced or severe VF loss than women. As detailed in , this effect was significant for the dataset as a whole, and also for all individual age-groups between 40 and 70 years. Above 70 years, there was no significant effect of sex, with similar proportions of VF loss in men and women. In England, there was a similar sex difference overall, and, as reported previouslyCitation4, men between ages 60–80 were particularly more likely than women to present with advanced or severe VF loss (see ).
Table 1. Proportion of individuals with advanced or severe VF loss (< −12 dB) at first presentation as a function of sex, and corresponding crude risk ratios for being male. Asterisks highlight in which the sex effect was statistically significant (CI95 > 1). For the rationale behind the use of crude risk ratios, and details regarding how they were computed, see Crabb, Saunders, & Edwards (2017).Citation4 Ages below 40 years are not included due to insufficient data.
Discussion
The data show that in Tanzania, 45% of the people presented to glaucoma clinics with severe visual field (VF) loss in at least one eye, compared to 5% in England. If we consider late presentation to include also cases of advanced loss, then the proportion of patients is even greater: 58%, and 14%, respectively. Given the increased personal and economic costs associated with irreversible VF lossCitation15,Citation16, such high proportions of late presentation highlight the urgent need for earlier detection of glaucoma in both countries, but particularly in Tanzania. Of particular concern is the high proportion of VF loss observed among Tanzanian adults of prime working age (18–65 years), with 50.3% presenting with advanced or severe VF loss in one eye, versus 10.2% in England. Visual impairments in younger adults are particularly costly to society, making glaucoma detection in younger adults a particularly critical challenge in Tanzania.
Comparison to previous data
The high proportion of severe VF loss at presentation in Tanzania is consistent with previous studies of glaucoma across Africa.Citation17-Citation25 For example, one prominent review of glaucoma in Africa estimated that “up to 50% of cases [are] already blind in 1 eye at presentation”Citation10; a value consistent with the 45% of individuals exhibiting severe (<−20 dB) VF loss in the present study.
It has also been suggested previously that glaucoma onset may occur at an earlier age in some African populations.Citation18,Citation26 However, while the median age of the Tanzania patients was somewhat lower (63 vs 67 years), the most striking difference was not the age of the patients, but the high proportions of severe visual field loss observed at all ages by the time people presented for treatment.
The greater proportion of late presentation in men mirrors similar reports in the UKCitation4 and elsewhereCitation27, and the effect was similar in magnitude across both Tanzania and England. This may in part reflect the well-established, universal tendency for men to delay seeking medical help.Citation28 It may also reflect an increased prevalence of primary open-angle glaucoma in menCitation29, although the data supporting this sex difference are currently inconclusive.Citation30 Finally, the greater proportion of late presentation in men may also represent some women failing to enter the healthcare system altogether. For example, women in rural regions of Sub-Saharan Africa are particularly likely to be disadvantaged in terms of education, transport, and incomeCitation31, all of which are key factors that mediate health-seeking behaviors (see C. Late presentation: Causes and Solutions, below). Ultimately, further research is required to establish causal factors, including population-based prospective studies.
Concerns and limitations
One potential concern with the present study is that the differences observed between Tanzania and England may be due to differences in how the tests were explained or administered. However, the same protocol was followed across all sites, and there was no substantive change in results if unreliable tests were excluded (see Supplemental Material 1). Similarly, it would be reasonable to ask whether the greater severity of VF loss may be due to greater degree of cataract in Tanzania. However, the pattern of results was unchanged if Tanzanian patients with additional recorded ophthalmic conditions were removed (see Supplemental Material 1), or when an alternative method for staging VF loss severity was used, designed to be less affected by cataract (see Supplemental Material 2).
A second concern is that VF loss at presentation was quantified by a single perimetric examination, and individual VF measurements are known to be highly variable. Thus, it is common for the first examination to systematically underestimate MD by an average of 2–3 dBCitation32, and there is a similar magnitude of random error associated with any single measurement of MD.Citation33 Such measurement error is unlikely to have had any substantial impact on the present findings, however, due to the size of the effects observed (e.g., the mean difference in VF loss between Tanzania and England was over 12 dB). Furthermore, the pattern of results was unchanged if we instead analyzed data from patients’ second appointment, or if we excluded less reliable tests (see Supplemental Material 1).
One key limitation is that the study only considers data retrospectively. We had no control over how data were collected, and it is possible that in some cases vision loss was so severe that VF testing was not even attempted. Furthermore, some relevant information was not available. For example, we had no access to information regarding ethnicity or socioeconomic factors, and we were unable to corroborate the functional data with structural measures such as intraocular pressure or optic nerve appearance. In the UK dataset, clinical diagnoses were also unavailable, and it is possible that some non-glaucomatous individuals were included (e.g., those with neurological disorders) – although the practice of only including patients with serial VF assessments should have excluded the majority of such cases. Finally, it is important to note that this study was undertaken to determine the severity of VF loss in individuals presenting to glaucoma clinics. It was not intended to be a population-based study and, therefore, we are unable to comment on the prevalence of glaucoma, or on the number of people who are failing to enter the health-care system altogether.
Late presentation: causes and solutions
What is driving the high proportions of late presentation observed, and how could glaucoma detection be improved? The present data do not allow us to answer these questions directly; however, previous studies have identified a number of risk factors for late presentation. These include: (i) lack of regular eye-checksCitation34,Citation35; (ii) povertyCitation5 (either directly, due to lack of capacity to attend appointments, or indirectly, through a lack of education), and (iii) a lack of supportCitation36 (both logistical and emotional). These problems are likely to be universal, but may be exacerbated in Tanzania by negative perceptions regarding surgical treatmentsCitation37,Citation38,Citation39, and by its more geographically sparse population combined with fewer community-based optometrists – the primary referral route for patients in most Western countries.Citation40,Citation41 The large proportion of very severe presenting cases in Tanzania may also represent the additional challenge posed by a large backlog of cases, which has built up with an aging population in combination with limited glaucoma services.
As has been suggested previously by othersCitation22,Citation42, one likely way to improve the early detection of glaucoma – in both England and Tanzania – would be to increase routine eye-checks at primary-care facilities located close to where patients live (e.g., local health centers or high street opticians). Achieving this in Tanzania may require additional service provision. In this respect, our findings are consistent with long-standing calls for “the re-allocation of resources: from curative to preventive, and from tertiary and secondary hospitals to dispensaries and health centres”.Citation43,Citation44 However, provision is only one side of the equation, and improving public engagement with existing services is a key challenge in all countries. In this respect, it was striking that in England the proportion of individuals presenting late – while lower than in Tanzania – was nevertheless substantial, with 14% of individuals exhibiting advanced or severe VF loss. Given that many English citizens already have local access to free eye-care servicesCitation45, this highlights that service provision alone is insufficient, and that more also needs to be done to promote engagement with existing eye-care services; e.g., through education, incentives, and/or the removal of impediments – real or perceived.Citation46-Citation52 Many people in England, for example, are unaware that attending an eye-test does not obligate the purchase of expensive spectaclesCitation53,Citation54, or that eye-testing should be performed regularly, even if not experiencing obvious symptoms or difficulties.Citation55
Finally, a comprehensive solution to the problem of late-presentation may also require a more proactive approach to glaucoma case-finding. This has not proven successful in the past. For example, studies have repeatedly found that mass screening by traditional methods is too inaccurate or too expensive to be cost-effective.Citation56-Citation60 However, we are encouraged by recent technological developments, such as handheld-OCTCitation61-Citation63 and rebound tonometryCitation64,Citation65, as well as by attempts to repurpose already ubiquitous technologies for ophthalmic purposes, such as smartphone fundus imagingCitation66,Citation67 and tablet tests of visual function.Citation68-Citation77 These new portable technologies may be particularly well suited for use in those more rural communities of Sub-Saharan Africa. However, to date, studies regarding their efficacy in practice remain ongoing.
Meeting Presentation
None.
Financial support
This study was funded by a Fight For Sight (UK) project grant (#1854/1855). Professor Matthew Burton is supported by The Wellcome Trust (207472/Z/17/Z), Dr. Heiko Philippin by CBM International. The funding organizations had no role in the design or conduct of this research.
Conflicts of interest
No conflicting relationship exists for any author. DPC reports unrestricted grants from Roche UK, Santen UK, Novartis UK and personal fees from Allergan UK; these are outside the submitted work.
Supplemental Material
Download PDF (1.5 MB)Acknowledgments
This study was funded by a Fight For Sight (UK) project grant (#1854/1855). Professor Matthew Burton is supported by The Wellcome Trust (207472/Z/17/Z). The funding organizations had no role in the design or conduct of this research. The authors would also like to thank Andrew McNaught (Department of Ophthalmology, Gloucestershire Hospitals NHS Foundation Trust, Cheltenham and Cranfield University, Bedford), James Kirwan (Department of Ophthalmology, Queen Alexandra Hospital, Portsmouth), and Nitin Anand (Calderdale and Huddersfield NHS Foundation Trust) for helping to provide access to visual field data from their respective hospitals in 2012.
Supplementary material
Supplemental data for this article can be accessed here.
References
- Flaxman SR, Bourne RRA, Resnikoff S, et al. Global causes of blindness and distance vision impairment 1990–2020: a systematic review and meta-analysis. Lancet Glob Health. 2017;5(12):e1221–e1234. doi:10.1016/S2214-109X(17)30393-5.
- Tham Y-C, Li X, Wong TY, Quigley HA, Aung T, Cheng C-Y. Global prevalence of glaucoma and projections of glaucoma burden through 2040: a systematic review and meta-analysis. Ophthalmology. 2014;121(11):2081–2090. doi:10.1016/j.ophtha.2014.05.013.
- Boodhna T, Crabb DP. Disease severity in newly diagnosed glaucoma patients with visual field loss: trends from more than a decade of data. Ophthalmic Physiol Opt. 2015;35(2):225–230. doi:10.1111/opo.12187.
- Crabb DP, Saunders LJ, Edwards LA. Cases of advanced visual field loss at referral to glaucoma clinics–more men than women? Ophthalmic Physiol Opt. 2017;37(1):82–87. doi:10.1111/opo.12328.
- Fraser S, Bunce C, Wormald R, Brunner E. Deprivation and late presentation of glaucoma: case-control study. Bmj. 2001;322(7287):639–643. doi:10.1136/bmj.322.7287.639.
- Buys YM, Gaspo R, Kwok K, Group CGRFS, others. Referral source, symptoms, and severity at diagnosis of ocular hypertension or open-angle glaucoma in various practices. Can J Ophthalmol Can d’Ophtalmologie. 2012;47(3):217–222. doi:10.1016/j.jcjo.2012.03.031.
- Landers J, Goldberg I, Graham S. Does a family history of glaucoma affect disease severity at the time of diagnosis? J Glaucoma. 2003;12:31–35.
- Kyari F, Entekume G, Rabiu M, et al. A population-based survey of the prevalence and types of glaucoma in Nigeria: results from the Nigeria national blindness and visual impairment survey. BMC Ophthalmol. 2015;15(1):176. doi:10.1186/s12886-015-0160-6.
- Jackson DJ, Razai MS, Falama R, et al. The clinical characteristics of patients with glaucoma presenting to Botswana healthcare facilities: an observational study. BMJ Open. 2014;4(12):e005965. doi:10.1136/bmjopen-2014-005965.
- Cook C. Glaucoma in Africa: size of the problem and possible solutions. J Glaucoma. 2009;18(2):124–128. doi:10.1097/IJG.0b013e318189158c.
- Abdull MM, Gilbert CC, Evans J. Primary open angle glaucoma in northern Nigeria: stage at presentation and acceptance of treatment. BMC Ophthalmol. 2015;15(1):111. doi:10.1186/s12886-015-0097-9.
- Saunders LJ, Russell RA, Crabb DP. Measurement precision in a series of visual fields acquired by the standard and fast versions of the Swedish interactive thresholding algorithm: analysis of large-scale data from clinics. JAMA Ophthalmol. 2015;133(1):74–80. doi:10.1001/jamaophthalmol.2014.4237.
- Mills RP, Budenz DL, Lee PP, et al. Categorizing the stage of glaucoma from pre-diagnosis to end-stage disease. Am J Ophthalmol. 2006;141(1):24–30. doi:10.1016/j.ajo.2005.07.044.
- Brusini P, Filacorda S. Enhanced glaucoma staging system (GSS 2) for classifying functional damage in glaucoma. J Glaucoma. 2006;15:40–46.
- Varma R, Lee PP, Goldberg I, Kotak S. An assessment of the health and economic burdens of glaucoma. Am J Ophthalmol. 2011;152(4):515–522. doi:10.1016/j.ajo.2011.06.004.
- Traverso CE, Walt JG, Kelly SP, et al. Direct costs of glaucoma and severity of the disease: a multinational long term study of resource utilisation in Europe. Br J Ophthalmol. 2005;89(10):1245–1249. doi:10.1136/bjo.2005.067355.
- Rotchford AP, Johnson GJ. Glaucoma in Zulus: a population-based cross-sectional survey in a rural district in South Africa. Arch Ophthalmol. 2002;120(4):471–478. doi:10.1001/archopht.120.4.471.
- Budenz DL, Barton K, Whiteside-de Vos J, et al. Prevalence of glaucoma in an urban West African population: the tema eye survey. JAMA Ophthalmol. 2013;131(5):651–658. doi:10.1001/jamaophthalmol.2013.1686.
- Buhrmann RR, Quigley HA, Barron Y, West SK, Oliva MS, Mmbaga BBO. Prevalence of glaucoma in a rural East African population. Invest Ophthalmol Vis Sci. 2000;41:40–48.
- Rotchford AP, Kirwan JF, Muller MA, Johnson GJ, Roux P. Temba glaucoma study: a population-based cross-sectional survey in urban South Africa. Ophthalmology. 2003;110(2):376–382. doi:10.1016/S0161-6420(02)01568-3.
- Wormald R, Foster A. Clinical and pathological features of chronic glaucoma in north-east Ghana. Eye. 1990;4(1):107–114. doi:10.1038/eye.1990.13.
- Verrey J-D, Foster A, Wormald R, Akuamoa C. Chronic glaucoma in northern Ghana - a retrospective study of 397 patients. Eye. 1990;4(1):115–120. doi:10.1038/eye.1990.14.
- Ellong A, Mvogo CE, Bella-Hiag AL, Mouney EN, Ngosso A, Litumbe CN. Prevalence of glaucomas in a black Cameroonian population. Sante. 2006;16:83–88.
- Omoti AE, Osahon AI, Waziri-Erameh MJM. Pattern of presentation of primary open-angle glaucoma in Benin City, Nigeria. Trop Doct. 2006;36(2):97–100. doi:10.1258/004947506776593323.
- Mafwiri M, Bowman RJC, Wood M, Kabiru J. Primary open-angle glaucoma presentation at a tertiary unit in Africa: intraocular pressure levels and visual status. Ophthalmic Epidemiol. 2005;12(5):299–302. doi:10.1080/09286580500180572.
- Kyari F, Abdull MM, Bastawrous A, Gilbert CE, Faal H. Epidemiology of glaucoma in sub-saharan Africa: prevalence, incidence and risk factors. Middle East Afr J Ophthalmol. 2013;20(2):111–125. doi:10.4103/0974-9233.110605.
- Motlagh BF, Pirbazari TJ. Risk factors for late presentation of chronic glaucoma in an Iranian population. Oman J Ophthalmol. 2016;9(2):97–100. doi:10.4103/0974-620X.184527.
- Yousaf O, Grunfeld EA, Hunter MS. A systematic review of the factors associated with delays in medical and psychological help-seeking among men. Health Psychol Rev. 2015;9(2):264–276. doi:10.1080/17437199.2013.840954.
- Kapetanakis VV, Chan MPY, Foster PJ, Cook DG, Owen CG, Rudnicka AR. Global variations and time trends in the prevalence of primary open angle glaucoma (POAG): a systematic review and meta-analysis. Br J Ophthalmol. 2016;100(1):86–93. doi:10.1136/bjophthalmol-2015-307223.
- Vajaranant TS, Nayak S, Wilensky JT, Joslin CE. Gender and glaucoma: what we know and what we need to know. Curr Opin Ophthalmol. 2010;21(2):91–99. doi:10.1097/ICU.0b013e3283360b7e.
- Buor D. Determinants of utilisation of health services by women in rural and urban areas in Ghana. GeoJournal. 2004;61(1):89–102. doi:10.1007/s10708-005-1929-6.
- Heijl A, Bengtsson B. The effect of perimetric experience in patients with glaucoma. Arch Ophthalmol. 1996;114(1):19–22. doi:10.1001/archopht.1996.01100130017003.
- Tattersall CL, Vernon SA, Menon GJ. Mean deviation fluctuation in eyes with stable Humphrey 24–2 visual fields. Eye. 2007;21(3):362–366. doi:10.1038/sj.eye.6702206.
- Fraser S, Bunce C, Wormald R. Risk factors for late presentation in chronic glaucoma. Invest Ophthalmol Vis Sci. 1999;40:2251–2257.
- Prior M, Francis JJ, Azuara-blanco A, Anand N, Burr JM. Why do people present late with advanced glaucoma? A qualitative interview study. Br J Ophthalmol. 2013;97(12):1574–1578. doi:10.1136/bjophthalmol-2013-303813.
- Saw SM, Gazzard G, Friedman D, et al. Awareness of glaucoma, and health beliefs of patients suffering primary acute angle closure. Br J Ophthalmol. 2003;87(4):446–449. doi:10.1136/bjo.87.4.446.
- Bronsard A, Geneau R, Shirima S, Courtright P, Mwende J. Why are children brought late for cataract surgery? Qualitative findings from Tanzania. Ophthalmic Epidemiol. 2008;15(6):383–388. doi:10.1080/09286580802488624.
- Bickley RJ, Mkocha H, Munoz B, West S. Identifying patient perceived barriers to trichiasis surgery In Kongwa District, Tanzania. PLoS Negl Trop Dis. 2017;11(1):e0005211. doi:10.1371/journal.pntd.0005211.
- Grimes CE, Bowman KG, Dodgion CM, Lavy CBD. Systematic review of barriers to surgical care in low-income and middle-income countries. World J Surg. 2011;35(5):941–950. doi:10.1007/s00268-011-1010-1.
- Davey CJ, Green C, Elliott DB. Assessment of referrals to the hospital eye service by optometrists and GPs in Bradford and Airedale. Ophthalmic Physiol Opt. 2011;31(1):23–28. doi:10.1111/j.1475-1313.2010.00797.x.
- Bowling B, Chen SDM, Salmon JF. Outcomes of referrals by community optometrists to a hospital glaucoma service. Br J Ophthalmol. 2005;89(9):1102–1104. doi:10.1136/bjo.2004.064378.
- Lewallen S, Courtright P. Blindness in Africa: present situation and future needs. Br J Ophthalmol. 2001;85(8):897–903. doi:10.1136/bjo.85.8.897.
- Flessa S. Where efficiency saves lives: A linear programme for the optimal allocation of health care resources in developing countries. Health Care Manag Sci. 2000;3:249–267.
- Wandwalo E, Robberstad B, Morkve O. Cost and cost-effectiveness of community based and health facility based directly observed treatment of tuberculosis in Dar es Salaam, Tanzania. Cost Eff Resour Alloc. 2005;3(1):1–9. doi:10.1186/1478-7547-3-6.
- Shah R, Evans BJW, Edgar D. A survey of the availability of state-funded primary eye care in the UK for the very young and very old. Ophthalmic Physiol Opt. 2007;27(5):473–481. doi:10.1111/j.1475-1313.2007.00506.x.
- Javitt JC. Preventing blindness in americans: the need for eyehealth education. Surv Ophthalmol. 1995;40:41–44.
- Alexander RL, Miller NA, Cotch MF, Janiszewski R. Factors that influence the receipt of eye care. Am J Health Behav. 2008;32(5):547–556. doi:10.5555/ajhb.2008.32.5.547.
- Gasch AT, Wang P, Pasquale LR. Determinants of glaucoma awareness in a general eye clinic1. Ophthalmology. 2000;107(2):303–308. doi:10.1016/s0161-6420(99)00076-7.
- Attebo K, Mitchell P, Cumming R, BMath WS. Knowledge and beliefs about common eye diseases. Aust N Z J Ophthalmol. 1997;25:283–287.
- Tenkir A, Solomon B, Deribew A. Glaucoma awareness among people attending ophthalmic outreach services in Southwestern Ethiopia. BMC Ophthalmol. 2010;10(17):1–6. doi:10.1186/1471-2415-10-1.
- Dandona R, Dandona L, John RK, McCarty CA, Rao GN. Awareness of eye diseases in an urban population in southern India. Bull World Health Organ. 2001;79:96–102.
- Adegbehingbe BO, Bisiriyu LA. Knowledge, attitudes, and self care practices associated with glaucoma among hispital workers in Ile-Ife, Osun State, Nigeria. Tanzan J Health Res. 2008;10(4):240–245.
- Shickle D, Griffin M. Why don’t older adults in England go to have their eyes examined? Ophthalmic Physiol Opt. 2014;34(1):38–45. doi:10.1111/opo.12100.
- Biddyr S, Jones A. Preventing sight loss in older people. A qualitative study exploring barriers to the uptake of regular sight tests of older people living in socially deprived communities in South Wales. Public Health. 2015;129(2):110–116. doi:10.1016/j.puhe.2014.10.013.
- Shickle D, Griffin M, Evans R, et al. why don’t younger adults in England go to have their eyes examined? Ophthalmic Physiol Opt. 2014;34(1):30–37. doi:10.1111/opo.12099.
- Burr JM, Mowatt G, Hernández R, et al. The clinical effectiveness and cost-effectiveness of screening for open angle glaucoma: a systematic review and economic evaluation. Health Technol Assess. 2007;11(41):1–190. doi:10.3310/hta11410.
- Tuck MW, Crick RP. The cost-effectiveness of various modes of screening for primary open angle glaucoma. Ophthalmic Epidemiol. 1997;4:3–17.
- Vaahtoranta-Lehtonen H, Tuulonen A, Aronen P, et al. Cost effectiveness and cost utility of an organized screening programme for glaucoma. Acta Ophthalmol Scand. 2007;85(5):508–518. doi:10.1111/j.1600-0420.2007.00947.x.
- Hernández R, Rabindranath K, Fraser C, et al. Screening for open angle glaucoma: systematic review of cost-effectiveness studies. J Glaucoma. 2008;17(3):159–168. doi:10.1097/IJG.0b013e31814b9693.
- Tielsch JM, Katz J, Singh K, et al. A population-based evaluation of glaucoma screening: the Baltimore Eye Survey. Am J Epidemiol. 1991;134(10):1102–1110. doi:10.1093/oxfordjournals.aje.a116013.
- Kim S, Crose M, Eldridge WJ, Cox B, Brown WJ, Wax A. Design and implementation of a low-cost, portable OCT system. Biomed Opt Express. 2018;9(3):1232–1243. doi:10.1364/BOE.9.001232.
- Lu CD, Kraus MF, Potsaid B, et al. Handheld ultrahigh speed swept source optical coherence tomography instrument using a MEMS scanning mirror. Biomed Opt Express. 2014;5(1):293–311. doi:10.1364/BOE.5.000293.
- Keane PA, Sadda SR. Retinal imaging in the twenty-first century: state of the art and future directions. Ophthalmology. 2014;121(12):2489–2500. doi:10.1016/j.ophtha.2014.07.054.
- Nuyen B, Mansouri K. Fundamentals and advances in tonometry. Asia-Pacific J Ophthalmol. 2015;4(2):66–75. doi:10.1097/APO.0000000000000118.
- Martinez-de-la-Casa JM, Garcia-Feijoo J, Castillo A, Garcia-Sanchez J. Reproducibility and clinical evaluation of rebound tonometry. Invest Ophthalmol Vis Sci. 2005;46(12):4578–4580. doi:10.1167/iovs.05-0586.
- Russo A, Mapham W, Turano R, et al. Comparison of smartphone ophthalmoscopy with slit-lamp biomicroscopy for grading vertical cup-to-disc ratio. J Glaucoma. 2016;25(9):e777–e781. doi:10.1097/IJG.0000000000000499.
- Bastawrous A, Giardini ME, Bolster NM, et al. Clinical validation of a smartphone-based adapter for optic disc imaging in Kenya. JAMA Ophthalmol. 2016;134(2):151–158. doi:10.1001/jamaophthal.
- Schulz AM, Graham EC, You Y, Klistorner A, Graham SL. Performance of iPad based threshold perimetry in glaucoma and controls. Clin Exp Ophthalmol. 2017;64(4):346–355. doi:10.1111/ceo.13082.
- Kong YXG, He M, Crowston JG, Vingrys AJ. A comparison of perimetric results from a tablet perimeter and Humphrey field analyzer in glaucoma patients. Transl Vis Sci Technol. 2016;5(6):2. doi:10.1167/tvst.5.6.4.
- Vingrys AJ, Healey JK, Liew S, et al. Validation of a tablet as a tangent perimeter. Transl Vis Sci Technol. 2016;5(4):3. doi:10.1167/tvst.5.6.4.
- Prea SM, Kong YXG, Mehta A, et al. Six-month longitudinal comparison of a portable tablet perimeter with the Humphrey field analyzer. Am J Ophthalmol. 2018;190:9–16. doi:10.1016/j.ajo.2018.03.009.
- Johnson CA, Thapa S, Kong YXG, Robin AL. Performance of an iPad application to detect moderate and advanced visual field loss in Nepal. Am J Ophthalmol. 2017;182:147–154. doi:10.1016/j.ajo.2017.08.007.
- Bastawrous A, Rono HK, Livingstone IAT, et al. Development and validation of a smartphone-based visual acuity test (peek acuity) for clinical practice and community-based fieldwork. JAMA Ophthalmol. 2015;133(8):930–937. doi:10.1001/jamaophthalmol.2015.1468.
- Aslam TM, Parry NRA, Murray IJ, et al. Development and testing of an automated computer tablet-based method for self-testing of high and low contrast near visual acuity in ophthalmic patients. Graefe’s Arch Clin Exp Ophthalmol. 2016;254(5):891–899. doi:10.1007/s00417-016-3293-2.
- Dorr M, Lesmes LA, Lu Z-L, Bex PJ. Rapid and reliable assessment of the contrast sensitivity function on an iPad. Invest Ophthalmol Vis Sci. 2013;54(12):7266–7273. doi:10.1167/iovs.13-11743.
- Winther C, Frisén L. Self-testing of vision in age-related macula degeneration: a longitudinal pilot study using a smartphone-based rarebit test. J Ophthalmol. 2015;2015:1–7. doi:10.1155/2015/285463.
- Jones PR, Smith ND, Bi W, Crabb DP. Portable perimetry using eye-tracking on a tablet computer – a feasibility assessment. Transl Vis Sci Technol. 2019;8(1):17. doi:10.1167/tvst.8.1.17.