
ABSTRACT
Purpose
To present and compare baseline vision findings in eyes with early age-related macular degeneration (E-AMD), intermediate AMD (I-AMD), and age-similar participants with normal aging changes to the retina (No-AMD).
Methods
Two hundred and thirty-seven eyes of 125 individuals (66.4% female, mean age 75.3 years) were tested monocularly using several simple, rapid psychophysical tests: high contrast visual acuity, low contrast visual acuity at reduced luminance, contrast sensitivity, shape discrimination hyperacuity, colour vision, reading rate, and glare recovery. Retinal status was determined using colour fundus photographs that were graded according to the Beckman Initiative for Macular Research Classification Committee scale. Logistic regression analyses with generalized estimating equations were used to assess the association between each vision variable and AMD category, while taking into account the correlation between the two eyes.
Results
Three vision measures (contrast sensitivity [CS], shape discrimination hyperacuity [SDH], and colour discrimination [DesatCCS]) were significantly and independently associated with intermediate AMD. Relative Risk Ratios (RRR), 95% Confidence Intervals (in parentheses), beta coefficients, and significance (p) for the I-AMD vs. No-AMD model are: CS: RRR = 6.5 (1.91–22.0), beta = 1.87, p < .01; SDH: RRR = 2.34 (1.24–4.44), beta = 0.85, p < .001; DesatCCS: RRR = 1.43 (1.22–1.68), beta = 0.36, p < .001. Performance on these measures was significantly poorer for participants with I-AMD vs. No-AMD.
Conclusions
Simple screening tests distinguish eyes with intermediate AMD from eyes with less severe AMD or normal aging changes. This suggests that these vision measures may be significant predictors of which participants will go on to develop advanced AMD.
Introduction
Age-related macular degeneration (AMD) is the leading cause of vision loss and blindness among the elderly in developed countries.Citation1–3 The population is aging; by 2030, over 20% of the United States population is expected to be 65 years or older,Citation4 and the number of people with AMD is expected to increase to 3.66 million by the year 2030.Citation5
Fortunately, only a fraction of those with the early stages of AMD goes on to develop one of the advanced forms of the disease, central geographic atrophy (GA) or choroidal neovascularization (CNV), which is often associated with severe visual impairment. Current treatments, including anti-VEGF therapies, target the late form of the disease, CNV, and improve visual acuity, but rarely to normal levels and the improvement in acuity resulting from treatment is often relatively short-lived.Citation6–8 There are no treatments for GA currently available, but several clinical trials have been carried out or are underway (for a review, see Sacconi et al.Citation9) Identification of those eyes that are likely to progress to advanced stages has important implications for both clinical care and clinical trials of new treatments aimed at earlier intervention. Numerous genetic loci, environmental factors, and demographic characteristics, as well as fundus signs (e.g., drusen and pigment changes), have been identified as risk factors predictive of progression to advanced diseaseCitation10-12 and several strong predictive models incorporating these factors have been proposed.Citation12-14 The ongoing longitudinal study, of which this report contains baseline findings, addresses the value of vision measures as predictors of late-stage disease. The addition of functional measures may strengthen predictive models.
Numerous aspects of vision function have been reported to be impaired in the early to intermediate stages of AMD (for reviews, see Lovie-Kitchin & FeiglCitation15 and Hogg & ChakravarthyCitation16). These vision function deficits include decreased contrast sensitivity,Citation17-19 deficits in colour vision,Citation20-25 reduced sensitivity to mid-frequency flicker,Citation26 impaired photostress recovery,Citation27,Citation28 delayed cone and rod dark adaptation and elevated final thresholds,Citation24,Citation25,Citation29,Citation30 impaired shape discrimination hyperacuity,Citation31 orientation discrimination,Citation32 and loss of function at reduced luminance.Citation33,Citation34 There is much interest in identifying which, if any, of these is predictive of advancement to late-stage disease in eyes with early-stage AMD. A number of longitudinal studies have identified psychophysical measures that may be predictive of future progression to advanced disease (e.g., foveal flicker sensitivity,Citation35 dark-adapted sensitivity,Citation36 dark adaptation and S-cone thresholds,Citation37 delayed photostress recovery,Citation38 and flicker perimetryCitation39). Yet, none of these measures has been adopted broadly, perhaps because many of the measures are time-consuming or require sophisticated equipment, making them poorly suited for clinical use or as screening tests.
Toward the goal of identifying practical vision function measures that are predictive of progression to advanced AMD, a test battery was administered to three groups (normally aging eyes, eyes with early AMD, and eyes with intermediate AMD) that are being followed longitudinally. Together the tests assess multiple dimensions of vision. Here, we present and compare the baseline vision functions of the three groups.
Materials and methods
Participants
Participants were recruited from several sources: Referrals from two retina practices in San Francisco, an optometry practice in Roseburg, Oregon, and qualified participants from our earlier Smith-Kettlewell Institute (SKI) study of vision in aging.Citation40
Exclusion criteria included eye conditions other than early to intermediate AMD in study eyes (e.g., amblyopia, corneal scarring, etc.), prior eye surgeries (except uncomplicated cataract surgery), visual impairment (visual acuity worse than 20/40, >0.30 logMAR), or cognitive impairment (as defined by the Mini-Mental State Exam [MMSE], score <25).Citation41 Cataract (history of surgery or current cataract) was not an exclusion criterion, unless it resulted in acuity worse than 20/40.
Participants included in this report were 125 individuals aged 55.0–95.9 with a mean age of 75.3 years (SD 10.8). The sample was predominantly Caucasian (93.6%), the mean level of education was 16.2 years (SD 2.8), and 66.4% were female.
AMD classification
Colour fundus photographs were used to determine retinal status and were graded according to the five-level clinical classification system proposed by the Beckman Initiative for Macular Research Classification Committee.Citation42 Fundus characteristics were assessed within two disc diameters of the fovea. In the Beckman Classification system, the first level, “No apparent aging changes” is defined as the absence of both drusen and AMD pigment abnormalities. “Normal aging changes” include only small drusen (≤63 µm) and no AMD pigmentary abnormalities. “Early AMD” (E-AMD) is defined as the presence of medium drusen (>63 µm and ≤125 µm) and no AMD pigmentary abnormalities. “Intermediate AMD” (I-AMD) consists of large drusen (>125 µm) without or with AMD pigmentary abnormalities, or medium drusen with AMD pigmentary abnormalities. “Late AMD” is defined as CNV and/or any GA, and these eyes were excluded from the study sample.
Procedure
Following the completion of written informed consent, the MMSECitation41 was used to screen for cognitive impairment. Two individuals with an MMSE score of <25 were excluded on this basis.
A questionnaire was then verbally administered to each participant, covering visual conditions (cataract, glaucoma, AMD), medical conditions (hypertension, high cholesterol, cancer, heart condition, diabetes, stroke, arthritis, anxiety, depression, or medication for any of the above conditions), and smoking status (Never, Prior, Current [along with additional details to calculate pack years]). Self-reported eye conditions were confirmed by eye records and the examinations completed by our collaborating eye professionals.
Refraction was carried out by an on-site optometrist, and trial frames were used to provide optimum correction for the 40 cm test distance. Each eye was tested monocularly, and the eye tested first was randomly selected.
The test battery consisted of eight psychophysical measures. High contrast acuity at near was assessed using the high contrast chart (SKL) of the SKILL Card,Citation43 a near logMAR acuity chart that contains black letters on a white (150 cd/m2) background. Low contrast (14% Weber contrast) logMAR acuity at reduced luminance was measured under the same test illumination using the dark chart (SKD) of the SKILL Card, which contains dark letters on a grey background reducing the luminance of the chart to 15 cd/m2. For both acuity measures, scoring was letter by letter and the subject was required to name letters until 3 of 5 letters on a line were misidentified.
Contrast sensitivity under photopic (CS: 150 cd/m2) and low photopic (CS_low lumin: 4.5 cd/m2) luminance conditions was measured using MARS chartsCitation44 presented at 40 cm. CS_low lumin was measured by having the participant hold NoIR U23 filter glasses (4% transmission) over the trial frames, while reading a different version of the MARS chart. Testing continued until the participant made two consecutive errors.
Shape discrimination hyperacuity (SDH), the ability to identify radial deformation (of circles), was measured using the method of Wang et al.,Citation31,Citation45 presented on an iPod. Thresholds were determined using a three-alternative forced-choice (3AFC) procedure. Participants were given one practice threshold measure, followed by two thresholds for each eye. If the two test thresholds differed by ≥0.30 log units, an additional measure was done. The mean of the two (or three) test thresholds was used.
Colour vision was assessed using the Adams desaturated D-15Citation46,Citation47under illuminant C. Acolour confusion score (DesatCCS) was calculated after the method of BowmanCitation48 with a perfect arrangement having a score of zero. Colour defect type (red-green, blue-yellow, or nonselective) was determined according to the vector analysis of Vingrys and King-Smith.Citation49 Confusion angles between −25 and 25 were considered red-green (R/G) defects. Confusion angles between −70 and −100 and between 70 and 100 were considered blue-yellow (B/Y; tritan) defects. Defects with angles not falling within these zones were considered nonselective. Two males with hereditary R/G colour anomaly were excluded from the analyses.
The International Reading Speed Test (IReST),Citation50 each version of which contains a paragraph of meaningful text, was used to assess reading speed. Three different print sizes were used for this study (1 M, 1.25 M, and 1.6 M, which are equivalent to 0.40, 0.50, and 0.60 logMAR, respectively). This was done to ensure that all participants would be tested with a text size that was at least 0.30 logMAR larger than their measured high contrast acuity (i.e., their acuity reserve was ≥0.30 logMAR).Citation51,Citation52 Subjects read aloud, were tape-recorded for scoring, and were timed with a stopwatch. Errors and omissions were counted and subtracted from the total word count to compute the corrected reading rate in words/minute. Two female participants who reported a history of dyslexia were excluded from the analyses.
Glare recovery (retinal photostress) was measured as the time required to identify all three letters of the triplet on the MARS card that was 0.20 (0.16–0.24) log units above the measured threshold following one-minute adaptation to a large uniform field of 3600 cd/m2. Unlike cone dark adaptation, glare recovery typically occurs over seconds, not minutes, and does not require absolute darkness for testing. This makes it a much faster and more practical measure.
The research reported here followed the tenets of the Declaration of Helsinki. Written informed consent and HIPAA authorization were obtained from all participants after explanation of the nature and possible consequences of the study. The research was approved by the Smith-Kettlewell Eye Research Institute Institutional Review Board.
Data analysis
Each participant was assigned an identification number, and de-identified data were entered in a Filemaker Pro 10 database. The data were transferred to STATA/SE 13.1 for Macintosh OSX and R Version 3.4.4 for Windows for all statistical analyses. Prior to analyses, data were “cleaned” (i.e., listings were generated for all data to check for errors and outliers, and corrections were made where necessary).
One-way analyses of variance (ANOVAs) were used to assess the differences across AMD Category in continuous participant characteristics (i.e., age, MMSE, years of education, smoking [pack years calculated from self-report]). ChiCitation2 analyses were used to assess differences across AMD Category in categorical variables (i.e., sex [M/F], self-reported medical condition [Y/N: hypertension, elevated cholesterol, heart disease, diabetes, cancer, stroke, arthritis], or medication for the medical condition [Y/N]).
Cumulative proportion distributions were plotted for No-AMD, E-AMD, and I-AMD for each of the eight vision variables (See and 2). To facilitate comparisons across vision measures, all measures were plotted as log units.
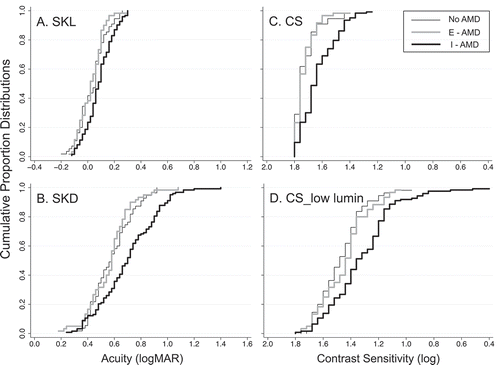
Figure 1. Cumulative proportion distributions for SKL (panel A), SKD (panel B), CS (panel C), and CS_low lumin (panel D) for eyes categorized as No-AMD (thin black line), E-AMD (thick grey line) and I-AMD (thick black line). Data are plotted with poorer performance to the right along the abscissa. All scales are in log units and x-axes span 1.6 log units. Abbreviations: SKL = SKILL Light: high contrast near acuity; SKD = SKILL Dark: low contrast, low luminance near acuity; CS = contrast sensitivity at high luminance; CS_low lumin = contrast sensitivity at low photopic luminance
Given the nature of the dataset (i.e., three AMD categories: No-AMD, E-AMD, and I-AMD), and the use of correlated data (i.e., data from both eyes for most participants), multinomial logistic regression analyses with generalized estimating equations (GEE)Citation53,Citation54 is the appropriate statistical analysis. This allows assessment of the association between each vision variable and AMD category, while taking into account the correlation between the two eyes.Citation55,Citation56 STATA/SE does not support this type of analysis, so the multinomial logistic regression with GEE analyses was conducted with the multGEE package for R.Citation57 Statistical significance was p < .05 (two-tailed).
Results
presents a summary of the fundus characteristics of the 237 eyes (of N = 125 participants) included in this study. As used in the present paper, the No-AMD category includes 56 eyes of 33 individuals from the first two categories of the Beckman Classification system. Of these, 35.7% had no drusen, 17.9% had few (<7) small drusen centrally, and the remainder (46.4%) had multiple small central drusen. The sample also included 57 eyes of 40 individuals with E-AMD by the Beckman Classification system. Of the eyes classified as E-AMD, the majority (56.1%) had only 1 central medium (along with multiple small) drusen; in an additional 17.5% of E-AMD eyes, medium drusen, were outside the central one disc diameter of the fovea. Only 26.3% had multiple central medium drusen. There were 124 eyes (of 75 individuals) classified as I-AMD. Of these, a minority (42.8%) had pigmentary abnormalities: pigment changes associated with large drusen in 34.7% and medium drusen in 8.1% of eyes with I-AMD. An additional 42.7% had multiple large central drusen without pigmentary changes. The remainder had only one large druse centrally (8.1%) or large drusen only outside the central one disc diameter of the fovea (6.5% of I-AMD eyes).
Table 1. Fundus Characteristics of the 237 Eyes of 125 People Included in the Baseline (BL) Sample
For most participants (n = 89, 71.2%), both eyes were classified in the same AMD category. Twenty-three participants (18.4%) were mixed (No-AMD in one eye, E-AMD in the other [n = 6]; No-AMD in one eye, I-AMD in the other [n = 3]; E-AMD in one eye, I-AMD in the other [n = 14]). For the remaining 10.4% (n = 13), only one eye was included because the fellow eye did not qualify: (n = 4 I-AMD eyes had Late AMD [2 CNV, 2 GA] in the fellow eye, [n = 3] had I-AMD in the fellow eye but did not meet the 20/40 acuity criterion, and [n = 6] were excluded due to a non-retinal condition [e.g., amblyopia, corneal scarring, cataract surgery complication] in the fellow eye).
presents the demographic data for participants in the No-AMD, E-AMD, and I-AMD categories. No statistically significant differences between AMD categories were found for any of the characteristics in (age: p = .28, sex: p = .21, MMSE: p = .86; years of education: p = .16). also presents means, standard deviations, and ranges for each of the vision measures for eyes with No-AMD, E-AMD, and I-AMD.
Table 2. Baseline Demographic and Vision Measure Summary for AMD Categories
No significant differences were observed for any of the other person variables assessed (results not shown), which included one continuous variable (pack-years smoked, p = .57) and several dichotomous variables (self-reported variables [ever smoked, elevated cholesterol, heart disease, diabetes, cancer, stroke, arthritis, anxiety or depression, or taking medication for any of these conditions]). ChiCitation2 testing of the dichotomous measures yielded p values that were >0.10 in all cases, ranging from 0.19 (self-report of taking medication for anxiety or depression) to 0.99 (self-reported arthritis).
Each panel of and 2 presents the cumulative proportion distributions for one vision measure for the three groups: No-AMD eyes (thin black line), E-AMD eyes (thick gray lines), and I-AMD eyes (thick black lines). In each panel, data are plotted so that poorer performance is to the right along the abscissa. All scales are in log units and all x-axes span 1.6 log units, facilitating comparisons of the degree of separation between the groups across the different vision measures.
Since high contrast acuity ≥0.30 logMAR (worse than 20/40 Snellen equivalent) was an exclusion factor in the current study, it is not surprising that large differences are not seen in the SKL distributions (). Even so, there is a clear separation between the I-AMD distribution (thick black line) and both No-AMD and E-AMD distributions (thin black line and thick gray lines, respectively).
For low contrast, low luminance acuity (SKD: ), contrast sensitivity under conditions of high and low luminance (CS and CS_low lumin: )), and shape discrimination hyperacuity (SDH: ), there is a great deal of overlap between No-AMD and E-AMD, but I-AMD shows considerable separation from the other two groups.
Figure 2. Cumulative proportion distributions for SDH (panel A), DesatCCS (panel B), IReST (panel C), and Glare Recovery (panel D) for No-AMD (thin black line), E-AMD (thick grey line), and I-AMD (thick black line). Data are plotted with poorer performance to the right along the abscissa. All scales are in log units and x-axes span 1.6 log units. For DesatCCS, IReST, and Glare Recovery, the displayed range of non-log values is noted in the lower right corner of each panel. Abbreviations: SDH = shape discrimination hyperacuity; DesatCCS = desaturated D-15 color confusion score; IReST = International Reading Speed Test
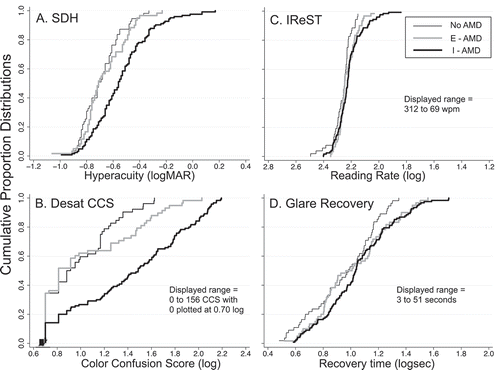
The same is true for the DesatCCS (), but some separation between the No-AMD and E-AMD distributions becomes apparent for logCCS scores >1.2 (i.e., raw CCS ≥ 16). Note that the calculation of confusion angle to determine the type of colour vision defect becomes invalid for small errors (low CCS values). We have in the past used a CCS ≥ 30 as a cut-off for failure when calculating confusion angles.Citation58 Of the 80 eyes with CCS ≥ 30, 78.8% (n = 63) were classified as I-AMD, 15.0% (n = 12) were E-AMD, and 6.3% (n = 5) were No-AMD. Thus, 50.8% of I-AMD, 21.1% of E-AMD, and 8.9% of No-AMD eyes had DesatCCS ≥30.
No R/G defects were found for any of the included eyes. For the I-AMD group, 87.3% of eyes (n = 55) with defects had B/Y defects, and 12.7% (n = 8) were nonselective. For E-AMD eyes, B/Y defects were found in 58.3% (n = 7), and 41.7% (n = 5) were nonselective. For No-AMD eyes with CCS ≥ 30, B/Y defects were found in 60% (n = 5) and nonselective defects in 40% (n = 3).
Cumulative proportion distributions for reading rate (IReST: ) and glare recovery show much greater degree of overlap of the three AMD groups than other vision measures.
and 2 illustrate two general findings. The first is that there is considerable overlap in the distributions of data from the No-AMD eyes and E-AMD eyes for all measures. However, for several measures, the range of the E-AMD group extends to poorer performance (i.e., further to the right) than that of the No-AMD group.
A second general finding is that the data from the I-AMD group are displaced to the right (i.e., toward poorer performance), relative to the other two groups, though the best performance in this group is generally comparable to that of the No-AMD and E-AMD groups. In contrast, the worst performance of the I-AMD group is poorer than that of the other two groups on all measures except high contrast acuity (which was an inclusion criterion and thus had the lower bound set). For measures other than high contrast acuity, the range of values for the I-AMD group is larger than that of the other two groups, indicating that there is more variation among I-AMD eyes.
To determine whether the apparent differences between I-AMD vs. E-AMD and I-AMD vs. No-AMD are significant, while taking into account the correlation between the two eyes, multinomial logistic regression analysis with GEE was conducted. I-AMD is the reference category (outcome variable) for all analyses, and predictor variables include age (per decade), sex (female), cataract surgery (no), and the eight continuous vision variables.
All vision variables were expressed in log units, and divided by 0.30 (a factor of 2), to put the analyses in meaningful and comparable units. Furthermore, several vision variables were transformed so that higher log values indicated better vision on all measures (i.e., SKL, SKD, SDH, DesatCCS, and Glare Recovery were multiplied by −1). Given that I-AMD was the reference category, relative risk ratios (RRRs) with confidence intervals >1.0 would indicate poorer vision in I-AMD than No-AMD or E-AMD groups.
Multinomial logistic regression with GEE (both unadjusted and adjusted for age and sex) was calculated for all eye-specific variables (i.e., eight continuous vision measures and one categorical variable: whether or not the eye had undergone cataract surgery). Due to multicollinearity (several of the vision measures assessed are significantly correlated), variance inflation factors (VIFs) were examined, and vision variables with VIF > 2.5 were excluded from the multivariable analysis.Citation59 Age, sex, and all statistically significant variables (with VIF < 2.5) were included in the multivariable model.
and present the results of the multinomial logistic regression with GEE analysis for I-AMD vs. E-AMD, and for I-AMD vs. No-AMD, respectively. Age, sex, cataract surgery, and Glare Recovery were not significantly associated with I-AMD group membership for any of the models.
Table 3. Multinomial Logistic Regression with General Estimating Equation (GEE) Analysis of the Association between Vision Variables for I-AMD vs. E-AMD
Table 4. Multinomial Logistic Regression with General Estimating Equation (GEE) Analysis of the Association between Vision Variables for I-AMD vs. No-AMD
Column Aof each table presents the univariate unadjusted results. For I-AMD vs. E-AMD (), high contrast acuity (SKL), low contrast, low luminance acuity (SKD), contrast sensitivity at high and low luminance (CS and CS_low lumin), shape discrimination hyperacuity (SDH) and colour discrimination (DesatCCS) were statistically significant. For I-AMD vs. No-AMD (), CS, CS_low lumin, SDH, DesatCCS, and IReST reading rate were statistically significant.
Although age and sex were not statistically significant, separate analyses were repeated on the predictor variables, controlling for age and sex (see column B of and ). Not surprisingly, the pattern of results is the same for the individual variables in these models. Controlling for age and sex did not change the results from the univariate analyses.
As expected, multicollinearity was a concern for the multivariable analysis. In particular, three variables with variance inflation factors (VIFs) >2.5 (SKD = 3.36, CS = 2.54, and CS_low lumin = 3.09) made it necessary to exclude correlated measures. CS was more highly associated with I-AMD in the age- and sex-adjusted models, so SKD and CS_low lumin were excluded from the multivariable model.
Column C of and presents the multivariable model of the multinomial logistic regression with GEE analysis for I-AMD vs. E-AMD and I-AMD vs. No-AMD, respectively. In both multivariable models, age, sex, and all variables associated with I-AMD status at p < .05 (and excluding SKD and CS_low lumin, due to multicollinearity) were included in the multivariable model. For I-AMD vs. E-AMD, CS, SDH, and DesatCCS were the only statistically significant variables (, Column C). For I-AMD vs. No-AMD, these variables along with SKL and IReST were significant (, Column C).
Interestingly, in the l-AMD vs. No-AMD multivariable model whereas the relationship between IReST and I-AMD is in the expected direction (i.e., I-AMD participants had slower reading times than No-AMD), the association for high contrast acuity (SKL) was in the opposite direction in the multivariable statistical model. That is, when the model contained BOTH IReST and SKL, the coefficient associated with SKL suggests BETTER acuity in I-AMD than No-AMD participants. This is likely due to the fact that the IReST text size depended on acuity. In order to maintain acceptable acuity reserve,Citation51,Citation52 participants with poorer high contrast acuity were tested with larger print size IReST charts than those with better acuity. For I-AMD, only 62.1% were tested with the smallest size IReST (1.0 M, or 0.4 logMAR), whereas 81.0% of the No-AMD participants (and 87.7% of E-AMD) were tested with this text size.
I-AMD individuals who have slightly reduced acuity read more slowly than those with better acuity, even though the text is scaled to provide adequate acuity reserve. On the other hand, No-AMD participants with slightly reduced acuity appear able to take advantage of the increased text size and read at least as fast as those with better acuity. The dependence of reading speed on acuity is in different directions for the two groups.
This was investigated further by performing Wald Test for Nested GEE models (to determine whether the inclusion of the SKL X IReST interaction term significantly improved in the statistical model). Although the inclusion of the SKL X IReST interaction did not significantly improve model, the interaction term approached statistical significance (Wald Statistic = 5.34, p = .07). Furthermore, in a model that included age, sex, SKL, CS, SDH, DesatCCS, IReST, and the SKL X IReST interaction term, SKL, and the interaction term were no longer statistically significant, leaving only CS, SDH, DesatCCS, and IReST.
Discussion
The goal of the study, for which we report the baseline findings here, is to identify tests that are both sensitive indicators of vision function in the earliest stages of AMD and predictors of disease progression. Tests were selected to be suitable for use in a clinical setting (i.e., rapid, easy to administer reliably, and not require expensive or large equipment, nor a special laboratory-like setting for measurement). To that end, several clinically practical vision tests were used to assess and compare function in eyes with No-AMD, E-AMD, and I-AMD, as defined by the Beckmann Classification system.Citation42
The majority of participants in the current study tended to be at the mild end of the E-AMD and I-AMD classifications. Only a minority (26%) of the E-AMD eyes had multiple medium drusen in the central one disc diameter of the fovea. Only 35% of our I-AMD eyes had both large drusen and pigment abnormalities. Eyes with both large drusen and pigment abnormalities are at greater risk of progression to the advanced AMD than those with large drusen alone.Citation42 Furthermore, we have reported that large drusen and pigmentary changes are associated with poorer visual function than large drusen alone on some of the non-standard tests used here.Citation60
The vision measures were selected, in part, on the basis of their reported sensitivity to the “early” stage AMD, but note the considerable overlap of the No-AMD and E-AMD distributions in each panel of and 2. The apparent inconsistency between this and earlier studies lies in the differences in terminology and definitions of “early AMD”, with many of the earlier reports having included in this category eyes that would be classified as “intermediate AMD” by the Beckman Classification system.Citation42 For example, Midena et al.Citation28 reported reduced contrast sensitivity across a range of spatial frequencies in “early AMD”. However, many eyes in that study had characteristics consistent with AMD more advanced than the definition of E-AMD eyes used here, including focal hyperpigmentation in the study eye and GA of the fellow eye. Kleiner et al.Citation18 excluded eyes with any fundus changes other than drusen, and reported decreased contrast sensitivity in early AMD. Nevertheless, many participants had retinal changes, including CNV and previous laser surgery in the fellow eye that had been excluded from the study. Late AMD in the fellow eye (as opposed to early or intermediate AMD in both eyes) is associated with poorer function in early AMD eyes.Citation25
Feigl et al.Citation23 report significant differences in contrast sensitivity (Pelli-Robson Chart), colour vision assessed with the Lanthony Desaturated D-15, and SKILL score between “early AMD” and eyes without AMD. However, their early AMD group also included eyes that would be classified as I-AMD by the current definition. In contrast, Owsley et al.Citation30 who defined early AMD as the grade of 2, 3, or 4 in the 9-step AREDS systemCitation61 and thus included individuals with large drusen or pigment changes, found no differences in contrast sensitivity between that group and participants with normal macular health (defined as drusen <125 micron). Maynard et al.Citation34 report reduced contrast sensitivity at mesopic, but not photopic, luminance in a group that included 13 early and eight intermediate AMD eyes; it is not known to what extent the latter group contributed to the finding of the difference between AMD and control eyes. Thus, whereas alterations in a variety of vision functions in eyes with early AMD have been reported, the definition of early AMD used in those studies has typically included eyes that would be classified as more severe by the Beckman ClassificationCitation42 used here.
Eyes classified as I-AMD by the Beckmann Classification systemCitation42 had significantly poorer function on many vision measures than E-AMD or No-AMD eyes. These findings are consistent with previous reports based on eyes with similar retinal AMD characteristics, as noted above. The impairment in colour vision in I-AMD found in the present study is consistent with the findings of Collins and BrownCitation62 who showed that eyes with pigmentary abnormalities and “any number of hard drusen” performed worse on the Farnsworth desaturated D-15 than eyes classified as normal. Consistent with the current results, those authors did not find a significant difference in glare recovery time between these two groups. Dimitrov et al.Citation24 reported delayed glare recovery, but their “early AMD” study included some eyes with AMD more advanced than the I-AMD group in the present study. Further, their acuity criterion was less stringent, including eyes with acuity as poor as 20/60, and 29.6% of the study eyes had late AMD in the fellow eye.
CS, DesatCCS, and SDH remain in and are significant contributors to the multivariable associative models for both I-AMD vs. E-AMD and I-AMD vs. No-AMD. As noted in , CS showed the strongest association with I-AMD, but the wider 95% confidence interval indicates less precision in this predictor variable than either DesatCCS or SDH. The fact that the three measures were all significant independent predictors in the multivariable models suggests that they are measuring different mechanisms, and perhaps reflect different sorts of pathology.
The vast majority (87.3%) of the defects identified by the desaturated D-15 in I-AMD participants were tritan (B/Y) defects, consistent with earlier reports in the early stages of AMD. This is not surprising given the known vulnerability of the S-cone system to retinal disease including AMD.Citation63 On the other hand, S-cones comprise only a small percentage of all cones and fine spatial vision, including the shape discrimination hyperacuity measureCitation45 used here, is largely mediated by the other two cone classes, the M- and L-cones, which comprise 95% of cones. It has been suggested that optimal performance on the SDH test involves global pooling of information over a large area,Citation64-67 which would be impacted by the inhomogeneity of retinal morphology in I-AMD.
The current version of the commercial SDH test (MyVisionTrak®) is a four-alternative forced-choice (4AFC) test, whereas that version was not available at the time this study began. However, Ku et al.Citation68 compared the performance of N = 160 normal participants on the 3AFC vs. 4AFC versions of the SDH, and found no significant differences in threshold obtained or test usability or preference.
The reading test (IReST) used in this study showed a significant association in the I-AMD vs. No-AMD GEE model, but not for I-AMD vs. E-AMD. As was the case for CS, the wider confidence intervals for IReST in the I-AMD vs. No-AMD analysis suggests less precision than other vision variables. Additionally, the test, as conducted here, requires more preparation work on the part of the clinician (i.e., ensuring that text size used for each patient provides an adequate acuity reserve), recording reading performance for later analysis (or scoring and timing “on the fly”, which would be more prone to errors). Although IReST reading may be useful in research on I-AMD, as a quick, clinical test, it is likely impractical.
In summary, CS, SDH, and the DesatCCS are simple, rapid clinically feasible tests that show good sensitivity to I-AMD. These tests likely require global processes, and thus pooling of retinal signals across the retina, which may contribute to their sensitivity. Although these measures are significantly associated with I-AMD status, it remains to be seen whether they can predict which participants will develop advanced AMD.
Conflicts of interest
None of the authors have any proprietary interests or conflicts of interest related to this submission.
Acknowledgments
Funded by NIH EY023320 (to LAL) and by the Smith-Kettlewell Eye Research Institute. We also wish to thank all our study participants, West Coast Retinal Medical Group, Pacific Eye Associates, Rosa Rodriguez, Zelda Bosch, Meagan Mendoza, and Tiffany Giamanco for recruitment and scheduling; Vital Art and Science for software support; Kenneth Huie for technical assistance.
Additional information
Funding
References
- Mitchell P, Smith W, Attebo K, Wang JJ. Prevalence of age-related maculopathy in Australia. The blue mountains eye study. Ophthalmol. 1995;102(10):1450–1460. doi:10.1016/S0161-6420(95)30846-9.
- Vingerling JR, Dielemans I, Hofman A, et al. The prevalence of age-related maculopathy in the Rotterdam Study. Ophthalmol. 1995;102(2):205–210. doi:10.1016/S0161-6420(95)31034-2.
- Colijn JM, Buitendijk GHS, Prokofyeva E, et al. Prevalence of age-related macular degeneration in Europe. The past and the future. Ophthalmol. 2017;124(12):1753–1763. doi:10.1016/j.ophtha.2017.05.035.
- United States Census Bureau. An aging nation: the older population in the United States: population estimates and projections ( Released May, 2014). Accessed 15 June 20 https://www.census.gov/prod/2014pubs/p25-1140.pdf
- National Eye Institute (NEI). Age-related macular degeneration (AMD) tables: projections for AMD (2010-2030-2050). Accessed 15June20 https://www.nei.nih.gov/learn-about-eye-health/resources-for-health-educators/eye-health-data-and-statistics/age-related-macular-degeneration-amd-data-and-statistics/age-related-macular-degeneration-amd-tables
- Brown DM, Michels M, Kaiser PK, et al. Ranibizumab versus verteporfin photodynamic therapy for neovascular age-related macular degeneration: two-year results of the ANCHOR study. Ophthalmol. 2009;116(1):57–65. doi:10.1016/j.ophtha.2008.10.018.
- Rofagha S, Bhisitkul RB, Boyer DS, Sadda SR, Zhang K. SEVEN-UP study group. Seven-year outcomes in ranibizumab-treated patients in ANCHOR, MARINA, and HORIZON: a multicenter cohort study (SEVEN-UP). Ophthalmol. 2013;120(11):2292–2299. doi:10.1016/j.ophtha.2013.03.046.
- Finger RP, Wickremasinghe SS, Baird PN, Guymer RH. Predictors of anti-VEGF treatment response in neovascular age-related macular degeneration. Surv Ophthalmol. 2014;59(1):1–18. doi:10.1016/j.survophthal.2013.03.009.
- Sacconi R, Corbelli E, Querques L, Bandello F, Querques G. A review of current and future management of geographic atrophy. Ophthalmol Ther. 2017;6(1):69–77. doi:10.1007/s40123-017-0086-6.
- Clemons TE, Milton RC, Klein R, Seddon JM, Ferris FL 3rd. Age-related eye disease study research group. risk factors for the incidence of advanced age-related macular degeneration in the age-related eye disease study (AREDS) AREDS report No. 19. Ophthalmol. 2005;112:533–539.
- Ferris FL, Davis MD, Clemons TE, et al. Asimplified severity scale for age-related macular degeneration. Arch Ophthalmol. 2005; 123(11): 1570–1574. AREDS Report No. 18
- Seddon JM, Silver RE, Kwong M, Rosner B. Risk prediction for progression of macular degeneration: 10 common and rare genetic variants, demographic, environmental, and macular covariates. Invest Ophthalmol Vis Sci. 2015;56(4):2192–2202. doi:10.1167/iovs.14-15841.
- Perlee LT, Bansal AT, Gehrs K, et al. Inclusion of genotype with fundus phenotype improves accuracy of predicting choroidal neovascularization and geographic atrophy. Ophthalmol. 2013;120(9):1880–1892. doi:10.1016/j.ophtha.2013.02.007.
- Shin KU, Song SJ, Bae JH, Lee MY. Risk prediction model for progression of age-related macular degeneration. Ophthalmic Res. 2017;57(1):32–36. doi:10.1159/000449168.
- Lovie-Kitchin J, Feigl B. Assessment of age-related maculopathy using subjective vision tests. Clin Exp Optom. 2005;88(5):292–303. doi:10.1111/j.1444-0938.2005.tb06713.x.
- Hogg RE, Chakravarthy U. Visual function and dysfunction in early and late age-related maculopathy. Prog Retin Eye Res. 2006;25(3):249–276. doi:10.1016/j.preteyeres.2005.11.002.
- Brown B, Lovie-Kitchin J. Contrast sensitivity in central and paracentral retina in age related maculopathy. Clin Exp Optom. 1987;70(5):145–148. doi:10.1111/j.1444-0938.1987.tb04234.x.
- Kleiner RC, Enger C, Alexander MF, Fine SL. Contrast sensitivity in age-related macular degeneration. Arch Ophthalmol. 1988;106(1):55–57. doi:10.1001/archopht.1988.01060130061028.
- Stangos N, Voutas S, Topouzis F, Karampatakis V. Contrast sensitivity evaluation in eyes predisposed to age-related macular degeneration and presenting normal visual acuity. Ophthalmologica. 1995;209(4):194–198. doi:10.1159/000310612.
- Collins MJ. Pre-age related maculopathy and the desaturated D-15 colour vision test. Clin Exp Optom. 1986;69(6):223–227. doi:10.1111/j.1444-0938.1986.tb04596.x.
- Applegate RA, Adams AJ, Cavender JC, Zisman F. Early color vision changes in age-related maculopathy. Appl Opt. 1987;26(8):1458–1462. doi:10.1364/AO.26.001458.
- Arden GB, Wolf JE. Colour vision testing as an aid to diagnosis and management of age related maculopathy. Br J Ophthalmol. 2004;88(9):1180–1185. doi:10.1136/bjo.2003.033480.
- Feigl B, Brown B, Lovie-Kitchin J, Swann P. Cone-mediated multifocal electroretinogram in early age-related maculopathy and its relationships with subjective macular function tests. Curr Eye Res. 2004;29(4–5):327–336. doi:10.1080/02713680490516198.
- Dimitrov PN, Robman LD, Varsamidis M, et al. Visual function tests as potential biomarkers in age-related macular degeneration. Invest Ophthalmol Vis Sci. 2011;52(13):9457–9469. doi:10.1167/iovs.10-7043.
- Dimitrov PN, Robman LD, Varsamidis M, et al. Relationship between clinical macular changes and retinal function in age-related macular degeneration. Invest Ophthalmol Vis Sci. 2012;53(9):5213–5220. doi:10.1167/iovs.11-8958.
- Mayer MJ, Spiegler SJ, Ward B, Glucs A, Kim CB. Foveal flicker sensitivity discriminates ARM-risk from healthy eyes. Invest Ophthalmol Vis Sci. 1992;33:3143–3149.
- Collins MJ, Brown B. Glare recovery and it’s relation to other clinical findings in age related maculopathy. Clin Vis Sci. 1989;4(2):155–163.
- Midena E, Degli Angeli C, Blarzino MC, Valenti M, Segato T. Macular function impairment in eyes with early age-related macular degeneration. Invest Ophthalmol Vis Sci. 1997;38:469–477.
- Owsley C, Jackson GR, White M, Feist R, Edwards D. Delays in rod-mediated dark adaptation in early age-related maculopathy. Ophthalmol. 2001;108(7):1196–1202. doi:10.1016/S0161-6420(01)00580-2.
- Owsley C, Huisingh C, Clark ME, Jackson GR, McGwin G Jr. Comparison of visual function in older eyes in the earliest stages of age-related macular degeneration to those in normal macular health. Curr Eye Res. 2016;41(2):266–272. doi:10.3109/02713683.2015.1011282.
- Wang YZ, Wilson E, Locke KG, Edwards AO. Shape discrimination in age-related macular degeneration. Invest Ophthalmol Vis Sci. 2002;43:2055–2062.
- Bedell HE, Tong J, Woo SY, House JR, Nguyen T. Orientation discrimination with macular changes associated with early AMD. Optom Vis Sci. 2009;86(5):485–491. doi:10.1097/OPX.0b013e31819fa6e2.
- Brown B, Zadnik K, Bailey IL, Colenbrander A. Effect of luminance, contrast, and eccentricity on visual acuity in senile macular degeneration. Am J Optom Physiol Opt. 1984;61(4):265–270. doi:10.1097/00006324-198404000-00006.
- Maynard ML, Zele AJ, Feigl B. Mesopic Pelli-Robson contrast sensitivity and MP-1 microperimetry in healthy ageing and age-related macular degeneration. Acta Ophthalmol. 2016;94(8):e772–8. doi:10.1111/aos.13112.
- Mayer MJ, Spiegler SJ, Ward B, Glucs A, Kim CB. Preliminary evaluation of flicker sensitivity as a predictive test for exudative age-related maculopathy. Invest Ophthalmol Vis Sci. 1992;33:3150–3155.
- Sunness JS, Massof RW, Johnson MA, Bressler NM, Bressler SB, Fine SL. Diminished foveal sensitivity may predict the development of advanced age-related macular degeneration. Ophthalmol. 1989;96(3):375–381. doi:10.1016/S0161-6420(89)32883-1.
- Eisner A, Klein ML, Zilis JD, Watkins MD. Visual function and the subsequent development of exudative age-related macular degeneration. Invest Ophthalmol Vis Sci. 1992;33:3091–3102.
- Sandberg MA, Weiner A, Miller S, Gaudio AR. High-risk characteristics of fellow eyes of patients with unilateral neovascular age-related macular degeneration. Ophthalmol. 1998;105(3):441–447. doi:10.1016/S0161-6420(98)93025-1.
- Luu CD, Dimitrov PN, Robman L, et al. Role of flicker perimetry in predicting onset of late-stage age-related macular degeneration. Arch Ophthalmol. 2012;130(6):690–699. doi:10.1001/archophthalmol.2012.277.
- Haegerstrom-Portnoy G, Schneck ME, Brabyn JA. Seeing into old age: vision function beyond acuity. Optom Vis Sci. 1999;76(3):141–158. doi:10.1097/00006324-199903000-00014.
- Folstein MF, Folstein SE, McHugh PR. “Mini-mental state”. A practical method for grading the cognitive state of patients for the clinician. J Psychiatr Res. 1975;12(3):189–198. doi:10.1016/0022-3956(75)90026-6.
- Ferris FL 3rd, Wilkinson CP, Bird A, et al. Clinical classification of age-related macular degeneration. Ophthalmol. 2013;120(4):844–851. doi:10.1016/j.ophtha.2012.10.036.
- Haegerstrom-Portnoy G, Brabyn J, Schneck ME, Jampolsky A. The SKILL card. An acuity test of reduced luminance and contrast. Smith-Kettlewell Institute Low Luminance. Invest Ophthalmol Vis Sci. 1997;38:207–218.
- Arditi A. Improving the design of the letter contrast sensitivity test. Invest Ophthalmol Vis Sci. 2005;46(6):2225–2229. doi:10.1167/iovs.04-1198.
- Wang YZ, He Y-G, Mitzel G, Zhang S, Bartlett M. Handheld shape discrimination hyperacuity test on a mobile device for remote monitoring of visual function in maculopathy. Invest Ophthalmol Vis Sci. 2013;54(8):5497–5505. doi:10.1167/iovs.13-12037.
- Adams AJ, Rodic R. Use of desaturated and saturated versions of the D-15 test in glaucoma and glaucoma suspect patients. In: Verriest G, ed.. Colour Vision Deficiencies VI: Proceedings of the Sixth Symposium of the International Research Group on Colour Vision Deficiencies Held at the Klinikum Der Freien Universität; (West) Berlin-Steglitz. 17-19 September 1981. The Hague: W. Junk Publishers; 1982:419–424.
- Adams AJ, Haegerstrom-Portnoy G. Color deficiency. In: Amos JF, ed.. Diagnosis and Management in Vision Care. Boston MA: Butterworths; 1987:671–713.
- Bowman KJ. Amethod for quantitative scoring of the Farnsworth Panel D-15. Acta Ophthalmol (Copenh). 1982;60(6):907–916. doi:10.1111/j.1755-3768.1982.tb00621.x.
- Vingrys AJ, King-Smith PE. Aquantitative scoring technique for panel tests of color vision. Invest Ophthalmol Vis Sci. 1988;29:50–63.
- Trauzettel-Klosinski S, Dietz K. IReST Study Group. Standardized assessment of reading performance: the new international reading speed texts IReST. Invest Ophthalmol Vis Sci. 2012;53(9):5452–5461. doi:10.1167/iovs.11-8284.
- Whittaker SG, Lovie-Kitchin J. Visual requirements for reading. Optom Vis Sci. 1993;70(1):54–65. doi:10.1097/00006324-199301000-00010.
- Cheong AC, Lovie-Kitchin JE, Bowers AR. Determining magnification for reading with low vision. Clin Exp Optom. 2002;85(4):229–237. doi:10.1111/j.1444-0938.2002.tb03042.x.
- Liang K-Y, Zeger SL. Longitudinal data analysis using generalized linear models. Biometrika. 1986;73(1):13–22. doi:10.1093/biomet/73.1.13.
- Hardin JW, Hilbe JM. Generalized Estimating Equations. 2nd. Boca Raton, FL: CRC Press, Taylor & Francis Group, 2013.
- Murdoch IE, Morris SS, Cousens SN. People and eyes: statistical approaches in ophthalmology. Br J Ophthalmol. 1998;82(8):971–973. doi:10.1136/bjo.82.8.971.
- Fan Q, Teo Y-Y, Saw S-M. Application of advanced statistics in ophthalmology. Invest Ophthalmol Vis Sci. 2011;52(9):6059–6065. doi:10.1167/iovs.10-7108.
- Touloumis A, Agresti A, Kateri M. R Package multgee: a Generalized Estimating Equations Solver for Multinomial Responses. Biometrics. 2013;69(3):633–640. doi:10.1111/biom.12054.
- Schneck ME, Haegerstrom-Portnoy G, Lott LA, Brabyn JA. Comparisons of panel D-15 tests in a large older population. Optom Vis Sci. 2014;91(3):284–290. doi:10.1097/OPX.0000000000000152.
- Allison P. When can you safely ignore multicollinearity? (September, 2012). Accessed 15 June 20 https://statisticalhorizons.com/multicollinearity
- Schneck ME, Lott LA, Haegerstrom-Portnoy G, et al. Visual function in eyes with intermediate age-related macular degeneration with and without retinal pigment abnormalities. Optom Vis Sci. Revised and resubmitted, 29 May 20.
- Davis MD, Gangnon RE, Lee LY, et al. The age-related eye disease study severity scale for age-related macular degeneration: AREDS report no. 17. Arch Ophthalmol. 2005;123(11):1484–1498.
- Collins M, Brown B. Glare recovery and age-related maculopathy. Clin Vis Sci. 1989;4(2):145–153.
- Haegerstrom-Portnoy G, Brown B. Two-color increment thresholds in early age related maculopathy. Clin Vis Sci. 1989;4(2):165–172.
- Wilkinson F, Wilson HR, Habak C. Detection and recognition of radial frequency patterns Vision Res. 1998;38(22):3555–3568. doi:10.1016/S0042-6989(98)00039-X.
- Hess RF, Wang YZ, Dakin SJ. Are judgments of circularity local or global? Vision Res. 1999;39(26):4354–4360. doi:10.1016/S0042-6989(99)00153-4.
- Jeffrey BG, Wang YZ, Birch EE. Circular contour frequency in shape discrimination. Vision Res. 2002;42(25):2773–2779. doi:10.1016/S0042-6989(02)00332-2.
- Loffler G, Wilson HR, Wilkinson F. Local and global contributions to shape discrimination. Vision Res. 2003;43(5):519–530. doi:10.1016/S0042-6989(02)00686-7.
- Ku JY, Milling AF, Pitrelli VN, Knox PC. Performance, usability and comparison of two versions of a new macular vision test: the handheld radial shape discrimination test. PeerJ. 2016;4:e2650. doi:10.7717/peerj.2650.