
ABSTRACT
Purpose
In Scotland, in 2002, the National Waiting Times Unit was launched to reduce NHS waiting times. This was accompanied by a series of waiting time targets across the NHS in Scotland. The purpose of this study is to analyse changes in equality of access to treatment by socioeconomic deprivation associated with this initiative.
Methods
Trends in annual cataract rates were calculated using secondary care admissions’ Scottish Morbidity Record (SMR01) data on NHS funded elective cataract procedures for patients treated in Scotland from 01 April 1997 to 31 March 2019. An interrupted time series model was used to analyse socioeconomic differences in waiting times by deprivation quintile over three time periods; pre and post waiting time initiative, and post austerity.
Results
Cataract Surgical Rates more than doubled from 3,723 per million population in 1997/1998 to 7,896 per million population in 2018/2019. Mean waiting time fell from 129.5 days in 1997/1998 to 87.7 days in 2018/2019. Inequality in mean waiting time between most and least deprived cataract patients increased by 1.34 days per quarter between 01 April 1997 and 30 June 2002 and following the waiting time initiative fell by 0.41 days per quarter through to 31 March 2010; and then decreased by 0.002 days per quarter between 01 April 2010 and 31 March 2019.
Conclusion
The waiting time initiative had a major impact on reducing inequality in waiting times between socioeconomic groups. The onset of austerity in 2010 was associated with a very small and insignificant increase in inequality.
Introduction
Cataract surgery is the most frequently performed surgical procedure in the UK with around 452,000 cataract operations undertaken in England in 2018–19. Citation1 NHS Scotland funded 35,777 cataract operations with a rate of 3,533 per 100,000 in 2017/18 in patients aged 65 years and over. Citation2
Throughout the 1970s and 1980s surgery usually required in-patient care, often with general anaesthesia and an extended period of convalescence.
The rapid transition to phacoemulsification and increased speed of visual recovery, good refractive outcomes and lower complication rates meant that surgeons operated on patients with better pre-operative vision and with a good expectation of improving vision. A study of eight NHS departments in England showed visual impairment pre-operatively has decreased with 45% of patients in 2003 having visual acuity in the operated eye of 6/12 or more compared to 27% six years earlier and 7% in 1990.Citation3 The proportion of patients having cataract extraction by phacoemulsification rose from less than 4% in 1990Citation3 to 77% by 1997 with 70% of cataract operations completed as day cases.Citation4 By 2003 over 99% of cataract patients underwent day case phacoemulsification.Citation3
There was over a three fold increase in rates of treatment in England from 1,730 per million population in 1989 to 6,370 per million in 2004.Citation5 The number of people presenting to optometrists with cataracts in Scotland increased 2.6 fold from 168,060 in 2006/07 to 444,573 in 2017/18.Citation6 In 2017/18 community optometrists referred 86,203 patients with visually significant cataract to Scotland’s hospital eye services.Citation6
Findings from studies into equity of access to these rapidly expanding services are mixed. The most recent cataract audit of the Royal College of Ophthalmologists (RCOphth) National Ophthalmology Database 2015–2017 found only weak evidence of socioeconomic inequity in access to first eye cataract surgery.Citation7 Earlier data collected from more than 100 hospital eye units across the UK in 1997 showed women were waiting on average 9 days longer for cataract surgery than men and patients aged 85 years and over were waiting on average 24 days longer than patients aged 50–54 years.Citation4 However an analysis of the English Longitudinal Study of Ageing (ELSA) 2002 to 2010 showed no evidence of an association between a patient’s wealth, measured as net total non-pension wealth at household level including house equity and savings and uptake of cataract surgery.Citation8 We found no peer-reviewed studies evaluating Scotland’s cataract surgical programme with respect to equity of access.
Action on Cataracts, was launched by the Department of Health in England in January 2000, to improve access to cataract surgeryCitation9 with the aim of streamlining and standardising the patient experience and separating off cataract surgery from other eye operations. Good practice to be generalised included widespread use of phacoemulsification; local anaesthesia; day case surgery and audit.Citation5 In addition to this, the Scottish Government set up the National Waiting Times Unit in 2002Citation10 and in February 2003, ‘Partnership for Care – Scotland’s Health White Paper’ stated that if “a patient is not treated by their local NHS within the National Guarantee, we will give them the right to be treated elsewhere.”Citation11 On 31 December 2003, the nationally guaranteed maximum waiting time for inpatient or day case treatment was set at nine months.Citation12
In 1990, 17% of UK patients were waiting a year or more from being listed for cataract surgery to admissionCitation13 and in 1997 the average waiting time was 7.4 months.Citation4 By 2003 in England, only 4.9% of patients waited a year or more for cataract surgery and the average wait had reduced to 5.9 months from clinic visit to surgery.Citation3
This study uses an interrupted time series to examine changes in mean waiting time between the least and most socioeconomically deprived NHS Scotland-funded cataract patients over three periods. The first period from 01 April 1997 to 30 June 2002 precedes the waiting time initiative; 01 July 2002 to 31 March 2010 the Scottish waiting time initiative; and 01 April 2010 to 31 March 2019 is the period of austerity.
The National Waiting Times Unit launched in Scotland in 2002 within the Scottish Executive’s health department was designed to reduce NHS waiting times.Citation10 The Unit was given the power to intervene when waiting times were deemed to be excessive in any one area with patients given the option of treatment elsewhere in the NHS or in the private sector. This was accompanied by a series of waiting time guarantees across the NHS in Scotland, from 274 days in December 2003 to 84 days in October 2012.
The purpose of this study is to analyse changes in equality of access to treatment by socioeconomic deprivation associated with the Scottish waiting time initiative. Our null hypothesis is that there will have been no effect on levels of inequality between the most and least socioeconomically deprived patients associated with this initiative.
Materials and methods
Data sources
An extract of secondary care admissions’ Scottish Morbidity Record (SMR01) data for NHS funded elective surgical procedures for patients treated in Scotland from 01 April 1997 to 31 March 2019 was approved and purchased at a cost of £4 151 from Information Services Division of NHS National Services Scotland.
Cataract procedures were defined as any patient episode where characters one to three or five to seven of any of main operation or the three other operation fields were one of C71, C72, C74 or C75, OPCS Classification of Interventions and Procedures (4th edition) codes. This follows the guidance in the Public Health Scotland Atlas of VariationCitation14 with one change; C73 was not included on the advice of the Royal College of Ophthalmologists as this refers to YAG capsulotomy which is a laser procedure to treat thickening of the membrane behind the implanted lens after a cataract. Bilateral operations were counted as two separate procedures.
Treatment rates
Cataract Surgical Rates (CSRs) were calculated using data for all ages as operation rates per million population per financial year (01 April to 31 March the following year) using mid-year populations drawn from Information Services Division Scottish Datazone files and from the National Records of Scotland, as the denominator. The mid-year population for 1997 was used for financial year 1997/1998, and so on. Crude rates and directly standardised rates by age group, adjusted to the European Standard Population 2013, were calculated separately.
Waiting times
Waiting time was defined as “the length of time which elapses between a patients name being placed on the inpatient/day case waiting list and the patient being admitted as planned”.Citation15 Patients were excluded if under 30 years of age, if no waiting time was recorded or if recorded waiting time was over three years.Citation16,Citation17
Small area level inequality was measured at Scottish Datazone level using Scottish Index of Multiple Deprivation (SIMD) population quintiles with SIMD quintile one (SIMD1) representing the 20% of the Scottish population living in the most socio-economically deprived areas and SIMD quintile 5 (SIMD5) the 20% in the least deprived areas. Information Services Division NHS Scotland guidance on “Practical advice on attaching deprivation measures to your files” was used to attach the appropriate SIMD measure for each year, thus: SIMD2004 was used for the years 1996 to 2003; SIMD2006 for 2004 to 2006; SIMD2009v2 for 2007 to 2009; SIMD2012 for 2010 to 2013; SIMD2016 for 2014 onwards.Citation18
Data were analysed using simple linear regression and an interrupted time series design with outcome “inequality in waiting time” calculated as the difference between the mean waiting times for patients in SIMD1 and SIMD5. The level and slope change model described by Wagner et al was used.Citation19 The main assumptions are, that without the intervention of the waiting time initiative and austerity, trends would continue unaffected and that no other external factors contributed to any observed changes.Citation20 It was assumed that population characteristics changed slowly enough to be captured by the underlying linear trend and consequently no adjustment for such confounders were made.Citation21
Analysis was conducted over three time periods: period one (01 April 1997 to 30 June 2002) – prior to the introduction of the waiting time initiative; period two (01 July 2002 to 31 March 2010) – during the waiting time initiative; and period three (01 April 2010 to 31 March 2019) – with the waiting time initiative continuing, the period of austerity and budget cuts. 01 July 2002 was chosen as start of the waiting time initiative; similarly 01 April 2010 was chosen as the start of austerity.
The model was as follows:
D1-5 = a0 + a1T + a2LC1 + a3SC1 + a4LC2 + a5SC2
Where D = difference in mean waiting time between SIMD1 and SIMD5
T = time categorised in yearly quarters (1, 2, …, 88)
LC1 = level change 01 July 2002
SC1 = slope change 01 July 2002
LC2 = level change 01 April 2010
SC2 = slope change 01 April 2010
phase 1 (T = 1, …, 21) LC1 = 0, SC1 = 0, LC2 = 0, SC2 = 0; phase two (T = 22, …, 52) LC1 = 1, SC1 = T – 22, LC2 = 0, SC2 = 0; phase three (T = 53, …, 88) LC1 = 1, SC1 = T – 22, LC2 = 1, SC2 = T – 53.
The full model including time, level and slope changes was fitted and compared, using an F test, to the reduced model containing only level change terms.Citation22 Data were analysed using SAS version 9.4. Autocorrelation was checked for using the Durbin-Watson test and terms included at a significance level of p < .1. Heteroscedasticity was also checked for. Seasonality was accounted for as higher order autocorrelation.Citation23
Results
Over the 22-year period from 01 April 1997 to 31 March 2019, of the 646,219 elective patients who had cataract operations in hospitals in Scotland funded by NHS Scotland, 98.3% of operations were coded as C751 “Insertion of prosthetic replacement for lens NEC” (see supplementary file Table S1). There were 637,049 patients aged 30 years and over with a recorded waiting time less than three years between 01 April 2010 and 31 March 2019.
Trends in cataract surgical rate (CSR)
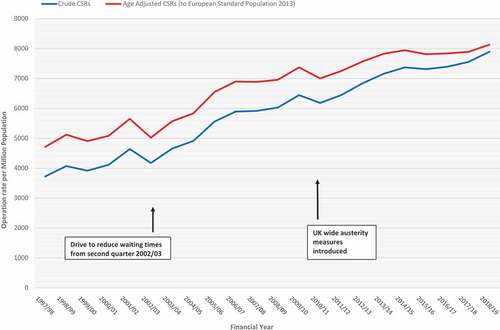
The crude CSR rose by 112% from 3,723 per million population in 1997/1998 to 7,896 per million population in 2018/2019, with the peak rate in 2018/2019 (see ). The age adjusted CSR rose from 4,710 per million population in 1997/1998 to 8,132 per million population in 2018/2019, with the peak rate in 2018/2019 (see ).
Figure 1. NHS Scotland Funded Elective Cataract Operations in Scotland 01 April 1997 to 31 March 2019. Cataract Surgical Rates All Ages Operations per Million Population by Financial Year of Operation. Data Source: Scottish Morbidity Record Information Services Division NHS Scotland (ISD)
Waiting times and inequalities
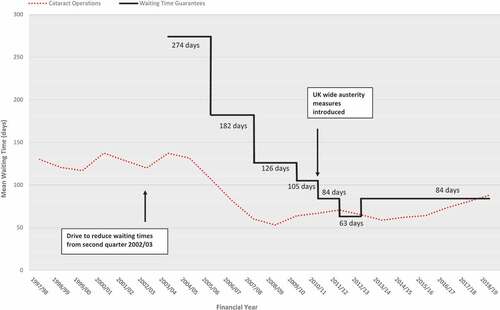
The mean waiting time for cataract patients aged 30 years and over fell by 32.3% from 129.5 days in 1997/1998 to 87.7 days in 2018/2019 – the lowest mean waiting time was in 2008/09 at 53.1 days (a fall of 59.0% from 1997/1998), (see ).
Figure 2. NHS Scotland Funded Elective Operations in Scotland 01 April 1997 to 31 March 2019. Mean Waiting Times by Financial Year of Operation *. Cataract Operations (Patients Aged 30 Years and Over). Data Source: Scottish Morbidity Record Information Services Division NHS Scotland (ISD). * - Waiting time guarantees for “the length of time which elapses between a patients name being placed on the inpatient/day case waiting list and the patient being admitted as planned” were set at: 274 days (target came into effect 31/12/2003); 182 days (31/12/2005); 126 days (31/12/2007); 105 days (31/03/2009); 84 days (31/03/2010); 63 days (31/03/2011); 84 days (01/10/2012). (13, 14)
The full model including level and slope terms fitted the data better than the model with only level terms (p < .0001). The data demonstrated evidence of positive first order autocorrelation (p < .0001). There was no evidence of heteroscedasticity. (see supplementary file Table S2, S3 & S4)
Inequality in mean waiting time for cataract patients increased by 1.34 days per quarter between 01 April 1997 and 30 June 2002; decreased by 0.41 days per quarter between 01 July 2002 and 31 March 2010; and decreased by 0.002 days per quarter between 01 April 2010 and 31 March 2019 (see and ).
Figure 3. NHS Scotland Funded Elective Cataract Operations Delivered in Scotland 01 April 1997 to 31 March 2019. Observed and Predicted Difference in Mean Waiting Times: Scottish Index of Multiple Deprivation Quintiles of Patients by Financial Year of Operation Quarters, Most Deprived minus Least Deprived. Patients Aged 30 Years and Over Modelled as Interrupted Time Series Adjusted for First Order Autocorrelation. Data Source: Scottish Morbidity Record Information Services Division NHS Scotland (ISD).
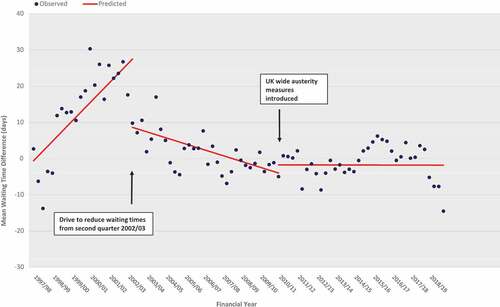
Table 1. Cataract Operations (30 years and over). Slopes and level and slope changes. Mean waiting time difference between least and most deprived quintiles by financial year of operation quarters. Modelled as interrupted time series adjusted for first order autocorrelation. NHS Scotland funded elective treatments in Scotland. Data Source: Scottish Morbidity Record Information Services Division NHS Scotland (ISD) 01 April 1997 to 31 March 2019.
There was a significant slope change at 01 July 2002 of −1.74 (−2.42, −1.07) days per quarter and at 01 April 2010 a non-significant slope change of 0.40 (−0.02, 0.83) days per quarter. There was a significant level change at 01 July 2002 of −18.87 (−27.26, −10.48) days per quarter and at 01 April 2010 a non-significant level change of 2.24 (−4.94, 9.43) days per quarter.
Discussion
This study found a significant association between the NHS Scotland waiting time initiative and reductions in inequality between socioeconomic groups in waiting times. Prior to the introduction of the waiting time initiative on 01 July 2002, waiting time inequality was increasing to the detriment of patients living in the most deprived areas. This situation reversed and the modelling found both a sharp drop in inequality at 01 July 2002 and a steady decrease in inequality thereafter until 31 March 2010. From 01 April 2010 onwards, there was no change in inequality.
Other sources of inequality
Access to surgery may not be the only part of the patient pathway where inequality occurs with evidence that patients from different socioeconomic groups present for surgery at different stages of cataract. A study conducted in the Grampian region of Scotland in 2010 found more affluent groups of patients had better visual acuity prior to surgery than less affluent.Citation24 A survey of 8563 participants in the community in Norfolk, England between 2004 and 2011 found that people who were older, women and those with lower levels of education were more likely to have low vision.Citation25 In a study of Welsh eye units January to February 2000, the extent of visual loss before surgery correlated positively with social deprivation indices, suggestive of differential barriers to accessing services.Citation26 The recent Royal College of Ophthalmologists cataract audit found a dose response relationship between pre-operative visual acuity and social deprivation with the worst visual acuity among the most deprived 10% of patients prior to surgery.Citation7
There are also variations in outcomes following cataract surgery. Younger patients tend to have better outcomes in terms of visual acuity than older patients.Citation27 One study found the oldest age group of patients (90 years and over) four times more likely to have poor visual outcome on discharge from hospital and 1.6 times more likely to have complications within 48 hours of surgery than younger patients aged 50–59 years.Citation27
Why no return to waiting time inequality after 2010?
Our finding that cataract surgery waiting time inequality did not increase after April 2010 contrasts with our earlier published findings for elective hip and knee replacements in Scotland where austerity marked a return to the inequalities in waiting times witnessed prior to 2002.Citation28
There are a number of possible explanations for this. Over the past two decades cataract surgery has been relatively plentiful, with easy availability and accessibility via GPs and optometrists. In Scotland, as everyone is entitled to free eye tests and cataract surgery is accessed via optometrists in the main, most people of an age to get cataract will get seen by an optometrist at some point leading to a reasonable equity in “getting referred”. Uptake of those referrals and transition to surgery may not, therefore, be differentiating across socio-economic status divides sufficiently to produce demonstrable inequality. Hip and knee replacements on the other hand have a different referral route relying on GPs which may make access to surgery not quite so straightforward as may the higher cost of treatment in the private sector.
The number of privately funded cataract operations, which are much cheaper than hip and knee replacements, is unknown. Cataract operations are relatively affordable (from £2,040) compared to hip (from £12,060) and knee (from £9,000) replacements, according to figures from Spire Healthcare given to the Guardian in September 2021.Citation29
However, although the introduction of free eye examinations for everyone living in Scotland from 01 April 2016, increased access for all socioeconomic groups, the gap between high and low socioeconomic groups widened.Citation6,Citation30 The reason for this is unlikely to be related to service availability with the distribution of optometry practices relatively evenly spread across socio-economic areas.Citation31 There may be inequities not touched on by this study with higher levels of unmet need for cataract surgery in the poorer areas of Scotland.
Questions have been raised over whether there may now be overprovision in some areas of EnglandCitation32 and whether in Scotland, more affluent patients may be being exposed to an unfavourable balance of risk and benefit due to cataract surgery being undertaken prematurely.Citation24 A study of over-utilisation of cataract surgery in England in 2006, however was unable to come to any conclusions due to methodological issues in measuring the impact of cataract surgery on visual function and quality of life.Citation32
Prospects
The impact of the COVID pandemic is being felt across the UK with rising waiting lists for cataract surgery. The Scottish government is committed to reducing these within the NHS with an additional £1.75 million being made available to the NHS Golden Jubilee hospital to increase the number of cataract operations by 50% from around 8,000 operations a year in financial year 2020/21 to 12,000 in 2021/22.Citation33 It remains to be seen whether there is the shift to privately funded private healthcare that appears to be taking place in England.Citation29
Strengths and limitations
This study has not been able to account for need and has only analysed inequality between socioeconomic patient groups. Measurement of deprivation is at a geographical level and findings relate to the average level of deprivation for each particular datazone. Caution needs to be taken to avoid the ecological fallacy when making assertions about the effect of an individual patient’s level of deprivation.
Conclusion
The Scottish waiting time initiative had a major impact on reducing inequality in waiting times for cataract surgery between socioeconomic groups. The measures introduced post 2010 saw no significant change or increase in inequality. A research priority is to carry out a comparative analysis for England which introduced patient choice of both NHS and private provider between 2006 and 2008 thereby allowing a much greater role for the private sector. It will also be important to monitor the impact of COVID from March 2020 which has been accompanied by a significant increase in outsourcing of elective surgery to the private sector in both England and Scotland.
Supplemental Material
Download MS Word (205.5 KB)Disclosure statement
No potential conflict of interest was reported by the author(s).
Supplementary material
Supplemental data for this article can be accessed online at https://doi.org/10.1080/09286586.2022.2075900
Additional information
Funding
References
- Donachie PHJ, Sparrow JM National ophthalmology database audit. Year 5 Annual Report - The Fourth Prospective Report of the National Ophthalmology Database Audit. https://www.nodaudit.org.uk/u/docs/20/hqsrgmurnv/NOD%20Audit%20Full%20Annual%20Report%202020.pdf. August 2020. Accessed April 26 2022.
- Information Services Division NHS Scotland. Scottish Atlas of Healthcare Variation 2017/18. https://www.isdscotland.org/products-and-services/scottish-atlas-of-variation/. Accessed April 26 2022.
- Johnston RL, Sparrow JM, Canning CR, Tole D, Price NC. Pilot national electronic cataract surgery survey: I. Method, descriptive, and process features. Eye (Lond). 2005;19(7):788–794. doi:10.1038/sj.eye.6701644.
- Desai P, Reidy A, Minassian DC. Profile of patients presenting for cataract surgery in the UK: national data collection. Br J Ophthalmol. 1999;83(8):893–896. doi:10.1136/bjo.83.8.893.
- Keenan T, Rosen P, Yeates D, Goldacre M. Time trends and geographical variation in cataract surgery rates in England: study of surgical workload. Br J Ophthalmol. 2007;91(7):901–904. doi:10.1136/bjo.2006.108977.
- Information Services Division NHS Scotland. General Ophthalmic Services Statistics. 09 October 2018. https://www.isdscotland.org/Health-Topics/Eye-Care/Publications/2018-10-09/2018-10-09-Ophthalmic-Report.pdf?65156191588. Accessed April 26 2022.
- Johnston RL, Day AC, Donachie PHJ, Sparrow JM. The royal college of ophthalmologists’ national ophthalmology database study of cataract surgery: report 4, equity of access to cataract surgery. Eye (Lond). 2020;34(3):530–536. doi:10.1038/s41433-019-0524-x.
- Whillans J, Nazroo J. Equal access, (Un)equal uptake: a longitudinal study of cataract surgery uptake in older people in England. BMC Health Serv Res. 2014;14:447. doi:10.1186/1472-6963-14-447.
- NHS Executive. Action on Cataracts. Good Practice Guidance; Jan, 2000.
- BBC Scotland . Early warning system for NHS 08 Jan 2002. Available from: http://news.bbc.co.uk/1/hi/scotland/1748215.stm. Accessed April 26 2022.
- NHS Scotland. Partnership for care. Scotland’s health white paper 2003. http://www.sehd.scot.nhs.uk/publications/PartnershipforCareHWP.pdf. Accessed April 26 2022.
- Scotland A. Management of Patients on NHS waiting lists 2013. http://www.audit-scotland.gov.uk/docs/health/2013/nr_130221_nhs_waiting_lists.pdf. Accessed April 26 2022. London: Department of Health.
- Desai P. The national cataract surgery survey: III. Process features. Eye (Lond). 1993;7(Pt 5):667–671. doi:10.1038/eye.1993.153.
- Public Health Scotland. Scottish Atlas of Healthcare Variation 16 Oct 2019. https://www.isdscotland.org/products-and-services/scottish-atlas-of-variation/view-the-atlas/surgical-procedures.asp. Accessed April 26 2022.
- ISD National Services NHS Scotland. Health and Social Care Data Dictionary. https://www.ndc.scot.nhs.uk/Dictionary-A-Z/index.asp. Accessed April 26 2022.
- Cooper ZN, McGuire A, Jones S, Le Grand J. Equity, waiting times, and NHS reforms: retrospective study. BMJ. 2009;339:b3264. doi:10.1136/bmj.b3264.
- Laudicella M, Siciliani L, Cookson R. Waiting times and socioeconomic status: evidence from England. Soc Sci Med. 2012;74(9):1331–1341. doi:10.1016/j.socscimed.2011.12.049.
- NHS National Services Scotland Public Health & Intelligence. Deprivation guidance for analysts Version 3.2 February 2019. https://www.isdscotland.org/Products-and-Services/GPD-Support/Deprivation/. Accessed April 26 2022.
- Wagner AK, Soumerai SB, Zhang F, Ross-Degnan D. Segmented regression analysis of interrupted time series studies in medication use research. J Clin Pharm Ther. 2002;27(4):299–309. doi:10.1046/j.1365-2710.2002.00430.x.
- Kontopantelis E, Doran T, Springate DA, Buchan I, Reeves D. Regression based quasi-experimental approach when randomisation is not an option: interrupted time series analysis. BMJ. 2015;350:h2750. doi:10.1136/bmj.h2750.
- Lopez Bernal J, Soumerai S, Gasparrini A. A methodological framework for model selection in interrupted time series studies. J Clin Epidemiol. 2018;103:82–91. doi:10.1016/j.jclinepi.2018.05.026.
- Huitema BE. The Analysis of Covariance and Alternatives: Statistical Methods for Experiments, Quasi‐Experiments, and Single‐Case Studies. Second ed. New Jersey, USA: John Wiley & Sons, Inc.; 2011.
- SAS. Chapter 8. The AUTOREG Procedure. https://support.sas.com/documentation/onlinedoc/ets/132/autoreg.pdf. Accessed April 26 2022.
- Chua PY, Mustafa MS, Scott NW, Kumarasamy M, Azuara-Blanco A. Relationship between socioeconomic deprivation or urban/rural residence and visual acuity before cataract surgery in Northern Scotland. Eur J Ophthalmol. 2013;23(6):831–835. doi:10.5301/ejo.5000302.
- Yip JL, Luben R, Hayat S, et al. Area deprivation, individual socioeconomic status and low vision in the EPIC-Norfolk Eye Study. J Epidemiol Community Health. 2014;68(3):204–210.doi:10.1136/jech-2013-203265.
- Goyal R, Shankar J, Sullivan S. Referrals for cataract surgery: variations between different geographic areas within a Welsh Health Authority. Eye (Lond). 2004;18(8):773–777. doi:10.1038/sj.eye.6700724.
- Desai P, Minassian DC, Reidy A. National cataract surgery survey 1997-8: a report of the results of the clinical outcomes. Br J Ophthalmol. 1999;83(12):1336–1340. doi:10.1136/bjo.83.12.1336.
- Kirkwood G, Pollock AM 2022 . Socioeconomic inequality, waiting time initiatives and austerity in Scotland: an interrupted time series analysis of elective Hip and knee replacements and arthroscopies [published online ahead of print April 12, 2022]. J R Soc Med. doi:10.1177/01410768221090672.
- Kollewe J Private hospitals profit from NHS waiting lists as people without insurance pay out. The Guardian [Internet]. 18 Sep 2021. https://www.theguardian.com/society/2021/sep/18/private-hospitals-profit-from-nhs-waiting-lists-as-people-without-insurance-pay-out. Accessed April 26 2022.
- Dickey H, Ikenwilo D, Norwood P, Watson V, Zangelidis A. Utilisation of eye-care services: the effect of Scotland’s free eye examination policy. Health Policy. 2012;108(2–3):286–293. doi:10.1016/j.healthpol.2012.09.006.
- Legge R, Strang NC, Loffler G. Distribution of optometric practices relative to deprivation index in Scotland. J Public Health (Oxf). 2018;40(2):389–396. doi:10.1093/pubmed/fdx074.
- Black N, Browne J, van der Meulen J, Jamieson L, Copley L, Lewsey J. Is there overutilisation of cataract surgery in England? Br J Ophthalmol. 2009;93(1):13–17. doi:10.1136/bjo.2007.136150.
- Cataract Surgery (Waiting Time) - in the Scottish Parliament. 08 Sep 2021. https://www.theyworkforyou.com/sp/?id=2021-09-08.4.0&s=speaker%3A25119. Accessed April 26 2022.