
 ?Mathematical formulae have been encoded as MathML and are displayed in this HTML version using MathJax in order to improve their display. Uncheck the box to turn MathJax off. This feature requires Javascript. Click on a formula to zoom.
ABSTRACT
Purpose
To determine if vision impairment (VI) is associated with food insecurity among the United States (US) adults.
Methods
This is a cross-sectional study of US adults ≥18 years below a threshold of 150% poverty from the National Health Interview Survey (NHIS), years 2011–2018. Outcome measures included food insecurity status, based on response to the NHIS adult (10-item) food insecurity tool, either as a binary (food secure or insecure) or ordinal (high, marginal, low, and very low) variable. VI was defined as self-reported trouble seeing, even when wearing glasses or contact lenses. Multivariable logistic regression analyses adjusted for potential confounders examined associations between VI and food insecurity.
Results
Participants (N = 62075) were majority female (57%), White (62%), and non-Hispanic (74%). Of them, 16% reported VI and 28% were food insecure. In fully adjusted logistic regression models, adults with VI had 216% higher odds (95% CI = 2.01–2.31) of being food insecure than adults without VI. Further, there was a dose–response relationship between VI and food insecurity noted in a multinomial model: VI predicted 159% higher risk of marginal food security (95% CI = 1.44–1.75), 197% higher risk of low food security (95% CI = 1.80–2.16), and 295% higher risk of very low food security (95% CI = 2.69–3.22), as compared to high food security.
Conclusion
VI is associated with food insecurity, increasingly so among adults with highest levels of food insecurity in this national sample of low-income US adults. This data highlights the need for targeted interventions to address and reduce the burden of food insecurity among US adults with VI.
Introduction
Food security has long been considered central to health and well-being, and was enshrined as a human right by the 1948 Universal Declaration of Human Rights.Citation1 Yet, food insecurity, defined as the “limited or uncertain availability of nutritionally-adequate or safe foods or the inability to acquire personally-acceptable foods in socially-acceptable ways” poses significant challenges for millions of adults.Citation2,Citation3 Disability creates further vulnerabilities to experiencing food insecurity; across all age groups, adults with disabilities are more likely to live in food-insecure households than those without.Citation4,Citation5 Various disabilities have been found to increase the likelihood of food insecurity, including work-limiting health conditions, physical limitations, cognitive limitations, and hearing impairment.Citation6 In considering these constraints, the relationship between vision impairment (VI) and food insecurity remains poorly understood.
Food insecurity and VI likely have a complex and bidirectional relationship. Kolli et al.Citation7 recently established a dose–response relationship between worsening food insecurity and VI in the United States (US). One potential reason for the relationshipCitation7 is the association between food insecurity and poor dietary quality, with the latter resulting in VI; this hypothesis has been established in low vision states including diabetic retinopathy and cataract.Citation8,Citation9 Alternately, and likely simultaneously, VI could result in food security, along two likely pathways. First, a poor diet may result from challenges adults with VI face in activities of daily living, including acquiring groceries (e.g. absence of facilities, inadequate assistance) and preparing food (e.g. peeling, slicing, frying).Citation10 Second, VI is associated with un- and under-employment, lower income levels, and lack of private health insurance,Citation11,Citation12 which may increase food insecurity by reducing access to food and health care.
Understanding the relationship between VI and food insecurity is critical to creating targeted interventions to support vulnerable populations and to affirm this human right. To date, no study has directly assessed whether VI is associated with food insecurity among a low-income US adult population. Food insecurity assessments among low-income adults is necessary to evaluate the efficacy of food assistance programs established to mitigate food insecurity in this population.Citation13,Citation14 Here, we tested the association between VI and food insecurity among a nationally representative sample of low-income National Health Interview Survey (NHIS) participants over an eight-year period.
Materials and methods
Study population
Approval by the Johns Hopkins School of Medicine Institutional Review Board approval was not required as NHIS data are de-identified and publicly available. The study adhered to the tenets set up by the Declaration of Helsinki. Analyses included data from the NHIS, years 2011 to 2018, an annual cross-sectional survey conducted by the U.S. Centers for Disease Control and Prevention (CDC) and National Center for Health Statistics (NCHS).Citation15 It consists of self-reported responses from non-institutionalized Americans ≥18 years old. For this study, we restricted the study population to adults with household incomes below 150% of the U.S. poverty threshold to select adults at the greatest risk for food insecurity, as previously done.Citation14
Outcome measure
Food insecurity was captured by response to the NHIS Family Food Security Questionnaire.Citation15 Binary and ordinal food insecurity status over the past 30 days was measured using a previously validated 10-item adult food insecurity tool.Citation16,Citation17, Ordinal food insecurity status was defined by composite score: a score of 0 corresponded to high food security, score of 1–2 to marginal food security, score of 3–5 to low food security, and score of 6–10 to very low food security. Binary food insecurity status was defined as either food secure (meeting criteria for high or marginal food security) or food insecure (meeting criteria for low or very low food security).
Primary predictor
Functional VI was defined as self-reported difficulty seeing. VI was determined by the Yes/No answer to the following question, “Do you have any trouble seeing, even when wearing glasses or contact lenses?” as previously done.Citation18
Other variables
Socio-demographic variables included age (continuous), gender (male/female), race (White, Black, American Indian/Inuit, Asian, Other/multiple race), ethnicity (Hispanic/non-Hispanic), and Poverty-income ratio (PIR). A poor PIR was classified as a score of <1.00 and a low PIR 1.00–1.5.Citation15 Other variables include NHIS survey year (2011 to 2018), educational attainment (high school or less, some college, and completed college or graduate degree) and US region (Northeast, Midwest, South, West). Health-related variables included diabetes status, smoking status, and body mass index (BMI) (underweight (BMI < 18.5), healthy weight (BMI = 18.5–24.9), overweight (BMI = 25.0–29.9), and obese (BMI 30)).Citation19 Diabetes status was determined by the Yes/No answer to the question: “Have you ever been told by a doctor or other health professional that you have any of the following: prediabetes, impaired fasting glucose, impaired glucose tolerance, borderline diabetes, or high blood sugar?” Smoking status was determined by the Yes/No answer to the question: “Have you smoked at least 100 cigarettes in your entire life?”.
Data analysis
Population characteristics were described by VI status using weighted percentages, and groupwise comparisons were performed using the χ2 tests for survey data. The distribution of food insecurity status by VI status was plotted in a figure. Survey-weighted, multivariable, logistic regression analyses examined associations between VI and food insecurity, adjusting for age, gender, race, ethnicity, educational attainment, region of the country, and PIR. Covariates were included based on clinical relevance and/or previous demonstration of impact on VI and food insecurity. The first logistic regression model examined any food insecurity (Yes/No), and the second multinomial regression model examined the degree of worsening food insecurity, ranging from very high to very low food security. We ran the following sets of sensitivity analyses for the binary and multinomial models to address potential confounding: (1) adding health-related variables-diabetic status, smoking status, and body mass index (BMI) category to the primary models, (2) adding the interaction terms between VI and race, VI and age categories, and VI and gender, to the primary models, (3) primary models including U.S. adults below 200% of the U.S. poverty threshold (a broader and less sensitive study population), and (4) primary models including all U.S. adults irrespective of PIR. All analyses accounted for the complex design of NHIS, using study weights that were calculated to account for data pooled across study years and a subpopulation (adults with household incomes below 150% of the U.S) of the entire survey population. The p-values were 2-sided and statistical significance was set at p < .05. Data analysis was conducted in Stata version 17.0 (StataCorp).
Results
Sociodemographic characteristics by VI status
The total population included survey responses from 62,075 low-income US adults, of whom 16% reported VI (N = 9,731), (). Most low-income adults identified as female (57%), White (62%), and non-Hispanic (74%). The sociodemographic characteristics were statistically different by VI status. As compared to low-income adults without VI, low-income adults with VI were older (≥75 years: 7% vs 12%), more likely to be female (56% vs 63%), White (62% vs 65%), not Hispanic (73% vs 79%), and diabetic (12% vs 27%).
Table 1. Sociodemographic characteristics of US low-income (<150% of the poverty threshold) adults stratified by vision impairment status, NHIS 2011–2018.
Association of VI with food insecurity
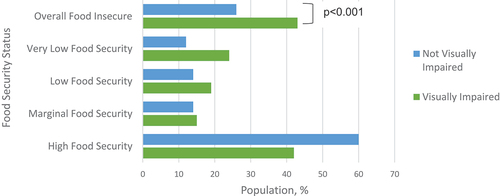
In unadjusted analyses, low-income adults with VI were more likely to be food insecure than low-income adults without VI (43% vs 26%, p < .001), and low-income adults with VI had higher levels of food insecurity (high food security: 42% vs 60%, marginal food security: 15% vs 14%, low food security: 19% vs 14%, very low food security: 24% vs 12%, p < .001) ().
Figure 1. Food insecurity status by vision impairment among low-income (<150% of the poverty threshold) US adults in the national health interview survey, 2011–2018.
In multivariable regression analysis, low-income adults with VI experienced more than double the odds (OR = 2.16, 95% CI, 2.01–2.31) of being food insecure than their peers without VI (). In multivariable multinomial regression analysis, there was a significant and dose-dependent relationship between VI and increasing food insecurity (). As compared to the high food security group, VI predicted 159% higher risk of marginal food security (95% CI, 1.44–1.75), 197% higher risk of low food security (95% CI, 1.80–2.16), and 295% higher risk of very low food security (95% CI, 2.69–3.22). Other associations of covariates with food insecurity are detailed in and include Black or American Indian/Inuit race, lower educational attainment, and lower poverty-income ratio.
Table 2. Multivariable logistic regression analysis: association of vision impairment and sociodemographic factors with any food insecurity among low-income (<150% of the poverty threshold) US adults, NHIS 2011–2018.
Table 3. Multivariable multinomial logistic regression analysis: association of vision impairment and sociodemographic factors with worsening food security among low-income (<150% of the poverty threshold) US adults, NHIS 2011–2018, (base outcome of High Food security).
In sensitivity analyses including health-related variables (diabetes, smoking, and BMI), results were similar. In additional sensitivity analyses testing for interactions between VI and race, VI and age categories, and VI and gender, the interaction terms were not statistically significant (p > .05). In models that included U.S. adults below 200% of the U.S. poverty threshold (a broader and less sensitive study population), results were similar. Finally, in models including the total NHIS population irrespective of PIR, the results remained similar.
Discussion
We examined the association between self-reported VI and food insecurity status among low-income US adults between 2011 and 2018 using nationally representative data. Our results support the notion that not only is VI associated with food insecurity, but also that this relationship operates in a dose-response manner with greater food insecurity. These findings highlight the importance of better connecting individuals with vision disability to food assistance programs and close food inequity gaps for this population. These findings are consistent with existing literature using the NHIS dataset identifying disability status as a predictor of food insecurity,Citation4 and build on those findings by focusing on vision disability.
Other significant predictors of food insecurity in this study included middle age, non-White race, lower educational attainment, and lower poverty-income ratio. Recent data has shown that the probability of living in a food-insecure household was 2.2% for young adults, 3.6% for working age adults, and 1.8% for older adults.Citation4 This may be due to age-based eligibility for social services at both ends of the life spectrum; for example, households with young children or older adults may be eligible for food assistance programs (without a work requirement), children for Medicaid, and older adults for Medicare and Social Security. Of note, in sensitivity analysis including the interaction term between VI and age category, the association between VI and food insecurity was not modified by age.
Further, our findings on socioeconomic disparities by income level parallel existing food insecurity literature.Citation20,Citation21 These findings may be driven by a combination of two factors, disability status and resource limitation. On disability status, adults with VI are known to face greater unemployment rates and lower income levels than adults without VI.Citation11 Compounding on that, low-income households often face resource limitations driven by financial strain. In such households, adults commonly report both food insecurity as well as cost-related medication underuse.Citation22 Medication underuse has the potential to worsen disability status, leading to a downward feedback cycle.
Establishing a significant association between VI and food insecurity highlights a role for targeted interventions to support especially vulnerable sub-populations. Our findings on racial disparities in food insecurity suggest that a particularly vulnerable cohort include Black or Native American adults who may experience the compounding effects of race-based inequities in relation to affording eye-care and overall health care.Citation20 This data reflects a historical trend; between 2001 and 2016, food insecurity rates for Black households were at least twice that of White households.Citation23 Identifying specific cohorts of adults most at risk for food insecurity is critical to tailor interventions, both within and beyond clinical spaces. In thinking about racial disparities in food insecurity, interventions may need to acknowledge determinants of structural barriers ranging from poverty to unemployment to incarceration.Citation24
The relationship between VI and food insecurity is an emerging area of active research. Recent literature among US adults has demonstrated that increasingly severe food insecurity is associated with a greater prevalence of VI.Citation7 In part, this may be attributable to the role that diet plays in human health. Diet has been linked directly to not only eye disease (e.g. worsening diabetic retinopathy,Citation8 cataractCitation9) but also chronic systemic disease that can result in associated eye disease (e.g. hypertension,Citation25 hypercholesterolemia). Here, we demonstrate that VI is significantly associated with food insecurity and operates in a dose–response manner with worsening food security status. VI may drive food insecurity due to challenges with not only acquiring and preparing food,Citation10,Citation26 but also the accessibility and affordability of healthcare and social services (e.g. transportation, navigating online platforms).Citation27 It is possible that VI and food insecurity have a bi-directional relationship and feed forward on one another; for example, research demonstrates that household food insecurity is positively associated with missing recommended eye examinations with diabetes, which then has the potential to worsen VI.Citation28
While this study addressed the association between VI and food insecurity among US adults, it is important to recognize the implications beyond individuals to households. In the US, nearly two in five households (equating to 67 million people, including 20.1 million children) in the lowest bracket of food security included an adult with a disability.Citation29 This phenomenon is not restricted to the US; research from South Korea demonstrated that household food insecurity is more prevalent among households including individuals with disabilities than those without.Citation5 In discussing food insecurity, it may be important to consider ways to support not only individuals with VI but also other members of their households.
Of note, this study population comprised of adults below a threshold of 150% poverty, to focus on individuals with relatively higher rates of food insecurity and those eligible for social services such as the largest federal food assistance program, Supplemental Nutrition Assistance Program (SNAP).Citation13 While data has shown that using SNAP can reduce food insecurity,Citation14 there is both stigma surrounding its use as well as state-by-state variability in the accessibility and flexibility in using this service.Citation27 For adults with VI, certain accessibility limitations (i.e. low contrast content, animation and movement) may impose substantial hurdles to enrolling in SNAP.
Not only does food insecurity lead to increased health care utilization, but also, addressing food insecurity may lower hospital utilization and healthcare expenditures. Adults with food insecurity, after adjusting for socioeconomic factors (e.g. gender, race, education, income, health insurance), have significantly more ED visits and inpatient admissions than their food secure counterparts.Citation30 Addressing food insecurity among older adults via food assistance programs such as SNAP have been associated with lower inpatient hospital utilizations.Citation31 For the models implemented in the state of Maryland, expanding SNAP access to nonparticipating eligible older adults in 2012 may have reduced annual inpatient hospital costs by $19 million.Citation31 Our findings of food insecurity in a low-income population eligible for food assistance programs indicates that these programs are falling short in their mission. Moving forward, mitigating the risk of food insecurity among low-income US adults involves not only addressing disabilities like VI in the clinical setting, but also advocating for the integration of medical and social services to facilitate access to food assistance.Citation23
There are limitations to this work to be kept in mind when interpreting the results. First, VI was defined based on self-report and not objectively measured visual function. Even so, self-reported visual functioning provides important insight into an individual’s perception of VI from a disability framework perspective and may impact food security irrespective of clinically assessed vision function.Citation24 Second, these are cross-sectional data, and longitudinal analyses are needed to examine the temporality of the relationship between VI and food insecurity. Lastly, we used a poverty threshold <150% and these analyses are not intended to be generalized to individuals with higher income levels. However, in sensitivity analyses including U.S. adults below 200% of the U.S. poverty threshold, as well as all U.S. adults, results were similar.
In conclusion, we found a significant and dose-dependent association between VI and food insecurity among low-income US adults between 2011 and 2018. Further, age, race, and PIR were also found to be significantly associated with food insecurity. These findings underscore the importance of creating targeted interventions and raising awareness of relevant social services in supporting food security as a human right in the context of living with disability.
Disclosure statement
None of the following authors have any proprietary interests or conflicts of interest related to this submission: Priyanka Kumar, Jessica Brinson, Jiangxia Wang, Laura Samuel, Bonnielin K. Swenor, Adrienne W. Scott, Varshini Varadaraj. This submission has not been published anywhere previously and is not simultaneously being considered for any other publication. This work was previously submitted to JAMA Ophthalmology, where they were unsure about the validity of self-reported data surrounding visual impairment; in keeping with a disability perspective, we have remained inclusive with our study criteria to include all adults with self-reported trouble seeing in this study. This work was also submitted to JAMA Network Open, where the subject matter was deemed to not meet their current editorial priorities.
Additional information
Funding
References
- Assembly UG. Universal declaration of human rights. UN General Assembly. 1948;302(2):14–25.
- Anderson SA, Anderson SA. Core indicators of nutritional state for difficult-to-sample populations. J Nutr. 1990;120(suppl_11):1555–1600. doi:10.1093/jn/120.suppl_11.1555.
- Coleman-Jensen AJ. US food insecurity status: toward a refined definition. Soc Inidic Res. 2010;95(2):215–230.doi:10.1007/s11205-009-9455-4.
- Brucker DL, Coleman-Jensen A. Food insecurity across the adult life span for persons with disabilities. J Disabil Policy Stud. 2017;28(2):109–118. doi:10.1177/1044207317710701.
- Park JE, Kim SY, Kim SH, Jeoung EJ, Park JH. Household food insecurity: comparison between families with and without members with disabilities. Int J Environ Res Public Health. 2020;17(17):6149. doi:10.3390/ijerph17176149.
- Heflin CM, Altman CE, Rodriguez LL. Food insecurity and disability in the United States. Disabil Health J. 2019;12(2):220–226. doi:10.1016/j.dhjo.2018.09.006.
- Kolli A, Mozaffarian RS, Kenney EL, Insecurity F. Vision impairment among adults age 50 and older in the United States. Am J Ophthalmol. 2022;236:69–78. doi:10.1016/j.ajo.2021.10.002.
- Dow C, Mancini F, Rajaobelina K, et al. Diet and risk of diabetic retinopathy: a systematic review. Eu J Epidemiol. 2018;33(2):141–156. doi:10.1007/s10654-017-0338-8.
- Mares JA, Voland R, Adler R, et al. Healthy diets and the subsequent prevalence of nuclear cataract in women. Arch Ophthal. 2010;128(6):738–749. doi:10.1001/archophthalmol.2010.84.
- Sahingoz SA. Visually impaired consumers and food shopping. Br J Hum Soc Sci. 2012;7(1):63–74.
- Kostyra E, Żakowska-Biemans S, Śniegocka K, Piotrowska A. Food shopping, sensory determinants of food choice and meal preparation by visually impaired people. Obstacles and expectations in daily food experiences. Appetite. 2017;113:14–22. doi:10.1016/j.appet.2017.02.008.
- Chai YX, Gan AT, Fenwick EK, et al. Relationship between vision impairment and employment. Br J Ophthalmol. 2021:2021–319655. doi:10.1136/bjophthalmol-2021-319655.
- Zebardast N, Friedman DS, Vitale S. The prevalence and demographic associations of presenting near-vision impairment among adults living in the United States. Am J Ophthalmol. 2017;174:134–144. doi:10.1016/j.ajo.2016.11.004.
- Tiehen L, Jolliffe D, Gundersen C. 2012 Alleviating Poverty in the United States: The Critical Role of SNAP Benefits . (USDA-ERS) Economic Research Report.
- Ratcliffe C, McKernan SM, Zhang S. How much does the supplemental nutrition assistance program reduce food insecurity? Am J Agric Econ. 2011;93(4):1082–1098. doi:10.1093/ajae/aar026.
- National Center for Health Statistics. 2018 National Health Interview Survey (NHIS) public use data release. ftp://ftp.cdc.gov/pub/Health_Statistics/NCHS/Dataset_Documentation/NHIS/2018/srvydesc.pdf Accessed 16 July 2022
- U.S. Department of agriculture economic research service. U.S. adult food security survey module - USDA ERS https://www.ers.usda.gov/media/8279/ad2012.pdf Accessed 16 July 2022
- U.S. Department of agriculture food and nutrition service. guide to measuring household food security. https://fns-prod.azureedge.us/sites/default/files/FSGuide.pdf
- Varadaraj V, Frick KD, Saaddine JB, Friedman DS, Swenor BK. Trends in eye care use and eyeglasses affordability: the US national health interview survey, 2008-2016. JAMA Ophthalmol. 2019;137(4):391–398. doi:10.1001/jamaophthalmol.2018.6799.
- Centers for Disease Control. About Adult BMI. https://www.cdc.gov/healthyweight/assessing/bmi/adult_bmi/index.html Accessed 16 July 2022
- Gundersen C, Ziliak JP. Food insecurity and health outcomes. Health Aff. 2015;34(11):1830–1839. doi:10.1377/hlthaff.2015.0645.
- Walker RJ, Garacci E, Dawson AZ, Williams JS, Ozieh M, Egede LE. Trends in food insecurity in the United States from 2011–2017: disparities by age, sex, race/ ethnicity, and income. Popul Health Manag. 2021;24(4):496–501. doi:10.1089/pop.2020.0123.
- Odoms-Young AM. Examining the impact of structural racism on food insecurity: implications for addressing racial/ethnic disparities. Fam Community Health. 2018;41(2):S3–S6.
- Alley DE, Asomugha CN, Conway PH, Sanghavi DM. Accountable health communities—addressing social needs through medicare and medicaid. N Engl J Med. 2016;374(1):8–11. doi:10.1056/NEJMp1512532.
- World Health Organization. Towards a common language for functioning, disability, and health: ICF https://www.who.int/classifications/icf/icfbeginnersguide.pdf Accessed 16 July 2022
- Sacks FM, Svetkey LP, Vollmer WM, et al. Effects on blood pressure of reduced dietary sodium and the dietary approaches to stop hypertension (DASH) diet. N Engl J Med. 2001;344(1):3–10. doi:10.1056/NEJM200101043440101.
- Samuel LJ, Xiao E, Cerilli C, et al. The development of the supplemental nutrition assistance program enrollment accessibility (SNAP-Access) score. Disabil Health J. 2022: 101366.
- Gibson DM, Gibson DM. Food Insecurity, Eye Care Receipt, and. Diabetic retinopathy among US adults with diabetes: implications for primary care. J Gen Intern Med. 2019;34(9):1700–1702. doi:10.1007/s11606-019-04992-x.
- Coleman-Jensen A, Nord M. 2013. Food insecurity among households with working-age adults with disabilities. (USDA-ERS) Economic Research Report.
- Berkowitz SA, Seligman HK, Meigs JB, Basu S. Food insecurity, healthcare utilization, and high cost: a longitudinal cohort study. Am J Manag Care. 2018;24:399.
- Samuel LJ, Szanton SL, Cahill R, et al. Does the Supplemental Nutrition Assistance Program affect hospital utilization among older adults? The case of Maryland. Popul Health Manag. 2018;21(2):88–95. doi:10.1089/pop.2017.0055.