
 ?Mathematical formulae have been encoded as MathML and are displayed in this HTML version using MathJax in order to improve their display. Uncheck the box to turn MathJax off. This feature requires Javascript. Click on a formula to zoom.
ABSTRACT
Because the circadian rhythm is different for each individual depending on what light environment they are exposed to on that day, the circadian rhythm needs to be constantly managed in everyday life. However, the typical circadian markers, changes in melatonin (MLT), and core body temperature (CBT) are difficult to measure 24-hour cycle of daily life. In this study, to propose relatively easy-to-monitor cardiac rhythmicity-related indicators as circadian markers, the biomarkers, including MLT, CBT, heart rate (HR), and heart rate variability (HRV), were collected from 22 Korean men. The MLT and CBT showed the largest positive correlation with R wave-to-R wave (RR) interval (Pearson’s r = .620, p < .001) and HR (Pearson’s r = .476, p < .001), respectively. In addition, the difference between the peak times of the seventh-order fitted MLT (adjusted R2 = .960, peak time 04:56) and RR interval (adjusted R2 = .960, peak time 04:35) was approximately 21 min; especially, the nadir times of the fitted CBT (adjusted R2 = .961, nadir time 04:55) and HR (adjusted R2 = .934, nadir time 04:52) were almost the same. Therefore, we can confidently say that HR and RR intervals are good indicators for estimating an individual’s circadian rhythm.
1. Introduction
The circadian rhythm is a biological signal with a period of approximately 24 hours. The suprachiasmatic nucleus (SCN) is the main clock of the circadian rhythm, responsible for the control of physiological and hormonal activities (Welsh et al. Citation2010). The SCN, which is located superior to the optic chiasm, receives external light information through intrinsic photosensitive retinal ganglion cells (ipRGCs) in the retina (Lockley and Gooley Citation2006). Unlike the pathway that recognizes color or brightness from light information, the pathway that affects biological patterns from information interpreted by SCN has been known to exhibit a non-visual or non-image forming (NIF) response (Güler et al. Citation2008). The ipRGCs act as sensors, accepting light in the NIF pathway; these melanopsin-containing ipRGCs show peak spectral sensitivity under short-wavelength blue light. Therefore, the NIF system, which is related with the circadian rhythm, shows responses to external light different from those of cone cells, which are part of the visual system with maximum sensitivity to mid-wavelength green light (Berson Citation2003). The dual function of the eyes according to light information and circadian rhythm evolved over a long period to allow humans to adapt to life patterns on Earth, where light/darkness periodically repeat. In modern times, however, the increase in artificial lightings and in display devices can cause confusion in light information received by the SCN during the nighttime, resulting in disturbances of circadian rhythms (Cho et al. Citation2015). These disorders of circadian rhythm lead to emotional, cognitive, and somatic problems (Foster and Wulff Citation2005). Especially, the delayed sleep phase syndrome (DSPS) due to genetic or environmental factors, unipolar/bipolar depression, and seasonal affective disorder (SAD) have been known as psychiatric diseases associated with disrupted circadian rhythm (Lam and Levitan Citation2000; Okawa and Uchiyama Citation2007; Zee et al. Citation2013; Hida et al. Citation2014; Patke et al. Citation2017; Melo et al. Citation2017). Furthermore, neurodegenerative diseases, such as Alzheimer’s and Parkinson’s diseases, have been reported to be related with the circadian rhythm (Videnovic et al. Citation2014). Therefore, it becomes more and more important to check and manage individual circadian rhythms in everyday life.
Representative markers of circadian rhythm are the core body temperature (CBT) and the level of melatonin (MLT) hormone. The CBT is a temperature of organs in deep structures of the body, and it normally oscillates over the day following circadian rhythm, with the lowest levels late at night and highest in the late afternoon. The CBT is usually measured in the esophagus, rectum, mouth, tympanum, and auditory meatus. Meanwhile, the MLT is a hormone released during nighttime by the pineal gland; it plays an important role in the regulation of sleep-wake cycles. MLT secretion starts early in the evening; its maximum occurs around the middle of the sleep period. The MLT hormone is detected in plasma, saliva, and urine. These two endogenous circadian markers are generated by a single central circadian pacemaker, SCN (Shanahan and Czeisler Citation1991). The maximum of the MLT rhythm is reached 1 ~ 2 hours before the nadir of the CBT rhythm (Dijk et al. Citation1999). The SCN acts on neural and endocrine pathways to regulate individual circadian rhythm; it synchronizes the rhythm in peripheral areas of the human physiology. The MLT production in the pineal gland is determined by the sympathetic nervous system and this MLT also exerts a negative feedback inhibition on the sympathetic system, which may represent a counter regulatory mechanism (Stehle et al. Citation2011).
This action helps to maintain physiological oscillation of variable functions including decline of blood pressure and heart rate (HR) at nighttime (Simko et al. Citation2016). The HR also shows a circadian pattern, with a morning acrophase and a nocturnal nadir. Nadirs in the circadian HR rhythm are attributed to times when the parasympathetic nervous system dominates the sympathetic one. Contrary to this, acrophases in circadian HR rhythm are ascribed to inverse shifts in the autonomic nervous system (ANS) balance (Monfredi and Lakatta Citation2019). Heart rate variability (HRV) is also considered a marker of ANS. HRV parameters are calculated based on the interval between two heartbeats and can be represented by the balance of the sympathetic-parasympathetic activity (Malik et al. Citation1996). The R wave-to-R wave (RR) intervals can be said to the most basic time domain HRV, and to be inversely related to HR. The time domain HRV indexes estimate high frequency (HF) variations in HR and thus are highly correlated. In addition, it is possible to estimate the influence of the regulation of the parasympathetic nervous system on the heart from these indexes (Malik et al. Citation1996). In addition, power spectral density analysis (frequency domain methods) provides information on how power distributes as a function of frequency.
Physiological circadian signals are correlated because the SCN uses the ANS and various endocrine links to communicate with the circadian oscillators in peripheral tissues. Therefore, if one knows the correlation between various circadian rhythms and reliably measures one of them, it is possible to predict the circadian phases of the other rhythms. In other words, through the rhythm of biomarkers that are relatively easy to measure, it is possible to estimate CBT and MLT levels, the classical circadian rhythm markers. Accordingly, we obtained over time the circadian rhythm markers CBT and MLT level, and their replacement markers, HR and HRV, from 22 healthy young adult subjects. The relationship between the conventional markers was investigated for the collected alternative parameters, and the peak/nadir times for each biomarker over time were confirmed through curve fitting.
2. Methods
2.1. Participants
Twenty-two healthy volunteers (mean age ± SD: 27.4 ± 4.36 years), who were free from medical, psychiatric, and sleep disorders, according to self-reported questionnaires, participated in this study, and there were no female participants. Especially, to accurately determine the relationship between circadian rhythms and HRV, individuals who are ingesting medications related to chronic, neurological disorders, or cardiovascular diseases, who had traveled internationally within 4 weeks of the study, and/or who had had overnight or rotating shift work within 3 months prior to the study were excluded. All 22 participants who applied to this study had no disqualification. The average bedtime and wake-up time of all participants a week prior to the study according to self-reported questionnaires were 00:55 ± 00:53 and 08:30 ± 01:25 (mean time ± SD), respectively. Prior to participating in the study, participants confirmed the research information, provided written informed consent, and participation fees were paid to participants after all procedures of the study were completed.
2.2. Experimental protocol
The study was performed in a clinical laboratory with controlled temperature and relative humidity at the Circadian ICT Research Center, Kookmin University (Seoul, Korea). One week prior to the study, regular and sufficient quality of sleep of participants was recorded by questionnaire, such as the Pittsburgh Sleep Quality Index (PSQI) (Buysse et al. Citation1989) and Karolinska Sleepiness Scale (KSS) (Åkerstedt and Gillberg Citation1990). Simultaneously, the participants were instructed to maintain a regular sleep-wake pattern prior to the study. The participants arrived at the laboratory before 10:00 on the first day, stayed two nights and three days in succession, and left at 12:00 on the third day (). During the study period, the participants were instructed to keep a fixed sleep (00:00) and wake (08:00) schedule. Illuminance and correlated-color temperature (CCT) of lightings in the laboratory were controlled by administrators according to time: from 08:00 to 18:00 as daytime lightings with illuminance and CCT of 500 lx and 5,000 K, respectively; from 18:00 to 00:00 as nighttime lightings with illuminance and CCT of 190 lx and 2,200 K, respectively; the lightings were shut off during the sleep. The lighting conditions were measured using a conventional illuminance spectrophotometer (CL-500A, Konica Minolta, Japan), as shown in . Participants spent time acclimating to lightings on the first day, and the data, including MLT level, CBT, and electrocardiogram (ECG), were collected from the second day. The participants were not allowed to go out and heavy exercise while in the laboratory; however, they were allowed to read books, listen to music, and use computers and smartphones with a blue light filter applied. In addition, using electronic devices that emit light was restricted from 18:00. All meals were served at the same time (08:00, 13:00, and 18:00) and were of the same food type. The study was conducted from January 2019 to December 2019, and the study protocol was approved by Kookmin University Institutional Review Board (KMU-201904-HR-203, 10 June 2019).
Figure 1. Experimental protocol. All participants lived in normal lighting environments (5,000 K, 500 lx) from 08:00 to 18:00, nighttime lighting environments (2,200 K, 190 lx) from 18:00 to 00:00, and slept from 00:00 to 08:00. The core body temperatures (CBT) and salivary melatonin (MLT) samples of each participant were obtained 21 times and 15 times, respectively, depending on the time from 12:00 on the second day to 12:00 on the third day. Electrocardiogram (ECG) of each participant was acquired consecutively from 12:00 on the second day to 12:00 on the third day.
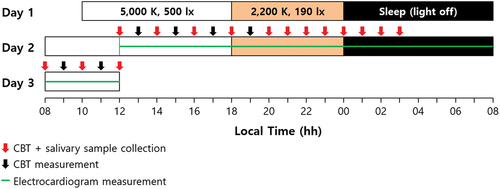
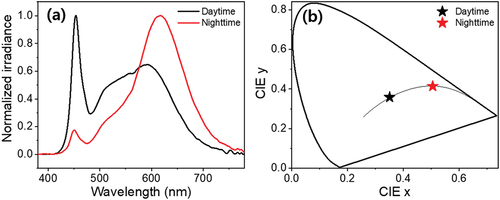
Figure 2. Lighting characteristics in clinical laboratory applied over time. (a) Normalized irradiance of daytime (from 08:00 to 18:00) and nighttime (from 18:00 to 00:00) lightings. Illuminances of daytime and nighttime were 500 lx and 190 lx, respectively. (b) 1931 CIE color coordinates of daytime and nighttime lightings. The correlated-color temperatures (CCTs) of daytime and nighttime were 5,000 K and 2,200 K, respectively.
2.3. Melatonin assay
Traditionally, MLT concentration in plasma has been used as a biomarker for circadian rhythm; however, the use of this measurement is limited due to problems related to the collection of multiple blood samples. The measurement of 6-hydroxymelatonin sulfate in urine has obvious constraints on the frequency of sampling because it usually takes a long inter-sample interval time of 2 to 4 hours. Although the salivary MLT level is generally lower than that of plasma MLT, it may be used as the circadian phase marker because of saliva and plasma MLT are significantly corrected (Voultsios et al. Citation1997). In this study, MLT levels of each subject were determined using a useful and non-invasive saliva sampling method (Touitou et al. Citation2009; Rzepka-Milgut and Paprocka Citation2020). Salivary MLT samples were collected during 24-hour sessions from 12:00 on the second day to 12:00 in the third day; all participants were required to provide approximately 2 mL of saliva samples directly into an individual sterile tube at each time point (a total of 15 time points) during the admission. All samples were kept frozen at −60 °C until assayed. The MLT levels were analyzed in duplicate using commercially available salivary MLT enzyme-linked immunosorbent assay (ELISA) kits (Salimetrics, Inc., USA), and a microplate reader (VersaMaxTM, Molecular Devices, USA). The lower and upper limit of detection for the ELISA kits were 0.78 pg/mL and 50 pg/mL, respectively, and the sensitivity of detection the kits was 1.37 pg/mL (Kennaway Citation2019). During the sampling period, the subjects were instructed to avoid caffeinated food and drinks, and the mean values of the duplicates were used for analyzing results.
2.4. CBT measurement
The infrared tympanic temperature underestimates the CBT obtained from the pulmonary artery, which is regarded as the gold standard, and is affected by various ear canal structures of the subject group, but it is relatively simple and reproducible (Lefrant et al. Citation2003). It has been reported that the infrared tympanic temperature is on average 0.38°C lower than the esophageal temperature and can be used for relative CBT measurement (Daanen Citation2006). Therefore, CBTs were recorded at 1-hour intervals according to the established protocol using an infrared tympanic temperature device (ThermoScan IRT 6520, Braun, Germany). The CBT measurements performed on the participants’ right ear can be easily biased depending on the measurement posture or method, and thus participants measured their CBT themselves, repeating the measurement once after a 2-second interval. The average values of the two measurements were used for analysis.
2.5. ECG and HRV parameter analysis
An ECG system (BIOPAC MP160, Biopac System Inc., USA) was used to record data from the 3-lead ECG for each subject. Three pre-gelled and self-adhesive Ag/AgCl electrodes were connected via leads to a BIOPAC Bionomadix wireless transmitter. During a 24-hour session starting at 12:00 on the second day, ECG data of standard lead II with a sampling rate of 500 Hz were obtained using this system in conjunction with AcqKnowledge 5.0 software. However, due to technical problems such as charging of the equipment, it was determined that the data for the first 2 hours for some subjects could not be used; thus, the 2-hour data of all subjects were excluded from the analysis – only data from 14:00 on the second day to 12:00 on the third day were analyzed.
In a continuous ECG record, the QRS complex is detected by ventricular depolarization; the interval between adjacent R waves is called the normal-to-normal (NN) or RR interval. Typically, the RR interval is used in HRV analysis because it is easy to calculate from the R wave with the highest potential value. To analyze HRV from the obtained ECG waveform, the RR tachograms for each participant were extracted using open-source MATLAB R2018b software (Vollmer Citation2019). To increase the signal-to-noise ratio (SNR) of the ECG signal, outliers and artifacts caused by physical activity were removed and the nonlinear trimmed average was applied, followed by average RR intervals of 5-min segments obtained for the pre-processed ECG waveform. As time domain HRV markers, the root mean square of successive differences (RMSSD) and proportion derived by dividing NN50 (pNN50), which is the number of pairs of successive NN that differ by more than 50 ms, by the total number of NN intervals were calculated using obtained RR tachograms and EquationEquations 1(1)
(1) and Equation2
(2)
(2) (Malik et al. Citation1996; Vollmer Citation2019).
The power spectral density was also calculated by performing fast Fourier transform (FFT) on the RR tachogram. Since FFT cannot be performed if there are missing RR intervals in this process, the missing 5-min segment mean RR intervals in the pre-process were interpolated by calculating the moving average. The power spectrum of the RR tachogram provides information in the frequency domain, such as the total power (TP), very low frequency (VLF, ≤0.04 Hz), low frequency (LF, 0.04 ~ 0.15 Hz), and HF (0.15 ~ 0.4 Hz) (Furlan et al. Citation1990; Malik et al. Citation1996; Stauss Citation2003). The HF is sensitive to respiratory rhythms and parasympathetic nerve activity and LF is related to changes in cardiac sympathetic nerve activity. More generally, the proportional LF (pLF) is used to minimize the effect on LF of changes in VLF. Furthermore, the LF-to-HF ratio (LF/HF) represents the balance between the sympathetic and parasympathetic contributions to HR regulation, such that a high LF/HF indicates a predominance of sympathetic activity in the regulation of HR (Vandewalle et al. Citation2007). The pLF and LF/HF can be calculated by EquationEquations 3
(3)
(3) and Equation4
(4)
(4) , respectively (Vollmer Citation2019).
2.6. Statistical analysis
All statistical analyses were performed using the IBM SPSS Statistic 25 program, and analysis results were represented as mean ± SEM. Seasonal variations in MLT (circadian) rhythms were identified prior to performing a correlation analysis between biomarkers. Participants were divided into two groups according to the date of admission (Group 1: 13 participants from June 2019 to August 2019; Group 2: 9 participants from October 2019 to December 2019). The 25% level of maximum MLT concentration of each participant was set as dim light melatonin onset (DLMO) (Benloucif et al. Citation2008), and the difference was confirmed through an independent two-sample t-test (significance threshold was p < .05). Pearson’s correlation coefficients for each marker were determined based on MLT and CBT using individual data from all subjects over an hourly interval. HR and HRV data per 5-min segment obtained from continuously measured ECG data were recalculated as hourly averages for time synchronization with MLT and CBT (14 points).
3. Results and discussion
During the 3-day experimental schedule, all subjects lived in two lighting environments with different CCTs and illuminances according to time of day. To determine the correct MLT concentration, it is recommended that saliva samples be taken in a dim light environment with an illuminance of less than 10 lx (Lockley Citation2020); however, in reality, we rarely spend time in such a dim light environment, except in special cases. In other words, this study was conducted in consideration of a realistic lighting environment, and all participants took part in the experiment in the equal light environments, even though participants’ melatonin may be partially suppressed. Meanwhile, MLT may have a seasonal phase difference between summer, with long daytime, and winter, with short daytime (Honma et al. Citation1992; Sato et al. Citation2013). Because endogenous MLT is secreted at night, the duration of MLT secretion is an important parameter indicative of the length of the daytime for tissues and organs involved in circadian rhythm (Arendt Citation1998). These seasonal variations can act as another variable for estimating circadian rhythm through other biomarkers. Therefore, it is necessary to verify whether the MLT data collected from the participants exhibit seasonal variation. summarizes the differences between the DLMO and MLT peak times of participants estimated using cubic spline according to the date of admission. The DLMO and MLT peak time of Group 2 were slightly delayed compared to those of Group 1; however, differences were not significant (DLMO p = .524 and MLT peak p = .121). Therefore, in the correlation analysis, all MLT data were utilized without a separate seasonal correction.
Table 1. DLMO and MLT peak times of participants according to date of admission. All data represented as mean ± standard deviation. MLT, melatonin; DLMO, dim light melatonin onset
summarizes the correlations between various indicators, including HRV of time and frequency domain, according to MLT level and CBT. This correlation analysis was conducted based on the individual MLT concentration, CBT, and HRV parameters of all 22 subjects at 14 salivary sampling points (N = 308). In particular, since the HR and HRV parameters are extracted from the subject’s ECG data, they may be influenced by the subject’s physical/mental health status (Scheer et al. Citation2010; Gubin et al. Citation2017a), age (Gubin et al. Citation2016), or the task that the subject is performing at the time that ECG readings are taken (Scheer et al. Citation2010; Gubin et al. Citation2017b). However, in this study, ECG data were obtained from healthy young adults after a period of acclimatization to the light, temperature, and sleep environments. In addition, because outliers or artifacts in ECGs due to subjects’ daily movements were removed during data processing, it is expected that this study’s level of bias is very slight. As shown in , there was a negative correlation between MLT concentration and CBT obtained at the same time period (Pearson’s r = −.540, p < .001). shows scatter plots between MLT and HRV parameters obtained at the same time period. MLT exhibited the largest positive correlation with RR interval (Pearson’s r = .620, p < .001). The correlation between the other HRV parameters and MLT was also significant; however, the absolute value of the other correlation coefficients was slightly lower than that of RR intervals. displays plots between CBT and HRV parameters under equal conditions. Although CBT had the largest correlation with MLT, it showed the largest positive correlation with HR (Pearson’s r = .476, p < .001). This is natural in view of a past study that estimated HR and resting CBT using a sigmoidal model (Looney et al. Citation2018). Particularly noteworthy is that the directions of correlation between the HRV parameters for MLT and CBT were opposite to each other. In other words, it can be said that higher MLT concentration resulted in lower CBT and slower HR (or faster RR interval); conversely, higher CBT resulted in lower MLT concentration and faster HR (or slower RR interval).
Table 2. Correlation between different biomarkers for melatonin and core body temperature. Correlation over the same time period for individual data for all 22 subjects (N = 308). ***p < .001. MLT, melatonin; CBT, core body temperature; HR, heart rate; RR, normal-to-normal (NN) intervals; RMSSD, root mean square of successive differences; pNN50, percentage of RR intervals that were greater than 50 ms different from preceding interval; LF/HF, ratio between low frequency (LF) and high frequency (HF); pLF, proportional LF
Figure 3. Scatter plot between the melatonin and core body temperature. The plot was obtained with individual data of all 22 participants collected at salivary sampling time from 14:00 on second day to 12:00 on third day (N = 308).
Figure 4. Scatter plot between the melatonin and (a) HR, (b) RR interval, (c) RMSSD, (d) pNN50, (e) LF/HF, and (f) pLF of HRV markers. The plots were obtained with individual data of all 22 participants collected at salivary sampling time from 14:00 on second day to 12:00 on third day (N = 308). All 5-min segment HRV data obtained from each participant’s ECG data were recalculated as an hourly average.
Figure 5. Scatter plot between the core body temperature and (a) HR, (b) RR interval, (c) RMSSD, (d) pNN50, (e) LF/HF, and (f) pLF of HRV markers. The plots were obtained with individual data of all 22 participants collected at salivary sampling time from 14:00 on second day to 12:00 on third day (N = 308). All 5-min segment HRV data obtained from each participant’s ECG data were recalculated as an hourly average.
It was confirmed that MLT concentration and CBT had a high negative correlation; however, the times at which MLT level reached the highest point and when CBT reached the lowest point were not known. In particular, MLT levels were obtained from subjects with their saliva, which is the non-invasive method, and were not collected after 03:00 because changes in MLT levels may be caused due to sleep disturbance while the subjects were sleeping. In addition, the exact peak time of MLT concentration cannot be known at the 1-hour sampling interval, which is also true for CBT. Therefore, we performed polynomial fitting for the average MLT concentration and CBT of subjects over time (Lushington et al. Citation1999). Although a dual harmonic model is usually used for rhythms with periods of approximately 24 hours, in this study, seventh-order polynomial fitting was chosen because the adjusted R2 value of the harmonic model was low. These methods were applied equally to HR and HRV for comparison purposes, as shown in . The seventh-order polynomial fitted curve of the averaged MLT rhythm, with an adjusted R2 of .960, shows a maximum at around 04:56; the fitted curve of the averaged CBT rhythm, with an adjusted R2 of .961, has a minimum at around 04:55, as shown in ) and 6(b). Compared with previous studies, in this study the MLT rhythm is ahead of the CBT rhythm, although the time difference between the maximum MLT and the minimum CBT is relatively small due to differences in overall experimental protocol design (Shanahan and Czeisler Citation1991; Dijk et al. Citation1999). This phase difference of the circadian rhythms between MLT and CBT is related to the thermoregulatory effects of MLT. Endogenous MLT is a major physiological regulator of normal nocturnal decline in the CBT because it has hypothermic properties (Cagnacci et al. Citation1992). Therefore, nocturnal secretion of MLT causes CBT to decrease, and the minimum time of the CBT rhythm occurs after the maximum time of the MLT rhythm. In addition, administration of MLT during the daytime lowers the distal and proximal skin temperature as well as CBT, and affects nighttime sleepiness (Kräuchi et al. Citation2009).
Figure 6. Biomarkers of subjects obtained as function of time. (a) salivary MLT concentration, (b) CBT collected from tympanum, (c) heart rate (HR) and (d) R wave-to-R wave (RR) intervals calculated from ECG waveform. All data represented mean ± SEM (N = 22). The band at the top indicates the lighting condition (white: normal lighting condition, Orange: nighttime lighting condition and black: light off). The red lines indicate the seventh-order polynomial fitted curve for each biomarker and the blue dashed lines indicate times when the subjects were sleeping (00:00 ~ 08:00).
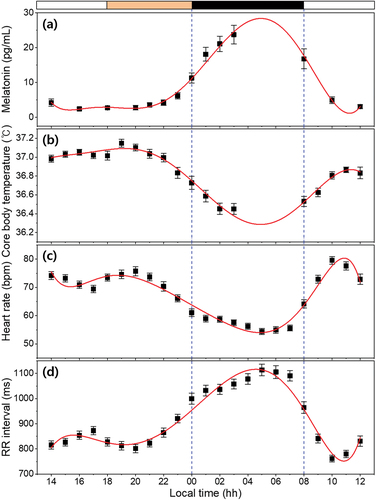
Nocturnal MLT affects not only CBT but also HR. As mentioned earlier, MLT secretion is initially initiated by sympathetic nervous system stimulation, and excessive secreted MLT inhibits the sympathetic nervous system again by negative feedback, reducing the HR and blood pressure (Stehle et al. Citation2011; Simko et al. Citation2016; Monfredi and Lakatta Citation2019). In ), the fitted curve of the averaged HR rhythm with an adjusted R2 of .934 shows a nadir around 04:52. The HR rhythm reaches its peak value between 09:00 and 11:00. After morning acrophase, HR rhythm gradually begins to decline and reaches a small afternoon nadir (at around 16:00). Then, it shows a small evening peak at around 20:00, and a profound nocturnal nadir at around 05:00. This circadian pattern of HR is in good agreement with previous results (Degaute et al. Citation1991; Guo and Stein Citation2003). In particular, unlike the cases of MLT level or CBT, the reason that HRs increase significantly from 18:00 to 20:00 and RR intervals decrease accordingly is that dinner increases the amount of blood required by the digestive system (Matsumoto et al. Citation2001). Increasing or decreasing HR occurs largely via the ANS’s two opposing systems (sympathetic and parasympathetic nervous systems). These ANSs have direct effects on the cells of the sinoatrial node of the heart, leading to a peripheral clock system under the control of the SCN (Monfredi and Lakatta Citation2019). Measurements of beat-to-beat variations in the cardiac cycle and analysis of HRV are non-invasive and useful methods for studying autonomic nervous function. ) shows the circadian rhythm of mean RR intervals during a period of 24 hours; this has been shown to be a reliable reflection of autonomic nervous function. Increased mean RR intervals, reflecting increased parasympathetic modulation of the heart with a nighttime acrophase (at around 04:35), coincided with sleep deepening. The circadian rhythm of the mean RR intervals, with high values during the night and low values during the day, are consistent with previous reports that have used other clinical protocols such as the ultradian sleep wave cycle (Boudreau et al. Citation2012) or forced desynchrony (Hilton et al. Citation2000). In addition, Nishiyama et al. (Citation2001) reported that exogenous MLT administration increased the RR intervals. These results indicate that MLT might have induced the parasympathetic tone. The measured and analyzed biomarkers in this study show that the patterns of MLT and the RR interval rhythms are almost similar and the patterns of CBT and the HR rhythms are also comparable.
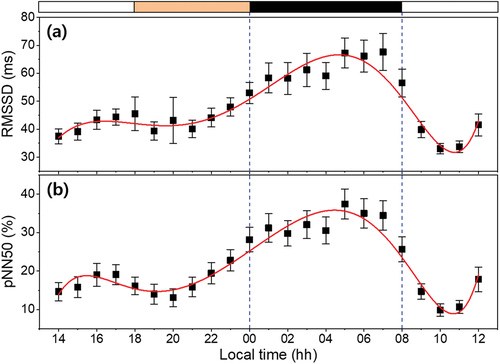
RMSSD and pNN50 as time domain HRVs are used to estimate the parasympathetic activity, which is high at night and low during the day (Vandewalle et al. Citation2007; Yang et al. Citation2018). As shown in , our results also show similar high and low trends between the night and the day. The adjusted R2 values of the seventh-order fitted curve of RMSSD and pNN50 were .911 and .913, respectively, and had high values, like those of the RR intervals, another time domain HRV. The RMSSD and pNN50 curve reached maximums at around 04:41 and 04:28, respectively, which are approximately equal to the time when the RR intervals or the MLT curve reached their peaks; this result shows that vagal tone has an endogenous circadian rhythm (Hilton et al. Citation2000). In addition, the acrophase-nadir time relationship between the RMSSD curve and the HR curve is almost symmetrical with the time at the maximum/minimum point. This means that the parasympathetic nerve activity is highest when the HR is minimal, during deep sleep.
Figure 7. Time domain HRV calculated from ECG waveform of subjects as function of time. (a) RMSSD and (b) pNN50. All data represented mean ± SEM (N = 22). The band at the top indicates the lighting condition (white: normal lighting condition, Orange: nighttime lighting condition and black: light off). The red lines indicate the seventh-order polynomial fitted curve for each biomarker and the blue dashed lines indicate times when the subjects were sleeping (00:00 ~ 08:00).
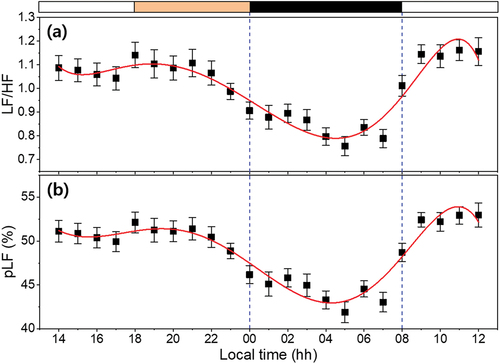
As shown in , the fitted curve of the pLF and LF/HF ratio shows the 24-hour trend of averaged data, with nadirs around 04:16 (adj R2 = .870) and 04:31 (adj R2 = .866). The pLF component is ascribed to sympathetic modulation of cardiac pacemaker activity; the LF/HF ratio is considered to mirror the sympatho/vagal balance or to reflect sympathetic modulations (Furlan et al. Citation1990; Malik et al. Citation1996; Voultsios et al. Citation1997). A clear decrease was observed in the LF/HF curve during the sleep onset period and consecutive sleep phases, which is consistent with the trend of the CBT curve. These results suggest the existence of a correlation between the ANS and the circadian rhythms of sleep-awake cycle (Okamoto-Mizuno et al. Citation2008). The LF/HF ratio also showed an inverse correlation with the delta waves in the electroencephalogram (EEG) and was significantly lower in deep sleep stages (Ako et al. Citation2003). In addition, MLT administration decreased the LF/HF ratio and might suppress the sympathetic tone. MLT might have exerted an autonomic effect through the SCN (Yang et al. Citation2018). Therefore, the physiological rhythms, such as MLT, CBT, and the circadian rhythms of HR and HRV, are all connected under the control of the SCN.
Figure 8. Power spectral density analysis (frequency domain) calculated from ECG waveform of subjects as function of time. (a) LF/HF ratio and (b) proportional LF (pLF). All data represented mean ± SEM (N = 22). The band at the top indicates the lighting condition (white: normal lighting condition, Orange: nighttime lighting condition and black: light off). The red lines indicate the seventh-order polynomial fitted curve for each biomarker and the blue dashed lines indicate times when the subjects were sleeping (00:00 ~ 08:00).
summarizes the peak/nadir times for all biomarkers used in this study. In particular, the RR intervals showed the highest correlation with MLT and CBT. According to the fitted curves, the peak time of the RR intervals reached values of 21 min and 20 min earlier compared to the peak time of MLT and the nadir time of CBT, respectively. Similar trends were observed for other biomarkers obtained from HRV. In the case of pLF, the time difference was approximately twice that of the RR intervals, which can reduce the predictability of circadian rhythms. Meanwhile, HR still showed a high correlation with MLT and CBT; the time differences were only 4 min and 3 min, respectively, which were the smallest differences among all biomarkers. In this regard, HR can be a powerful circadian rhythm predictor, suggesting that it can be used to predict a person’s circadian rhythm without a separate invasive or sleep-disrupting test. Therefore, knowing the 24-hour variation of one of these biomarkers, representing the endocrine and autonomic nervous systems, we can predict the patterns of the remaining biomarkers. Although the mechanisms of individual circadian biomarkers are unclear, these results appear because all circadian rhythms are controlled by SCN, the master clock located in the hypothalamus of the brain.
Table 3. Adjusted R-square and peak/nadir time of each biomarker. †Peak time of fitted curve. ‡Nadir time of fitted curve
The circadian markers MLT and CBT have a high correlation with the biomarkers presented in this study; peak/nadir times of the circadian markers can be estimated through similar fitted curves, but there are some limitations. First, since this study estimated peak/nadir times of circadian markers based on seventh-order fitted curves of obtained biomarkers, results can be very different depending on the design of the experimental protocol. Another limitation is that there are various environmental factors affecting the circadian rhythms of MLT or CBT, and each individual has a different biological response. In addition, because this study was conducted on healthy young adults, it is unknown whether the same results can be applied to other people. Although accurate parameters and equations are difficult to formulate, it is expected that the evaluation of circadian rhythms according to individual circumstances will be possible in additional research. Lastly, a limitation arises in the practical application of these results. Instead of MLT and CBT, we tried to use biomarkers that are relatively easy-to-measure, but it is still difficult and cumbersome for an individual to check the actual RR interval (or determine other HRV parameters). Fortunately, wearable devices such as smartwatches with multiple sensors are becoming widespread, and the introduction of specific algorithms may address this issue. In this regard, ambulatory skin temperature measurement technology can also be used to estimate an individual’s circadian rhythm (Sarabia et al. Citation2008). In general, because the skin temperature is greatly influenced by the external environment, it is not considered in this study. Nevertheless, if reliable levels of HR, HRV, and skin temperature can be obtained through personal wearable devices, this may allow the use of intrinsic-phase agreement as an informative marker of health. Furthermore, sleep is highly correlated with the circadian phase of the body temperature rhythm at bedtime, and sleep progression to deeper sleep stages is associated with a shift towards greater parasympathetic regulation (Czeisler et al. Citation1980; Boudreau et al. Citation2013). Therefore, if our research is expanded to include polysomnography, our method can be considered applicable for sleep research as well.
4. Conclusions
We have shown that the circadian rhythms of the endocrine system, such as MLT, are correlated with the cardiovascular rhythmicity, such as RR intervals, and suggested that HR can be a good circadian biomarker for personal health care, for use instead of MLT, which is difficult to monitor over 24-hour periods. It is certainly worthwhile to provide a means of self-predicting circadian rhythms, which are difficult for individuals to identify, because disturbances in circadian rhythms can cause many diseases and symptoms.
Disclosure statement
No potential conflict of interest was reported by the author(s).
Correction Statement
This article has been republished with minor changes. These changes do not impact the academic content of the article.
Additional information
Funding
References
- Åkerstedt T, Gillberg M. 1990. Subjective and objective sleepiness in the active individual. Int J Neurosci. 52(1–2):29–37. doi:10.3109/00207459008994241.
- Ako M, Kawara T, Uchida S, Miyazaki S, Nishihara K, Mukai J, Hirao K, Ako J, Okubo Y. 2003. Correlation between electroencephalography and heart rate variability during sleep. Psychiatry Clin Neurosci. 57(1):59–65. doi:10.1046/j.1440-1819.2003.01080.x.
- Arendt J. 1998. Melatonin and the pineal gland: influence on mammalian seasonal and circadian physiology. Rev Reprod. 3(1):13–22. doi:10.1530/ror.0.0030013.
- Benloucif S, Burgess HJ, Klerman EB, Lewy AJ, Middleton B, Murphy PJ, Parry BL, Revell VL. 2008. Measuring melatonin in humans. J Clin Sleep Med. 4(1):66–69. doi:10.5664/jcsm.27083.
- Berson DM. 2003. Strange vision: ganglion cells as circadian photoreceptors. Trends Neurosci. 26(6):314–320. doi:10.1016/S0166-2236(03)00130-9.
- Boudreau P, Yeh W-H, Dumont GA, Boivin DB. 2012. A circadian rhythm in heart rate variability contributes in the increased cardiac sympathovagal response to awakening in the morning. Chronobio Int. 29(6):757–768. doi:10.3109/07420528.2012.674592.
- Boudreau P, Yeh W-H, Dumont GA, Boivin DB. 2013. Circadian variation of heart rate variability across sleep stages. Sleep. 36(12):1919–1928. doi:10.5665/sleep.3230.
- Buysse DJ, Reynolds CF, Monk TH, Berman SR, Kupfer DJ. 1989. The Pittsburgh Sleep Quality Index: new instrument for psychiatric practice and research. Psychiatry Res. 28(2):193–213. doi:10.1016/0165-1781(89)90047-4.
- Cagnacci A, Elliott JA, Yen SS. 1992. Melatonin: a major regulator of the circadian rhythm of core temperature in humans. J Clin Endocrinol Metab. 75(2):447–452. doi:10.1210/jcem.75.2.1639946.
- Cho YM, Ryu SH, Lee BR, Kim KH, Lee E, Choi J. 2015. Effects of artificial light at night on human health: a literature review of observational and experimental studies applied to exposure assessment. Chronobiol Int. 32(9):1294–1310. doi:10.3109/07420528.2015.1073158.
- Czeisler CA, Weitzman ED, Moore-Ede MC, Zimmerman JC, Knauer RS. 1980. Human sleep: its duration and organization depend on its circadian phase. Science. 210(4475):1264–1267. doi:10.1126/science.7434029.
- Daanen HAM. 2006. Infrared tympanic temperature and ear canal morphology. J Med Eng Technol. 30(4):224–234. doi:10.1080/03091900600711613.
- Degaute JP, van de Borne P, Linkowski P, Van Cauter E. 1991. Quantitative analysis of the 24-hour blood pressure and heart rate patterns in young men. Hypertension. 18(2):199–210. doi:10.1161/01.HYP.18.2.199.
- Dijk DJ, Duffy JF, Riel E, Shanahan TL, Czeisler CA. 1999. Ageing and the circadian and homeostatic regulation of human sleep during forced desynchrony of rest, melatonin and temperature rhythms. J Physiol. 516(2):611–627. doi:10.1111/j.1469-7793.1999.0611v.x.
- Foster RG, Wulff K. 2005. The rhythm of rest and excess. Nat Rev Neurosci. 6(5):407–414. doi:10.1038/nrn1670.
- Furlan R, Guzzetti S, Crivellaro W, Dassi S, Tinelli M, Baselli G, Cerutti S, Lombardi F, Pagani M, Malliani A. 1990. Continuous 24-hour assessment of the neural regulation of systemic arterial pressure and RR variabilities in ambulant subjects. Circulation. 81(2):537–547. doi:10.1161/01.CIR.81.2.537.
- Gubin DG, Gubin GD, Gapon LI, Weinert D. 2016. Daily melatonin administration attenuates age-dependent disturbances of cardiovascular rhythms. Curr Aging Sci. 9(1):5–13. doi:10.2174/1874609809666151130220011.
- Gubin DG, Nelaeva AA, Uzhakova AE, Hasanova YV, Cornelissen G, Weinert D. 2017a. Disrupted circadian rhythms of body temperature, heart rate and fasting blood glucose in prediabetes and type 2 diabetes mellitus. Chronobiol Int. 34(8):1136–1148. doi:10.1080/07420528.2017.1347670.
- Gubin DG, Weinert D, Rybina SV, Danilova LA, Solovieva SV, Durov AM, Prokopiev NY, Ushakov PA. 2017b. Activity, sleep and ambient light have a different impact on circadian blood pressure, heart rate and body temperature rhythms. Chronobiol Int. 34(5):632–649. doi:10.1080/07420528.2017.1288632.
- Güler AD, Ecker JL, Lall GS, Shafiqul H, Altimus CM, Liao HW, Barnard AR, Cahill H, Badea TC, Zhao H, et al. 2008. Melanopsin cells are the principal conduits for rod–cone input to non-image-forming vision. Nature. 453(7191):102–105. doi:10.1038/nature06829.
- Guo YF, Stein PK. 2003. Circadian rhythm in the cardiovascular system: chronocardiology. Am Heart J. 145(5):779–786. doi:10.1016/S0002-8703(02)94797-6.
- Hida A, Kitamura S, Katayose Y, Kato M, Ono H, Kadotani H, Uchiyama M, Ebisawa T, Inoue Y, Kamei Y, et al. 2014. Polymorphism with morningness–eveningness preference and circadian rhythm sleep disorder. Sci Rep. 4(1):6309. doi:10.1038/srep06309.
- Hilton MF, Umali MU, Czeisler CA, Wyatt JK, Shea SA. 2000. Endogenous circadian control of the human autonomic nervous system. Comput Cardiol. 27:197–200.
- Honma K, Honma S, Kohsaka M, Fukuda N. 1992. Seasonal variation in the human circadian rhythm: dissociation between sleep and temperature rhythm. Am J Physiol Regul Integ Comp Physiol. 262(5):R885–R891. doi:10.1152/ajpregu.1992.262.5.R885.
- Kennaway DJ. 2019. A critical review of melatonin assays: past and present. J Pineal Res. 67:e12572. doi:10.1111/jpi.12572.
- Kräuchi K, Cajochen C, Pache M, Flammer J, Wirz-Justice A. 2009. Thermoregulatory effects of melatonin in relation to sleepiness. Chronobiol Int. 23(1–2):475–484. doi:10.1080/07420520500545854.
- Lam RW, Levitan RD. 2000. Pathophysiology of seasonal affective disorder: a review. J Psychiatry Neurosci. 25(5):469–480.
- Lefrant JY, Muller L, de La Coussaye Je, Benbabaali M, Lebris C, Zeitoun N, Mari C, Saïssi G, Ripart J, Eledjam -J-J, et al. 2003. Temperature measurement in intensive care patients: comparison of urinary bladder, oesophageal, rectal, axillary, and inguinal methods versus pulmonary artery core method. Intensive Care Med. 29(3):414–418. doi:10.1007/s00134-002-1619-5.
- Lockley SW. 2020. Journal of Pineal Research guideline for authors: measuring melatonin in humans. J Pineal Res. 69(2):e12664. doi:10.1111/jpi.12664.
- Lockley SW, Gooley JJ. 2006. Circadian photoreception: spotlight on the brain. Curr Biol. 16(18):R795–R797. doi:10.1016/j.cub.2006.08.039.
- Looney DP, Buller MJ, Gribok AV, Leger JL, Potter AW, Rumpler WV, Tharion WJ, Welles AP, Friedl KE, Hoyt RW. 2018. Estimating resting core temperature using heart rate. J Meas Phy Behav. 1(2):79–86. doi:10.1123/jmpb.2017-0003.
- Lushington K, Dawson D, Kennaway DJ, Lack L. 1999. The relationship between 6-sulphatoxymelatonin and polysomnographic sleep in good sleeping controls and wake maintenance insomniacs, aged 55–80 years. J Sleep Res. 8(1):57–64. doi:10.1046/j.1365-2869.1999.00130.x.
- Malik M, Bigger JT, Camm J, Kleiger RE, Malliani A, Moss AJ, Schwartz PJ. 1996. Heart rate variability: standards of measurement, physiological interpretation, and clinical use. Eur Heart J. 17(3):354–381. doi:10.1093/oxfordjournals.eurheartj.a014868.
- Matsumoto T, Miyawaki C, Ue H, Kanda T, Yoshitake Y, Moritani T. 2001. Comparison of thermogenic sympathetic response to food intake between obese and non-obese young women. Obes Res. 9(2):78–85. doi:10.1038/oby.2001.10.
- Melo MCA, Abreu RLC, Linhares Neto VB, de Bruin PFC, de Bruin VMS. 2017. Chronotype and circadian rhythm in bipolar disorder: a systematic review. Sleep Med Rev. 34:46–58. doi:10.1016/j.smrv.2016.06.007.
- Monfredi O, Lakatta EG. 2019. Complexities in cardiovascular rhythmicity: perspectives on circadian normality, ageing and disease. Cardiovasc Res. 115(11):1576–1595. doi:10.1093/cvr/cvz112.
- Nishiyama K, Yasue H, Moriyama Y, Tsunoda R, Ogawa H, Yoshimura M, Kugiyama K. 2001. Acute effects of melatonin administration on cardiovascular autonomic regulation in healthy men. Am Heart J. 141(5):13A–17A. doi:10.1067/mhj.2001.114368.
- Okamoto-Mizuno K, Yamashiro Y, Tanaka H, Komada Y, Mizuno K, Tamaki M, Kitado M, Inoue Y, Shirakawa S. 2008. Heart rate variability and body temperature during the sleep onset period. Sleep Biol Rhythms. 6(1):42–49. doi:10.1111/j.1479-8425.2008.00335.x.
- Okawa M, Uchiyama M. 2007. Circadian rhythm sleep disorders: characteristics and entrainment pathology in delayed sleep phase and non-24 sleep–wake syndrome. Sleep Med Rev. 11(6):485–496. doi:10.1016/j.smrv.2007.08.001.
- Patke A, Murphy PJ, Onat OE, Krieger AC, Özçelik T, Campbell SS, Young MW. 2017. Mutation of the human circadian clock gene CRY1 in familial delayed sleep phase disorder. Cell. 6(2):203–215. doi:10.1016/j.cell.2017.03.027.
- Rzepka-Milgut B, Paprocka J. 2020. Melatonin-measurement methods and the factors modifying the results. A systematic review of the literature. Int J Environ Res Public Health. 17(6):1916. doi:10.3390/ijerph17061916.
- Sarabia JA, Rol MA, Mendiola P, Madrid JA. 2008. Circadian rhythm of wrist temperature in normal-living subjects: a candidate of new index of the circadian system. Physiol Behav. 95(4):570–580. doi:10.1016/j.physbeh.2008.08.005.
- Sato M, Kanikowska D, Iwase S, Shimizu Y, Nishimura N, Inukai Y, Sato M, Sugenoya J. 2013. Seasonal differences in melatonin concentrations and heart rates during sleep in obese subjects in Japan. Int J Biometeorol. 57(5):743–748. doi:10.1007/s00484-012-0601-3.
- Scheer FAJL, Hu K, Evoniuk H, Kelly EE, Malhotra A, Hilton MF, Shea SA. 2010. Impact of the human circadian system, exercise, and their interaction on cardiovascular function. Proc Natl Acad Sci. 107(47):20541–20546. doi:10.1073/pnas.1006749107.
- Shanahan TL, Czeisler CA. 1991. Light exposure induces equivalent phase shifts of the endogenous circadian rhythms of circulating plasma melatonin and core body temperature in men. J Clin Endocrinol Metab. 73(2):227–235. doi:10.1210/jcem-73-2-227.
- Simko F, Baka T, Paulis L, Reiter RJ. 2016. Elevated heart rate and nondipping heart rate as potential targets for melatonin: a review. J Pineal Res. 61(2):127–137. doi:10.1111/jpi.12348.
- Stauss HM. 2003. Heart rate variability. Am J Physiol Regul Integ Comp Physiol. 285(5):R927–R931. doi:10.1152/ajpregu.00452.2003.
- Stehle JH, Saade A, Rawashdeh O, Ackermann K, Jilg A, Sebestény T, Maronde E. 2011. A survey of molecular details in the human pineal gland in the light of phylogeny, structure, function and chronobiological diseases. J Pineal Res. 51(1):17–43. doi:10.1111/j.1600-079X.2011.00856.x.
- Touitou Y, Auzéby A, Camus F, Djeridane Y. 2009. Daily profiles of salivary and urinary melatonin and steroids in healthy prepubertal boys. J Pediatr Endocrinol Metab. 22(11):1009–1015. doi:10.1515/JPEM.2009.22.11.1009.
- Vandewalle G, Middleton B, Rajaratnam SMW, Stone BM, Thorleifsdottir B, Arendt J, Dijk DJ. 2007. Robust circadian rhythm in heart rate and its variability: influence of exogenous melatonin and photoperiod. J Sleep Res. 16(2):148–155. doi:10.1111/j.1365-2869.2007.00581.x.
- Videnovic A, Lazar AS, Barker RA, Overeem S. 2014. ‘The clocks that time us’–circadian rhythms in neurodegenerative disorders. Nat Rev Neurol. 10(12):683–693. doi:10.1038/nrneurol.2014.206.
- Vollmer M. 2019. HRVTool – an open-source Matlab toolbox for analyzing heart rate variability. Comput Cardiol. 46:1–4. doi:10.22489/CinC.2019.032.
- Voultsios A, Kennaway DJ, Dawson D. 1997. Salivary melatonin as a circadian phase marker: validation and comparison to plasma melatonin. J Biol Rhythms. 12(5):457–466. doi:10.1177/074873049701200507.
- Welsh DK, Takahashi JS, Kay SA. 2010. Suprachiasmatic nucleus: cell autonomy and network properties. Annu Rev Physiol. 72(1):551–577. doi:10.1146/annurev-physiol-021909-135919.
- Yang Z, Liu H, Meng F, Guan Y, Zhao M, Qu W, Hao H, Luan G, Zhang J, Li L. 2018. The analysis of circadian rhythm of heart rate variability in patients with drug-resistant epilepsy. Epilepsy Res. 146:151–159. doi:10.1016/j.eplepsyres.2018.08.002.
- Zee PC, Attarian H, Videnovic A. 2013. Circadian rhythm abnormalities. Continuum (Minneap Minn). 19(1):132–147. Sleep Disorders). doi:10.1212/01.CON.0000427209.21177.aa.