 FarmApp: a new assessment of cognitive control and memory for children and young people with neurodevelopmental difficulties
 ?Mathematical formulae have been encoded as MathML and are displayed in this HTML version using MathJax in order to improve their display. Uncheck the box to turn MathJax off. This feature requires Javascript. Click on a formula to zoom.
ABSTRACT
We introduce a new touchscreen-based method measuring aspects of cognitive control and memory, in children and young people with neurodevelopmental difficulties, including intellectual disability (ID). FarmApp is a gamified, tablet-based assessment tool measuring go/no-go response speed, response inhibition, visuospatial short-term memory span, and long-term memory. Here, we assessed the feasibility, validity, and utility of the method, including the benefits of measuring change in performance over two weeks. We observed that: 1) a higher proportion of participants completed FarmApp than traditional psychometric tests; 2) this proportion increased when participants had opportunity for two weeks of self-paced testing at home; 3) ADHD-relevant behavioral difficulties were associated with average go/no-go performance across all attempts, and change in go/no-go performance over time, indicating sensitivity of the method to cognitive differences with real-world relevance. We also addressed the potential utility of the FarmApp for exploring links between ID etiology and cognitive processes. We observed differences in go/no-go task between two groups of ID participants stratified by the physiological functions of associated genetic variants (chromatin-related and synaptic-related). Moreover, the synaptic group demonstrated higher degree of improvement in go/no-go performance over time. This outcome is potentially informative of dynamic mechanisms contributing to cognitive difficulties within this group. In sum, FarmApp is a feasible, valid, and useful tool increasing access to cognitive assessment for individuals with neurodevelopmental difficulties of variable severity, with an added opportunity to monitor variation in performance over time and determine capacity to acquire task competence.
There is wide variation in the types and severity of cognitive difficulties affecting individuals with neurodevelopmental disorders (NDD), in turn influencing variation in educational attainment, independent living skills, social interactions, and emotional characteristics (Waite et al., Citation2017). Moreover, the same degree of global cognitive impairment and same behavioral characteristics (e.g., hyperactivity or anxiety) can arise from different underlying cognitive mechanisms (Karmiloff-Smith, Citation2013). For example, sensory functions, motor control, or memory limitations can each be the primary mechanism contributing to communication difficulties (Houwen et al., Citation2016). A better understanding of the low-level processes contributing cognitive diversity within the NDD population, and the relationship between causal factors and cognitive mechanisms could be of practical use, and provide an important bridge between the biological origins and complex developmental impairments. In view of rapid progress in identifying genetic etiologies of NDD, it should become possible to test whether the cause of an individual’s NDD influences learning via specific cognitive processes (Van Bokhoven, Citation2011).
A longstanding challenge in the developmental sciences has been the lack of assessment measures sensitive to cognitive diversity within the NDD population, encompassing individuals with intellectual disability (ID) and those with less severe global impairments. The use of standardized intelligence tests or neuropsychological measures, whilst providing uniform benchmarking, poses several limitations (Thompson et al., Citation2018). Firstly, in neuropsychological tests not directly tailored to individuals with NDD, some participants may have difficulties understanding task goals, attending to task instructions, or processing complex task stimuli, leading to underestimation of their actual abilities within the domain under assessment. Secondly, strict administration procedures, e.g., time limits or required number of items that must be completed for scoring, means that an individual may not achieve recognition for their performance. Furthermore, standardization samples usually include very few subjects with NDD and associated syndromes, resulting in limited sensitivity within range of impairment for individuals with neurodevelopmental difficulties, and frequent floor effects. There have been significant attempts to overcome these limitations (Hessl et al., Citation2009, Citation2016a; Shields et al., Citation2020). However, existing methods rely on a one-off assessment by an unfamiliar examiner, irrespective of an individual’s variable concentration, motivation, and social confidence, all of which may influence capacity to attempt a novel task and to improve performance if practice is permitted (Hessl et al., Citation2016b). Here, we propose a different and complementary approach for evaluating specific cognitive abilities, accessible to a wide range of global functioning.
We have designed an accessible touchscreen-based method – FarmApp – that aims to measure competence from relatively low- to higher-level cognitive processes, while minimizing verbal instructions, increasing gamification, and allowing for repeated engagement over more than one session. We targeted stimulus-response accuracy and speed, short-term memory capacity, and long-term memory (i.e. declarative memory), which contribute to diverse aspects of everyday function (Su et al., Citation2008). In short, FarmApp is an age- and developmental-stage appropriate, intuitive, non-verbal cognitive assessment platform, with a game-like structure, i.e. motivating and enjoyable for participants. Influenced in part by cognitive training methods, which often involve adaptive cognitive tasks, FarmApp introduces a number of flexible elements to improve access and maximize the opportunity for each participant to demonstrate their abilities. Participation can be supervised by a researcher, a parent/carer, or can be independently controlled by a participant, as this type of setup was successful, for instance, in training trials for children with attention difficulties (Tamm et al., Citation2013). The computerized testing schedule is programmed in an adaptive fashion, to maintain motivation and obtain an estimate of “best possible” performance (Holmes et al., Citation2009; Klingberg, Citation2010). The app is designed to be used repeatedly over a period of days or weeks, with no fixed requirement or limit to number of attempts, to monitor changes in a participant’s performance via remote data upload. Each FarmApp task builds from simple foundations, limited or no verbal requirements and repeated practice to increasingly complex demands.
In addition, the selection of tasks was informed by our core research hypotheses that distinct cognitive processes can contribute to complex learning impairments reflecting different etiologies of NDD, and that dynamic change in cognitive performance may be more informative than fixed deficits (Cornish et al., Citation2012; Steele et al., Citation2013). Specifically, we sought to extend our previous findings that genetic disorders directly influencing synaptic physiology impact on attention and cognitive control, and contribute to social and behavioral difficulties amongst this group (Baker et al., Citation2015).
In the current paper, we describe the FarmApp design, testing, and analysis procedures, and we address the following questions:
Feasibility - Can FarmApp achieve its objectives in populations that typically struggle to complete traditional psychometric batteries? Does longer-term testing at home improve access to assessment?
Validity - Can FarmApp be linked to everyday behavior? To establish this, we asked whether FarmApp performance relates to parent-reported measures of everyday behaviors.
Utility of assessing performance over time - Can FarmApp incorporate assessment of change in performance over time to capture dynamic capacities beyond baseline constraints? Does change in task performance over time relate to an individuals’ global adaptive functioning and ADHD-relevant behaviors? To assess this, we have examined variation in performance over a two-week period of time.
Effectiveness of the method to link causal factors and cognitive processes. As proof of principle, we examined whether FarmApp task performance and dynamic change in attention task performance are associated with NDD-associated genetic variants. We applied a functional network phenotyping approach, whereby variants are grouped according to gene physiological function (Baker et al., Citation2015).
Method
FarmApp structure
FarmApp consists of three independent tasks, or games, which share a similar overarching structure and are described below. The games can be accessed in one of three “modes”. In Research Assisted (RA) mode, the research assistant introduces the task to the participant, and guides the participant as they progress through the game. This mode closely resembles existing experimenter driven assessments, albeit with NDD friendly modifications (Hessl et al., Citation2016a; Shields et al., Citation2020). However, and uniquely, once the participant has completed the games in RA mode, FarmApp is switched into Child mode in which participants are able to play the games freely and at their own pace. Additionally, there is an option to enter Adult mode, where adults or caregivers (usually parents) can intervene and guide their child through the rules and procedure of each game.
Within each mode, the games are further divided into “phases”. RA mode consists of an initial “training or practise” phase, in which the rules and requirements of the game are explained alongside a simple narrative (see Supplementary material). This phase can be repeated until the participant understands the game enough to proceed to the next phase, having completed one block per game. More specifically, each phase is composed of different “blocks”, with a specific number of trials per block. For instance, in the “training” or initial phase of the Sheep game one block is composed of four go-only and one no-go trials. The next phase is “warm-up”, allowing the participant to play the game with reduced supervision and prompting from the RA. After the warm-up phase has been completed, the game progresses into the “baseline” phase, in which the participant completes full-length blocks (i.e. more trials) of each game. Performance at baseline is used to establish a starting point for play during the final “adaptive” phase in which task difficulty increases or decreases according to each participant’s performance. In Child mode, there are no practice and warm-up phases, only baseline and adaptive phases. Each time one of the games is opened, a new “run” for that game is initiated. A run is complete when the participant has progressed through each phase of the game. Our motivation behind this structure was to enable adaptive testing for as many participants as possible. The structure and design, including the three modes (RA, Child, Adult) and four phases (practice, warm-up, baseline, and adaptive), were thoroughly piloted with three independent samples (two samples of typically developing (TD) children aged 5–8 years old and 4–7 years old, and a sample of children with ID aged 6–15 years old). More information about the piloting phase is included in the Supplementary material.
Administration procedures
For the current study, all participants were initially assessed in a quiet room in their home or at school. A research assistant explained the objectives and functions of FarmApp to participants and their parents and carers, before introducing the three games within the app and guiding them through RA mode. Following this, FarmApp entered Child mode, and the tablet was left with the family for a period of two weeks. Parents were asked to encourage their child to use the app independently for about 20 min every day. During this period, the study team also provided remote technical support via e-mail and telephone to families as needed, and were able to monitor task activity remotely. In cases where the remote monitoring of FarmApp usage showed little or no activity, our research group reached out to families offering additional support and remote assistance. Tablets were returned via courier service at the end of the two weeks.
FarmApp tasks
A brief summary of each FarmApp game () is provided below. For detailed descriptions of the game structure and variables please see Supplementary material.
Figure 1. FarmApp game frames. From left to right, Sheep, Chicken and Memory game frames.
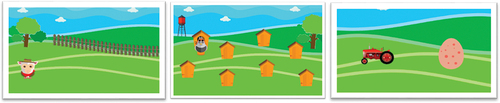
Sheep game
This is a go/no-go task, assessing inhibitory control and stimulus-response speed, in which participants are asked to “catch” as many sheep as possible, while avoiding any pigs (left panel in ). Images of sheep or pigs are visually presented one at a time on the bottom left corner of the screen. In order to catch a sheep, the participant must tap on the sheep while it is presented on the screen. Audio feedback is provided for a correct response (“baa” for a captured sheep, and “oink” for an untouched pig). During the practise, warm-up and baseline phases, the stimuli are presented for a set duration (“stimulus duration”) of 3000 ms. In contrast, during the adaptive phase, stimulus duration is adjusted according to participants’ accuracy on no-go trials. After a correctly inhibited response to a pig (no-go stimulus), stimulus duration decreases by 20%, whereas after an incorrect touch or response to a pig, stimulus duration increases by 20%. In order to keep the games engaging and feasible, minimum and maximum stimulus durations were capped at 1000 ms and 8000 ms, respectively. We recorded participants’ “overall accuracy”, accuracy when capturing sheep (“go accuracy”) and avoiding pigs (“no-go accuracy”). We also recorded participants’ response time (“RT”) when capturing sheep during blocks containing only sheep in the baseline and adaptive phase (“go-only RT”). Finally, during the adaptive phase, we recorded “adaptive RT”, RT averaged across mixed trials (go-only and no-go), and duration of no-go stimulus presentation (“stimulus duration”), which changed according to participants’ accuracy on no-go trials (or response inhibition). In addition, we used stimulus duration as a representative measure of change in performance over the two weeks period of adaptive play (Child mode).
Chicken game
The Chicken game is a Corsi block test where the stimuli are chickens popping out of hutches (middle panel in ). The participants are asked to tap on the hutches in the same order that the chickens appeared. When a correct sequence is recalled, audio and visual (seeing the last chicken in the sequence lay an egg) feedback is provided. Eggs (rewards) are collected over multiple runs, appearing in a haystack at the end of each phase. During the adaptive phase, the number of stimuli presented is adjusted according to participant’s accuracy on the previous block. Variables of interest include highest span reached and overall accuracy, named “Span” and “Chicken recall”, respectively. In addition, in order to account for variability within the same span level (i.e. three, four, or five hutches), a weighted score, or “Accuracy at span level”, is computed, taking into the account the proportion of correct number of trials at the span level.
Weighted score =
Memory game
The memory game was designed to test declarative memory, or the system that supports learning and storage of explicit knowledge (Ullman & Pullman, Citation2015). We assessed the recall for items presented in the Chicken and Sheep games vs novel distractor items from matched stimuli sets. Specifically, in the Memory game, each child was randomly assigned a unique set of chickens and sheep, i.e. a unique combination of previously seen and novel stimuli. The aim of the Memory game was to assess whether or not participants could identify their set of target stimuli when presented with a novel or similar chicken or sheep (distractors). The target stimuli (10 trials or pairs per block) were generated from sheep or chicken stimuli seen during previous Chicken or Sheep games. Forced-choice pairs were presented, and the participant is asked to tap on the stimulus (chicken or sheep) they have seen before. In this task, audio feedback is played to reward a response, but is unrelated to accuracy. Here, the variables of interest are total accuracy and RT. The Memory game does not have an adaptive element.
Participants and recruitment
This study involved participants with NDD from two research cohorts based at MRC Cognition and Brain Sciences Unit, University of Cambridge. For the CALM (Center for Attention, Learning and Memory) cohort, core inclusion criteria were: aged 5–18 years old, native English speaker, and cognitive and/or learning problems identified by a health or educational professional. A full description of recruitment procedures and cohort characteristics is provided in the CALM protocol paper (Holmes et al., Citation2019). For the BINGO (Brain and Behavior in Intellectual Disability of Genetic Origin) cohort, core inclusion criteria were: at least three years old and diagnosed with a neurodevelopmental disorder of known genetic origin (see Supplementary material for the list of genetic disorders). Participants of the BINGO cohort were recruited after receiving their genetic diagnosis, with the assistance of Regional Genetics Centers and family support groups. presents numbers of participants recruited to the study, number of participants meeting inclusion criteria for analysis of at least one FarmApp game, and demographic information for participants providing analyzable data.
Table 1. Demographic summary of participants included in analysis.
Concurrent psychometric measures
Parents/carers completed the Vineland Adaptive Behavior Scales, 2nd edition (VABS-II), hereafter Vineland ABC, as a measure of global adaptive functioning across three domains (communication, socialization and daily living skills), whereby lower scores indicate greater functional impairment (Sparrow et al., Citation2005). We also administered the Conners’ Parent Rating Scales – third edition, short form (CPRS) as an assessment of ADHD-relevant behaviors (Conners, Citation2008). Standardized assessments of IQ were used to assess the proportion of participants who were able to complete traditional neuropsychological tests in comparison to proportion able to engage with FarmApp. All participants in the CALM cohort attempted the Wechsler Abbreviated Scale Intelligence, 2nd edition (WASI-II, Wechsler, Citation2011). Participants in the BINGO cohort attempted the WASI-II or the Leiter international performance scale-revised (Leiter-R, Roid & Miller, Citation1997) or both.
Statistical analysis
To assess feasibility, we considered the proportion of individuals within the cohort who provided analyzable data in RA mode and in Child mode for each game (Sheep, Chicken, and Memory), in relation to the proportion of those able to complete standardized IQ assessments (WASI-II or Leiter-R). Specifically, participants were included in the data analysis of RA mode if they satisfied the following criteria: a minimum of five no-go adaptive trials played in the Sheep game; at least one span level completed in the Chicken game; and a minimum of one run for the Memory game. For Child mode, we applied the same inclusion criteria as for the RA mode.
To assess validity, we asked whether Sheep and Chicken game performance in Child mode correlated with scores of ADHD-related behaviors (CPRS), using non-parametric ranked (Spearman’s) correlations, controlling for both age and adaptive ability (Vineland ABC). Specifically, we used scores on the inattention, hyperactivity/impulsivity (henceforth “hyperactivity”), executive functioning (henceforth “EF”) and learning problem subscales of the CPRS. Correlations were performed in SPSS, and correlation matrices were visualized using the R corrplot statistical toolbox (RStudio Team, Citation2020; Wei et al., Citation2017).
To assess change in performance over time and its relation to adaptive functioning and ADHD behavioral factors in participants with neurodevelopmental difficulties, we applied linear mixed effect models (LMMs) to study individual learning trajectories, and the effect of behavioral variables on their slopes. These analyses were performed in R, using the lmer toolbox (Bates et al., Citation2015). We chose to apply LMMs over a simple general linear model, because of their proven ability to deal with incomplete datasets and unequally distributed data (Hesselmann, Citation2018).
Finally, we explored how genetic diagnosis influenced performance on the FarmApp games. We compared Chicken, Sheep, and Memory game performances in Child mode, between two functional genetic groups: chromatin-related variants versus synaptic-related variants (see Supplementary material for gene lists and participant numbers). We allocated single genes to two functional network groups (FNG): genes in the chromatin group are chromatin structural modifiers (e.g., components and regulators of the SWI/SNF chromatin remodeling complex), and genes in the synaptic group are direct and indirect modifiers of synaptic physiology. Performance on the FarmApp games was compared between the two FNGs via ANCOVAs, controlling for adaptive ability (Vineland ABC) and age, using RStudio.
Results
Feasibility
We obtained analyzable data via FarmApp from participants whose age ranged between 4 and 26 years old, and whose adaptive functioning assessed via Vineland ABC ranged between 20 and 127. Here, we examined the proportion of participants who met the inclusion criteria for the FarmApp games (Sheep, Chicken, and Memory), for each mode (RA or Child mode), in comparison to the proportion of participants who completed a standardized IQ assessment (WASI-II or Leiter-R). provides a breakdown of participation across the three games and two modes of testing. In RA mode, of the 88 participants recruited across both cohorts (BINGO and CALM), 51.1% (N = 45) of participants were able to provide analyzable data on at least one of the FarmApp games. In Child mode, the proportion of participants who were able to provide analyzable data on at least one of the FarmApp games increased to 69.3% (N = 61) of participants. Of the combined cohort 55.6% (N = 49) completed at least one standardized IQ assessment (WASI-II or Leiter-R). Almost half of the BINGO participants failed to provide sufficient responses for scoring of any sub-test from either battery (N = 37 for WASI-II and N = 21 for Leiter-R). Based on the written observations collected by research assistants during data collection, the reasons why participants did not complete the subtests were two-fold. 1) The vast majority of these participants did not engage at all when research assistants attempted to administer the tests. Frequent behavioral responses were: tearing apart the Leiter-R or WASI-II testing booklets; refusing to participate; very little interest in the activities; fast buildup of frustration when failing to understand the instructions and refusal to continue. 2) A small number of participants (N < 5) attempted to complete some of the subtests of the two batteries, but the number of completed items were below the threshold to compute subtest scores (and hence to compute summary IQ measures).
Table 2. Demographic comparison of participants included in analyses (completers) and not included in analyses (non-completers).
More details on the distribution of participants included in the analyses across games and cohorts (BINGO and CALM) are reported in the Supplementary material (Tables S5 and S6). The proportion of BINGO participants who provided analyzable data increased by 50% across modes: out of 69 recruited, 27 (39.1%) participants met the inclusion criteria for at least one of the games in RA mode, and this increased to 43 (62.3%) participants in Child mode. Furthermore, out of 43 participants who met the inclusion criteria for FarmApp analysis in Child mode, only 23 participants (53.4%) managed to complete the WASI-II, and 37 (86%) completed the Leiter-R.
Validation against behavioral questionnaires
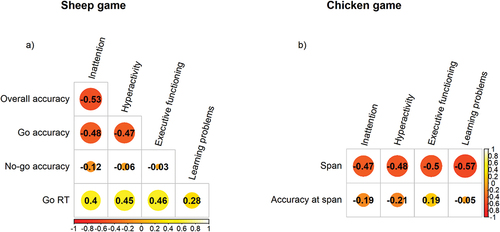
Here, we explored whether FarmApp game performance was associated with ADHD-related behaviors (CPRS subscales), within the whole sample (BINGO and CALM). We focussed on the performance in Child mode in the Sheep and Chicken games, applying the same inclusion criteria as previously described. The association between performance in Child mode on the Memory game and scores on CPRS subscales was not explored due to limited sample size (only 14 participants met the inclusion criteria). Correlation matrices are illustrated in (panels a and b). After covarying for age and Vineland ABC, the following associations were observed. For the Sheep game (N = 45), go-only accuracy negatively correlated with inattention (rs=-.425, p < .02), and EF (rs=-.462, p < .008), such that participants who were better at responding to targets in the Sheep game exhibited fewer difficulties with inattention and EF. For the Chicken game (N = 33), span negatively correlated with inattention (rs=-.377, p < .04) and hyperactivity (rs=-.481, p < .007), such that participants with better visuospatial short-term memory had fewer difficulties with inattention and hyperactivity. For consistency, we also performed the correlations in the BINGO sample only, where we observed the same results (see Supplementary material (Tables S7 and S8).
Figure 2. Spearman Rho correlations between FarmApp performance and ADHD traits (hyperactivity, inattention, executive functioning, and learning problems). the color scale goes from red (negative correlation) toward yellow (positive correlation). The size of the circles is the magnitude of the effect (p-values, not controlled for age and adaptive ability). 2a) Correlation matrix between performance at the Sheep game (accuracy and RT) and ADHD traits. 2b) Correlation matrix between performance at the Chicken game (span level reached, accuracy at the span level) and ADHD traits.
Utility of assessing change over time
The third part of the study explored change in go/no-go task performance over time over a two-week period of time, for the combined CALM and BINGO samples (N = 48). The aim of measuring performance on the Sheep game in Child mode over a two weeks was to test whether FarmApp was able to capture change in task performance over time due to cognitive fluctuations, and to the potential effects of learning mechanisms. We focussed our analysis on no-go stimulus duration (or “stimulus duration”), as an adaptive measure of change of performance over time, reflecting improvement in the ability to respond to targets and inhibit the response to distractors (see Supplementary material for participant-level raw data). After excluding participants (N = 12) whose performance was randomly distributed (runstest in Matlab), the analysis was performed by fitting linear mixed effects models (LMMs) with lmer toolbox in R. LMMs were fitted to the data, where the first model included adaptive ability (Vineland ABC) as an interaction factor, and the second set of models included inattention, hyperactivity, and EF (CPRS) as interaction factors. Summaries of model fittings are presented within the Supplementary material.
After centering our variables of interest (around the mean), we defined a linear model with random slopes and intercepts. In this case, the number of blocks (i.e. measure of time spent playing Sheep game), age, and interaction between number of blocks and level of adaptive ability were fitted as fixed factors, allowing the slopes to vary across subjects and age. Overall, 48 participants were included in this analysis. There was a significant effect of the number of blocks played (β= −9.98, CI= −18.90 − −1.5), meaning the more participants played the shorter the stimulus duration became. In addition, there was a significant interaction between adaptive ability and the number of blocks (Block N x Vineland ABC, β = 14.38 , CI = 3.80–24.96). The results of this LMM, including adaptive ability (Vineland ABC) as the interaction factor, suggest that participants did improve in their ability to inhibit the response to no-go stimuli. Moreover, this improvement was greatest for participants with lower adaptive ability, who started with a longer no-go stimulus duration, or more inaccurate inhibitory control. Amongst more able children, the test parameters did not enable them to improve over time, and we observed a tendency in their performance to deteriorate rather than to improve ().
Figure 3. Mixed effects linear models including adaptive ability (Vineland ABC) and hyperactivity as interaction factors. 3a) Relationship between adaptive ability (Vineland ABC) and change in Sheep game no-go stimulus duration across number of blocks. 3b) Relationship between hyperactivity and change in Sheep game performance (no-go stimulus duration) across number of blocks.
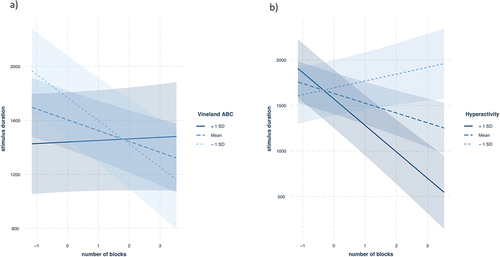
The second set of models included hyperactivity, inattention, and EF scores (CPRS subscales) as interaction terms, with number of blocks played as a measure of time spent playing the game as fixed factors, plus subjects and age as random factors. Overall, 35 participants were included in this analysis. The results showed significant main effect of number of blocks played on the stimulus duration estimate (β= −118.95, CI = −162.01 – −75.88), as well as a significant interaction between hyperactivity and the number of blocks played on the no-go stimulus duration prediction (Block N x Hyperactivity, β=-108.60, CI= −182.24 – −34.96). The results of this set of models suggest that participants improve their inhibitory control over time, and that this improvement was strongest for participants with higher hyperactivity ()
Following the behavioral LMM, we were interested in the predictive power of each of the ADHD-related behaviors in the model fit. For this reason, we fitted three separate LMMs (hyperactivity, inattention, and EF) and compared the models with ANOVA and information criteria metrics (AIC, BIC). While in each of the single LMM there was a significant interaction effect with the number of blocks played, the best explaining model of the data, based on the ANOVA, the AIC and BIC criteria, included hyperactivity as the interaction factor (AIC <2). These results show higher hyperactivity (i.e. +1 SD above the group mean) was associated with steeper learning curves, where participants improved their inhibitory control over longer time of play (number of blocks). Interaction effects of each of the models are shown in the Supplementary material.
Effects of genetic diagnosis on FarmApp performance and change over time
Finally, we investigated the hypothesis that FarmApp performance could be influenced by genetic diagnosis within the BINGO sample of individuals with NDD of known genetic origin. The BINGO sample (N = 67) was divided into two FNG, based on the physiological impact of genetic diagnosis: a chromatin-related group, and a synaptic-related group. Two participants were excluded because their genetic diagnosis was not chromatin- or synaptic-related. presents descriptive data for the two groups, and comparison of their performance on FarmApp games (Child mode, averaged over time).
Table 3. Summary table of the comparison between gene functional network groups.
First, we compared Child mode performance on all three games between the two groups, covarying for age and Vineland ABC. The results for the Sheep game show that the chromatin group was significantly more accurate (higher overall accuracy) and faster to respond to go-only trials (Go RT). However, there were no differences between groups on Chicken or Memory game performance ().
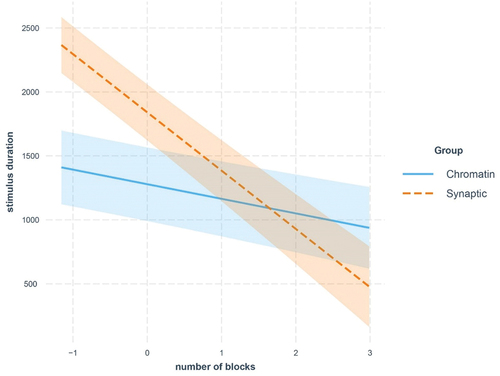
Next, in order to examine whether genetic group had an effect on learning slopes in the Sheep game, we fitted a LMM including age, Vineland ABC, and an interaction between number of blocks and genetic group, with subject and age as random factors (model fit details are illustrated in Supplementary material). Thirty-five (N = 35) participants were included in this analysis. The results showed a significant effect of the number of blocks (β= −113.99, CI= −176.28 – −51.69). As participants played the game more, no-go stimulus duration decreased, reflecting improved inhibitory control over time. In addition, there was a significant effect of genetic group on the relationship between number of blocks played and no-go stimulus duration (Block N x Genetic group, β=-341.69, CI= −458.51 – −224.87). illustrates the group-wise changes in performance over time: the synaptic group showed a steeper rate of improvement over time, whereas the chromatin group, while also improving, showed a flatter slope.
Figure 4. Interaction between gene functional network group and Sheep performance over time in the model fit. This figure shows the interaction effect (with 80% CI) of group in the model fit: the synaptic-related group (red) had a higher intercept, or started slower, and improved more in the game, compared to the chromatin-related group (blue).
Discussion
The current study describes a new cognitive assessment method for individuals with neurodevelopmental difficulties. We designed a touchscreen-based app as an accessible assessment method that measures stimulus response, speed, selective attention, short-term and long-term memory capacity. A key element is the encouragement of repeated testing and analysis of performance changes over time. The overarching goal of the current research was to examine FarmApp’s potential to measure these cognitive abilities across a wide age range and spectrum of neurodevelopmental disorder severity, and its efficacy in monitoring these functions in a longitudinal fashion. To do so, we addressed four research objectives: feasibility, validity, analysis of change in performance over time, and the utility of FarmApp for linking causal factors such as genetic diagnosis to cognitive processes.
Feasibility
The assessment of feasibility aimed to answer specific questions regarding accessibility to wide ranges of age and adaptive function, and the advantages of self-paced testing over a longer (two week) period of time. We found that FarmApp can be used to obtain analyzable data across wide range of ages and global adaptive function. Second, we observed that more than half of recruited participants were able to provide analyzable data in RA mode, but this proportion increased in Child mode, when children could play at their own time and pace. In particular, the proportion of lower ability participants (BINGO) who provided sufficient data for analysis increased by almost 50% for the Chicken and Sheep games in Child mode. Furthermore, many participants in the BINGO sample struggled to complete a standardized cognitive assessment (e.g., WASI-II), but found FarmApp games in Child mode intuitive and enjoyable by comparison. This is illustrative of FarmApp’s potential to capture cognitive competence in individuals with NDD, where traditional one-off neuropsychological testing, while very useful in some cases, might be suboptimal. Moreover, remote assessment via FarmApp can yield multiple samples of performance and add opportunities to observe fluctuations in cognitive performance over timescales of hours, days, and weeks. Nevertheless, we acknowledge that younger children and participants with more severe global impairments were less likely to provide sufficient data for analysis of tasks, which has been a challenge in similar studies (Kaat et al., Citation2021). This was especially relevant for the Memory game which required a minimum threshold of play and exposure to stimuli before becoming available on the App. This is something we wish to incorporate in future improvements of FarmApp to broaden accessibility, whilst retaining adaptive elements of the design that maintain motivation, and avoiding ceiling effects for more able participants. For instance, increasing stimulus presentation duration in the Sheep and Chicken games, and decreasing the span level in the Chicken game might improve the feasibility of the app for individuals with neurodevelopmental difficulties who have lower adaptive abilities.
Validity
In the validity analysis, FarmApp performance of the combined BINGO and CALM samples related to parental reports of everyday behaviors assessed via a standardized questionnaire of measuring ADHD-related behaviors. Specifically, both Sheep and Chicken performance metrics correlated in the expected direction with symptoms of inattention, hyperactivity, and executive dysfunction. These results suggest that FarmApp taps cognitive processes contributing to everyday behavior, and can be a useful tool for understanding mechanisms contributing to behavioral difficulties in young people with neurodevelopmental challenges. The validity study has the caveat of a relatively small sample size, with potential contributions of ceiling effects within the CALM sample. For this reason, we have replicated the same analysis with the BINGO sample only. The results, reported in the Supplementary material, confirm the same correlations that we observed in the combined BINGO and CALM samples.
Change over time
Overall, the goal of two weeks longitudinal self-directed assessment was to determine whether participants would improve their performance, if given the opportunity to practice a specific task. In order to assess the utility of FarmApp in measuring performance over time, we focussed our analysis on the Sheep game, because of the large amount of data provided by participants in this task. By fitting LMMs, we explored the relationship between time and performance, and potential contributions (or interactions) of participants’ adaptive ability to improvement in inhibitory control. When allowing our models to vary for age and across subjects (random effects), we found a significant interaction of adaptive ability (Vineland ABC) on the relationship between number of blocks (i.e. time playing the game) and the improvement at inhibiting the response to the no-go stimuli (indexed by a reduction in stimulus duration). Although this shows how FarmApp can be an effective measure of improvement in participants with lower adaptive functioning, children with higher functioning quickly adapted their performance, with smaller range of stimulus duration available to demonstrate longer-term improvement. Alternatively, the drop in performance over time in individuals with higher abilities might indicate a potential habituation effect. We observed these individuals quickly reach ceiling level when playing the Sheep game, which potentially might reflect decrease in interest and motivation to continue playing early on. It is important to consider this finding in the generation of the next version of FarmApp. The practice and warm-up phases can be used to establish participants’ baseline performance, such that by increasing the range of stimulus presentation rates in the Sheep game and the number of hutches in the Chicken game, initial task difficulty can be established as appropriate for individual adaptive ability. This modification may enable FarmApp to serve as an effective measure of improvement for individuals with neurodevelopmental difficulties with higher adaptive abilities.
Furthermore, we explored whether behavioral traits would have an effect on change in performance, or predictive value in our model estimates, namely inattention, hyperactivity, and EF. We found that hyperactivity was associated with progressively better inhibitory ability (no-go accuracy), measured as a reduction in stimulus duration over blocks. Albeit counterintuitive, this outcome highlights how individuals who have higher rates of ADHD-related behavioral problems, might still be able to improve on FarmApp games. In other words, FarmApp could be a sensitive tool for measuring change in cognitive performance in individuals with lower adaptive abilities and higher levels of ADHD-related behavioral difficulties. An alternative interpretation is that for those individuals with lower adaptive ability, greater levels of ADHD-related behavioral difficulties and poorer baseline performance, there was more scope for improvement on the game over time. Specifically, longer term testing enabled these participants to demonstrate their “best possible” performance. In contrast, individuals with higher adaptive ability, lower levels of ADHD-related behavioral difficulties, and better baseline performance may have been at, or close to, ceiling level at the outset, and therefore improved only marginally over the two-week period. One way to explore which of the two alternative interpretations is more valid would be to carry out a separate study comparing change in performance over time in children diagnosed with ADHD and age-matched controls.
Future studies could explore how fluctuations (beyond improvement with practice) in specific aspects of FarmApp performance within an individual, may mirror their variation in engagement with education, social interactions, or emotional tone. Potentially, this could highlight opportunities for targeted interventions to improve extrinsic modifiable factors such as sleep and diet, or neurochemical modulation aimed at individual’s most vulnerable neural systems and cognitive skills. Finally, it would be useful to integrate measures of digital device use, to check whether familiarity with technology predicts the level of engagement and performance at FarmApp during the longer term data collection.
Causal factors and cognitive mechanisms
Finally, to assess the utility of the method for linking causal factors and cognitive processes, we compared FarmApp task performance between individuals with neurodevelopmental difficulties due to different genetic variants, grouped according to gene function (Baker et al., Citation2015). We found that, after controlling for age and adaptive ability, the chromatin group performed significantly better than the synaptic group on the go/no-go task, but performance did not differ between groups on spatial short-term memory or long-term memory tasks. These findings are in line with current models of synaptic regulatory mechanisms and synaptic-related genetic disorders, and their effects on attentional control (Cea-Del Rio et al., Citation2020; Pfeiffer & Huber, Citation2009). For instance, poorer performance in tasks requiring inhibitory control has been reported in Fragile X Syndrome (FXS), a synaptic-related syndrome, in children and adults, supported both in cross-sectional and longitudinal studies (Cornish et al., Citation2012; Munira et al., Citation2000; Scerif et al., Citation2007; Wilding et al., Citation2002). We speculate that synaptic disorders have a direct and continuous impact on cognitive processes requiring fast information processing and adaptation of responses over short (millisecond to seconds) timescales. In contrast, chromatin-related disorders are more likely to mediate their impact on cognition and learning over longer timescales via altered gene transcription and slower adaptations to neuronal biology and neural network function, of maximal importance during critical periods of brain development. Our results support the general hypothesis that multiple cognitive processes contribute to learning in neurodevelopmental disorders, and that genetic disorders (and functional network groups) can have a disproportionate, if not selective, impact on specific cognitive processes.
In addition, whilst the chromatin-related group’s performance stayed relatively stable, the synaptic-related group improved over time. Similar to the whole sample findings on change over time, this may reflect differential capacity for improvement on this task for individuals with synaptic-related disorders and more severe ID, who have more difficulties performing the task at baseline. Alternatively, different functional networks influence different physiological mechanisms that might either contribute to the acquisition of skills, or to skill and competence-level maintenance. Our results suggest that individuals with synaptic-related disorders, when compared to the chromatin group, might require more opportunity, or time, to acquire competence and reach their maximal ability on this task. A similar trend has been observed in young children with FXS. Cornish et al. (Citation2012), in a three-year perspective study, observed that boys with FXS improved in their visual attentional cognitive control over time. Furthermore, it is important to highlight that FarmApp’s ability to sensitively track changes in performance in synaptic and chromatin-related networks, is a first step toward systematically evaluating lower level cognitive abilities and their developmental dynamics in individuals with neurodevelopmental disorders of known genetic cause. In summary, our final analysis showed how FarmApp can be utilized to investigate whether genetic diagnosis influences change in cognitive performance.
Limitations
Although we performed extensive piloting with three different age groups, and in both typically developing children and children with NDD, we did not formally assess user and families’ experiences with FarmApp. In addition, the power of our results is limited by the relatively small sample sizes, especially in the FNG analysis and in the Memory game. As mentioned earlier, in Child mode the Memory game was unlocked after completing one continuous run of Sheep and Chicken games within the same session, and did not have any reward or progress bar as an incentive to continue playing. These factors may have contributed to the high rate of drop out of participants in this game. Furthermore, the utility of assessing performance over time is highly dependent on the statistical methods employed to measure dynamic change in performance. Keeping this in mind, we applied LMMs that take into account variability between and within subjects (Hesselmann, Citation2018). In addition, the amount of time allowed for longitudinal data collection (two weeks) might not have been sufficient to observe change in performance for all participants. There was also a high degree of variability in amount of data acquired for each participant during this time, a limitation inherent to participant-led assessment. A useful analysis that might provide more details about individual oscillations in performance could be the systematic mapping of sensitive periods in learning curves, or the “tipping point” where the individual slopes start to change. In addition, when measuring change in performance over time, we have consistently focused on inhibitory control during the go/no-go task, therefore future development of FarmApp is needed to facilitate dynamic analysis of short-term and long-term memory tasks.
Conclusion
The present study offers a new cognitive assessment platform, i.e. intuitive, easy to use, and most of all, feasible for individuals who have difficulties attending to and understanding task instructions. Moreover, FarmApp has the additional benefit of offering longitudinal monitoring of cognitive performance over time. Current findings represent a promising avenue for the use of touchscreen tools, and remote and long-term assessment, to measure cognitive competence with an additional opportunity to investigate dynamic aspects of development. Future studies will provide new insights into the relationships between cognitive processing and behavioral variation over different timescales, and the influence of specific genetic diagnosis on emergent cognitive differences.
CNY-OA_21-118-File007.docx
Download MS Word (1.8 MB)Disclosure statement
No potential conflict of interest was reported by the author(s).
Supplementary material
Supplemental data for this article can be accessed at https://doi.org/10.1080/09297049.2022.2054968
Additional information
Funding
References
- Alloway, T. P., Gathercole, S. E., Kirkwood, H., & Elliott, J. (2008). Evaluating the validity of the automated working memory assessment. Educational Psychology, 28(7), 725–734. https://doi.org/10.1080/01443410802243828
- Baker, K., Scerif, G., Astle, D. E., Fletcher, P. C., & Raymond, F. L. (2015). Psychopathology and cognitive performance in individuals with membrane-associated guanylate kinase mutations: A functional network phenotyping study. Journal of Neurodevelopmental Disorders, 7(1), 8. https://doi.org/10.1186/s11689-015-9105-x
- Bates, D., Mächler, M., Bolker, B. M., & Walker, S. C. (2015). Fitting linear mixed-effects models using lme4. Journal of Statistical Software, 67(1). https://doi.org/10.18637/jss.v067.i01
- Cea-Del Rio, C. A., Nunez-Parra, A., Freedman, S. M., Kushner, J. K., Alexander, A. L., Restrepo, D., & Huntsman, M. M. (2020). Disrupted inhibitory plasticity and homeostasis in Fragile X syndrome. Neurobiology of Disease, 142, 104959. https://doi.org/10.1016/j.nbd.2020.104959
- Conners, C. (2008). Conner’s 3rd edition technical manual (3rd Edit ed.). MHS Assessments.
- Cornish, K., Cole, V., Longhi, E., Karmiloff-Smith, A., & Scerif, G. (2012). Does attention constrain developmental trajectories in fragile x syndrome? a 3-year prospective longitudinal study. American Journal on Intellectual and Developmental Disabilities, 117(2), 103–120. https://doi.org/10.1352/1944-7558-117.2.103
- Hesselmann, G. (2018). Applying linear mixed effects models (LMMs) in within-participant designs with subjective trial-based assessments of awareness-a caveat. Frontiers in Psychology, 9(MAY), 1–5. https://doi.org/10.3389/fpsyg.2018.00788
- Hessl, D., Nguyen, D. V., Green, C., Chavez, A., Tassone, F., Hagerman, R. J., Senturk, D., Schneider, A., Lightbody, A., Reiss, A. L., & Hall, S. (2009). A solution to limitations of cognitive testing in children with intellectual disabilities: The case of fragile X syndrome. Journal of Neurodevelopmental Disorders, 1(1), 33–45. https://doi.org/10.1007/s11689-008-9001-8
- Hessl, D., Sansone, S. M., Berry-Kravis, E., Riley, K., Widaman, K. F., Abbeduto, L., Schneider, A., Coleman, J., Oaklander, D., Rhodes, K. C., & Gershon, R. C. (2016a). The NIH toolbox cognitive battery for intellectual disabilities: Three preliminary studies and future directions. Journal of Neurodevelopmental Disorders, 8(1), 35.
- Hessl, D., Sansone, S. M., Berry-Kravis, E., Riley, K., Widaman, K. F., Abbeduto, L., Schneider, A., Coleman, J., Oaklander, D., Rhodes, K. C., & Gershon, R. C. (2016b). The NIH toolbox cognitive battery for intellectual disabilities: Three preliminary studies and future directions. Journal of Neurodevelopmental Disorders, 8(1), 1–18. https://doi.org/10.1186/s11689-016-9167-4
- Holmes, J., Bryant, A., & Gathercole, S. E. (2019). Protocol for a transdiagnostic study of children with problems of attention, learning and memory (CALM). BMC Pediatrics, 19(1), 10. https://doi.org/10.1186/s12887-018-1385-3
- Holmes, J., Gathercole, S. E., & Dunning, D. L. (2009). Adaptive training leads to sustained enhancement of poor working memory in children. Developmental Science, 12(4), F9–15. https://doi.org/10.1111/j.1467-7687.2009.00848.x
- Houwen, S., Visser, L., van der Putten, A., & Vlaskamp, C. (2016). The interrelationships between motor, cognitive, and language development in children with and without intellectual and developmental disabilities. Research in Developmental Disabilities, 53, 19–31. https://doi.org/10.1016/j.ridd.2016.01.012
- Kaat, A. J., McKenzie, F. J., Shields, R. H., LaForte, E., Coleman, J., Michalak, C., & Hessl, D. R. (2021). Assessing processing speed among individuals with intellectual and developmental disabilities: A match-to-sample paradigm. Child Neuropsychology : A Journal on Normal and Abnormal Development in Childhood and Adolescence, 1–13. https://doi.org/10.1080/09297049.2021.1938987
- Karmiloff-Smith, A. (2013). Challenging the use of adult neuropsychological models for explaining neurodevelopmental disorders: Develop ed versus develop ing brains: The 40th Sir Frederick Bartlett Lecture. The Quarterly Journal of Experimental Psychology, 66(1), 1–14. https://doi.org/10.1080/17470218.2012.744424
- Klingberg, T. (2010). Training and plasticity of working memory. Trends in Cognitive Sciences, 14(7), 317–324. https://doi.org/10.1016/j.tics.2010.05.002
- Manly, T., Anderson, V., Nimmo-Smith, I., Turner, A., Watson, P., & Robertson, I. H. (2001). The differential assessment of children’s attention: The Test of Everyday Attention for Children (TEA-Ch), normative sample and ADHD performance. Journal of Child Psychology and Psychiatry, and Allied Disciplines, 42(8), 1065–1081. https://doi.org/10.1111/1469-7610.00806
- Munira, F., Cornisha, K. M., & Wildingb, J. (2000). A neuropsychological profile of attention deficits in young males with fragile X syndrome. Neuropsychologia, 38(9), 1261–1270. https://doi.org/10.1016/S0028-39320000036-1
- Pfeiffer, B. E., & Huber, K. M. (2009). The state of synapses in fragile X syndrome. The Neuroscientist, 15(5), 549–567. https://doi.org/10.1177/1073858409333075
- Roid, G. H., & Miller, L. J. (1997). Leiter international performance scale-revised (Leiter-R). Stoelting.
- RStudio Team. (2020). RStudio: Integrated Development Environment.
- Scerif, G., Cornish, K., Wilding, J., Driver, J., & Karmiloff-Smith, A. (2007). Delineation of early attentional control difficulties in fragile X syndrome: Focus on neurocomputational changes. Neuropsychologia, 45(8), 1889–1898. https://doi.org/10.1016/j.neuropsychologia.2006.12.005
- Shields, R. H., Kaat, A. J., McKenzie, F. J., Drayton, A., Sansone, S. M., Coleman, J., Michalak, C., Riley, K., Berry-Kravis, E., Gershon, R. C., Widaman, K. F., & Hessl, D. (2020). Validation of the NIH toolbox cognitive battery in intellectual disability. Neurology, 94(12), e1229–e1240. https://doi.org/10.1212/WNL.0000000000009131
- Sparrow, S., Cicchetti, D., & Balla, D. A. (2005). Vineland adaptive behavior scales (2nd ed.) (Vineland-II). AGS Publishing.
- Steele, A., Scerif, G., Cornish, K., & Karmiloff-Smith, A. (2013). Learning to read in Williams syndrome and Down syndrome: Syndrome-specific precursors and developmental trajectories. Journal of Child Psychology and Psychiatry, 54(7), 754–762. https://doi.org/10.1111/jcpp.12070
- Su, C. Y., Chen, C. C., Wuang, Y. P., Lin, Y. H., & Wu, Y. Y. (2008). Neuropsychological predictors of everyday functioning in adults with intellectual disabilities. Journal of Intellectual Disability Research : JIDR, 52(1), 18–28. https://doi.org/10.1111/j.1365-2788.2007.00969.x
- Tamm, L., Epstein, J. N., Peugh, J. L., Nakonezny, P. A., & Hughes, C. W. (2013). Preliminary data suggesting the efficacy of attention training for school-aged children with ADHD. Developmental Cognitive Neuroscience, 4, 16–28. https://doi.org/10.1016/j.dcn.2012.11.004
- Thompson, T., Coleman, J. M., Riley, K., Snider, L. A., Howard, L. J., Sansone, S. M., & Hessl, D. (2018). Standardized assessment accommodations for individuals with intellectual disability. Contemporary School Psychology, 22(4), 443–457. https://doi.org/10.1007/s40688-018-0171-4
- Ullman, M. T., & Pullman, M. Y. (2015). A compensatory role for declarative memory in neurodevelopmental disorders. Neuroscience & Biobehavioral Reviews, 51, 205–222.
- Van Bokhoven, H. (2011). Genetic and epigenetic networks in intellectual disabilities. Annual Review of Genetics, 45(1), 81–104. https://doi.org/10.1146/annurev-genet-110410-132512
- Waite, J., Heald, M., Wilde, L., Woodcock, K., Welham, A., Adams, D., & Oliver, C. (2014). The importance of understanding the behavioural phenotypes of genetic syndromes associated with intellectual disability. Paediatrics & Child Health, 24(10), 468–472. https://doi.org/10.1016/j.paed.2014.05.002
- Wechsler, D. (2011). WASI-II: Wechsler abbreviated scale of intelligence. PsychCorp.
- Wei, T., Simko, V., Levy, M., Xie, Y., Jin, Y., & Zemla, J. (2017). Package ‘corrplot’. Statistician, 56(316), e24. https://github.com/taiyun/corrplot
- Wilding, J., Cornish, K., & Munir, F. (2002). Further delineation of the executive deficit in males with fragile-X syndrome. Neuropsychologia, 40(8), 1343–1349. https://doi.org/10.1016/S0028-39320100212-3