
 ?Mathematical formulae have been encoded as MathML and are displayed in this HTML version using MathJax in order to improve their display. Uncheck the box to turn MathJax off. This feature requires Javascript. Click on a formula to zoom.
Abstract
The design of an ultrafast double-pulse stretcher–compressor, which can be utilized in applications like Raman chirped adiabatic passage experiments, is presented. Experimental PG FROG traces obtained for a single-pulse output of such a stretcher–compressor support the design. However, the FROG traces of a double-pulse output are not intuitive and not fully retrievable. Therefore, a code was developed to simulate these FROG traces and investigate their dependence on the delay between the two slices of the double-pulse. The results are presented here and can be employed as a diagnostic tool in different applications where ultrafast laser double-pulses are used. The simulations reveal that the FROG traces strongly depend on the delay between the two slices of the double-pulse when this delay is comparable to the pulse duration. The simulations also suggest that using a transform-limited single-pulse as the gate in the PG FROG instrument leads to simpler FROG traces.
1. Introduction
Quantum control has been utilized in many areas of science including quantum information [Citation1,Citation2], control of chemical reactions [Citation3–6], and even high precision measurements [Citation7–9]. Different schemes have been developed for the selective excitation of electronic, vibrational, and rotational states of atoms and molecules. Among these, adiabatic passage techniques have opened new opportunities for modern quantum control. Refs. [Citation10–12] provide reviews of different adiabatic passage schemes. Raman Chirped Adiabatic Passage (RCAP) is one of these effective schemes which was proposed more than two decades ago [Citation13]. Two ultrafast laser pulses with centre frequencies and
(
), where the high-frequency pulse has negative chirp and the low-frequency one has positive chirp, can be used to climb the anharmonic vibrational ladder of a molecule through the RCAP process, provided that the introduced chirp is large enough to support the anharmonicity of the ladder. Theoretical analysis of RCAP process for
and
molecules suggest it as an efficient scheme to selectively populate the higher vibrational levels and to dissociate the molecular bonds while maintaining a very low final kinetic energy of the fragments [Citation13,Citation14]. Numerical calculations show that RCAP is a feasible scheme to climb the vibrational ladder of oxygen and chlorine molecules, even when the respective rotational levels are included in the model [Citation15]. More recently, it was shown that
molecule can also be exited using RCAP to high vibrational levels. X-ray Absorption Spectroscopy (XAS) was suggested in that work as an effective technique to monitor the vibrational dynamics built by RCAP [Citation16,Citation17]. On the experimental side, enhanced ionization of
molecule in the presence of two oppositely chirped pulses has been attributed to the occurrence of RCAP process and was introduced as the first experimental realization of vibrational ladder climbing through the RCAP process. A dual-wavelength Ti:Sapphire amplifier, two separate compressors, a wavelength separator, a chirp inverter, and two delay lines were used for controlling the phase of the two pulses needed for the experiment [Citation18]. Alternatively, our proposed double-pulse stretcher–compressor is self-contained and compatible with conventional Ti:Sapphire amplifiers as well as other broadband laser sources which significantly simplifies the implementation of RCAP experiments for a variety of different molecules. It can also be utilized for other applications where a simple, low-cost instrument for the generation of phase-controlled ultrafast double-pulses is desired.
Many different techniques based on prism [Citation19,Citation20], grating [Citation21,Citation22], or grism [Citation23–25] arrangements, chirped mirrors [Citation26,Citation27], and pulse shaping [Citation28,Citation29] are available for the control of the phase of ultrashort laser pulses. Good reviews about the topic are provided in [Citation30,Citation31]. Pulse shaping of ultrafast pulses can be accomplished using a variety of different spatial light modulator techniques such as liquid crystal, multiple quantum well (MQW), micro-electromechanical systems (MEMS), acousto-optic modulators (AOMs), etc. In the particular case of Fourier transform pulse shapers, conventional liquid crystal spatial light modulators (SLMs) are used to modify the spectral amplitude and phase of femtosecond laser pulses. SLMs present limitations for shaping very intense pulses due to the fact that these pulses can cause laser-induced permanent damage to the SLM’s substrate. The laser-induced damage threshold (LIDT) of conventional SLMs depends on several pulse characteristics like wavelength, pulse duration, repetition rate, beam diameter, pulse spatial and temporal profile, and angle of incidence [Citation32,Citation33]. But in general, their damage threshold is much lower than other conventional techniques like prism or grating arrangements, which makes them an unattractive option for high-power applications.
Grating arrangements can provide a larger dispersion compared to prism-based ones and are ideal for the applications where a large chirp needs to be introduced to the pulse. In a grating arrangement the spectrum of the short pulse is separated by angular dispersion in such a way that different wavelengths experience different optical path lengths. If red wavelengths have longer optical paths in the arrangement, negative second-order dispersion (also called negative group delay dispersion or negative linear chirp) is introduced and the arrangement is termed a compressor. If blue wavelengths have longer optical paths positive linear chirp is introduced to the pulse and the arrangement is termed a stretcher. One of the most common arrangements, proposed by Martinez, uses two diffraction gratings in anti-parallel configuration and a 1:1 telescope placed between them. This setup can be used as stretcher or compressor by translating one of the gratings on either side of the focal plane [Citation34,Citation35]. This design can be folded by a mirror, requiring only one lens and one grating in the setup which makes it much easier to align [Citation35,Citation36]. In order to avoid material dispersion in the lenses and reduce the chromatic and spherical aberrations, all-refractive grating pair [Citation37,Citation38] and all-reflective single-grating [Citation39–41] stretchers have been implemented. Our proposed stretcher–compressor setup is inspired from the Zhou [Citation39] and Banks [Citation41] designs and enables us to simultaneously introduce positive chirp to one of the two slices of a double-pulse, while introducing negative chirp to the other slice.
2. Methods
2.1. Experimental setup
The transform-limited output of a Ti:Sapphire amplifier operating at 1 kHz centred at ∼804 nm with a pulse duration of ∼40 fs was directed to the experimental setup shown in Figure (A). The input and output pulses were characterized using a single-shot PG FROG (polarization-gating frequency-resolved optical gating) instrument.
Figure 1. (A) Schematic of the single-pulse stretcher–compressor, (B) schematic of the double-pulse stretcher–compressor, (C) splitting the input single-pulse to a double-pulse. The high-frequency and low-frequency slices are shown. (D) Simulated transform-limited FROG trace of the input pulse (E) Experimental transform-limited FROG trace of the input pulse.
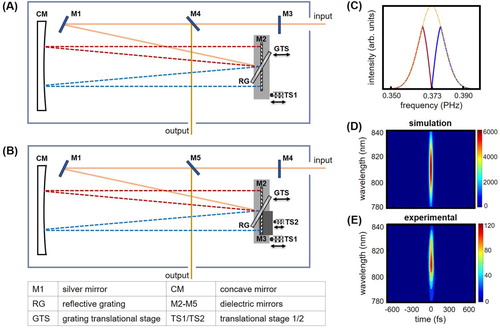
The experimental setup (Figure (A)) is indeed an all-reflective single-grating arrangement [Citation39,Citation41] which we propose to be converted to a double-pulse stretcher–compressor (Figure (B)) by replacing the M2 dielectric mirror with two similar dielectric mirrors M2 and M3. This splits the input pulse into a high-frequency and a low-frequency slice as shown in Figure (C). The two slices can be then delayed with respect to each other (first order dispersion) using a translational stage (TS2 in Figure (B)). The second-order dispersion of each slice can be adjusted by tilting the M2 or M3 mirrors, as we will demonstrate in Section 3.1. The proposed setup enables one to generate two oppositely chirped pulses which can be employed in different applications including RCAP experiments.
It is important to note that cutting the spectrum at the position of M2 and M3 does not affect the beam quality, as the beam is at a focus. Some frequency components are lost in the gap, but the components which get through have an intact beam profile.
2.2. Simulations
A Gaussian ultrafast laser pulse can be mathematically described in the frequency domain using the following equation [Citation31].
(1)
(1) where
is the pulse duration (full-width at half-maximum, FWHM, of the temporal intensity profile),
is the centre frequency, and
is the spectral phase. This pulse is then multiplied by two linearly decreasing functions to split it into two slices in the frequency domain and generate the double-pulse shown in Figure (C). The spectrum of the original pulse is cut with a linear roll off. However, the results are not sensitive to the exact cut, as a simple notch yielded virtually identical results. Different orders of dispersion were added to the pulse by adjusting the spectral phase. The PG FROG traces were constructed using the following equation [Citation42].
(2)
(2)
The transform-limited experimental and simulated FROG traces are shown in Figure (D,E), respectively.
3. Results and discussion
3.1. Equivalence of applying chirp by moving the grating or by tilting the centre mirror
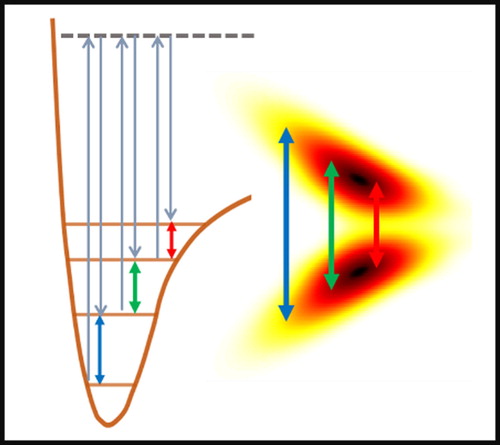
The main objective of the proposed stretcher is to generate oppositely chirped pulses where the high-frequency slice of the double-pulse has negative second-order dispersion and the low-frequency slice has positive second-order dispersion. Such oppositely chirped double-pulse can be utilized to climb the anharmonic vibrational ladder of a molecule through the RCAP process, as shown in Figure . As mentioned in Section 2, this can be achieved by tilting the M2 and M3 mirrors in Figure (B). In regular stretchers, linear chirp is applied by translating the reflective grating (RG in Figure (A)) toward or away from the curved mirror. In this section, we demonstrate that titling the centre mirror (M2 in Figure (A)) has the same effect as translating the reflective grating.
Figure 2. An oppositely chirped double-pulse can be utilized to climb the vibrational ladder.
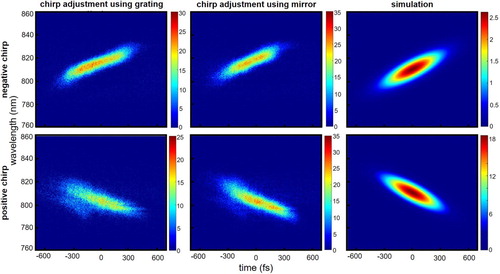
The upper left image in Figure shows the FROG trace of a single-pulse chirped negatively by translating the reflective grating (RG in Figure (A)). Positive chirp is achievable by translating the grating in the opposite direction as shown in the bottom left image of the figure. The middle column of Figure confirms that tilting the centre mirror has the same effect as translating the grating and can introduce positive or negative chirp depending on the direction of the tilt. The right column of the figure shows the results of simulations where only second-order dispersion (negative chirp for upper image and positive chirp for the lower one) was applied to the spectral phase. This confirms that translating the grating or tilting the mirror merely introduces second-order dispersion in our experimental setup and higher orders of dispersion are negligible.
Figure 3. Introducing positive/negative chirp by tilting the centre mirror (middle column) is equivalent to introducing the chirp by translating the reflective grating (left column). The right column shows the results of simulations when only second-order dispersion is present.
These results confirm that it is possible to introduce opposite chirp to the two slices of the double-pulse by tilting the M2 and M3 mirrors in Figure (B). Since we want the high-frequency slice to have negative chirp and the low-frequency slice to have positive chirp, the outer edges of the two mirrors need to be titled towards the curved mirror (CM). This ensures that the highest and the lowest frequency components experience the shortest optical path and arrive earliest.
3.2. FROG traces of the double-pulses with different time delays between the two slices
FROG retrieval algorithms have limited capability to reconstruct the delicate features of double-pulse FROG traces. Moreover, the information about the time delay between the two slices of the double-pulse is difficult to obtain from FROG retrieval algorithms. Simulated FROG traces of single-pulses and a few transform-limited double-pulses [Citation31,Citation42,Citation43] are already available in the literature. However, simulated FROG traces for double-pulses having dispersion, and their dependence on the delay between the two slices of the double-pulse have not been published, to the best of our knowledge. Moreover, our application has the additional complexity that the two slices have different non-overlapping spectra. Thus, simulated FROG traces are required for the development of our proposed double-pulse stretcher–compressor and can also be utilized as a diagnostic tool for other double-pulse applications, as direct retrieval is not an option. Therefore, a MATLAB script was written to simulate the relevant FROG traces. The results of the simulations are provided in this and the following sections.
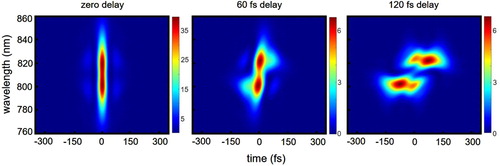
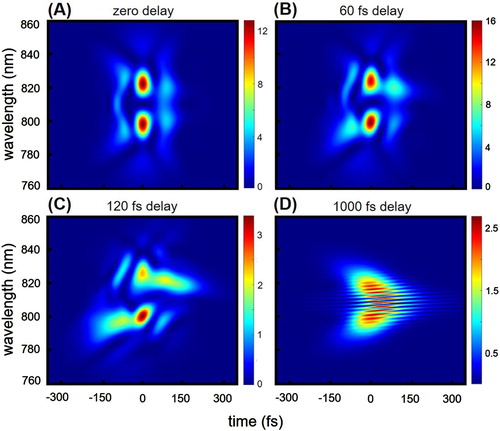
The dependence of the FROG traces on the delay between two slices of the double-pulse when this delay is comparable to the pulse duration (small-delay limit) is investigated first. The case of both zero second-order dispersion and non-zero second-order dispersion were considered. Figure shows the simulated FROG traces for the case where the second-order dispersion is zero, at three different time delays (0, 60, and 120 fs) between the two slices. As seen in the left panel, a double-pulse as short as the input single-pulse is achievable if the delay between the two slices is zero. However, the FROG traces are counterintuitive for longer delays.
Figure 4. Dependence of the FROG traces on the time delay between the two slices (small-delay limit), when no second-order dispersion is present.
The FROG traces are even less intuitive when the second-order dispersion is non-zero and the two slices are oppositely chirped. Figure (A) shows the FROG trace of a double-pulse where the high-frequency slice has negative chirp, and the low-frequency one has positive chirp, while the delay between the two slices is kept zero. As seen, the FROG trace looks nothing like the schematic in Figure . Similar to the previous case, the FROG traces change shape as the delay between the two slices is increased, as shown in Figures (B,C). From an experimental standpoint, precise control of the delay between the two slices, corresponding to the use of a translational stage with small enough step size (TS2 in Figure (B)), is required to obtain a FROG trace similar to the one predicted in Figure (A). Note that at a large delay (Figure (D)), the FROG trace begins to look like what one would expect from Figure , but since the two slices are not occurring at the same time, the actual double-pulse is not like Figure .
Figure 5. Dependence of the FROG traces on the time delay between the two slices when they are chirped oppositely.
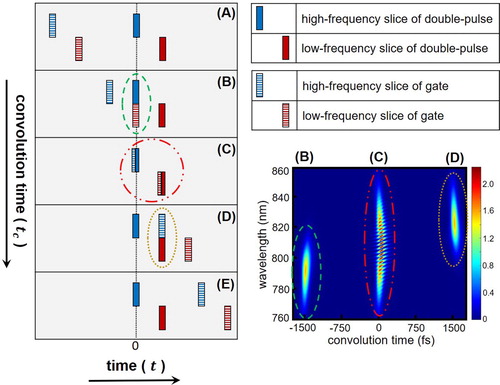
FROG traces when the delay between the two slices of the double-pulse is significantly larger than the pulse duration (large-delay limit) are interesting. As shown in Figure (D), such FROG trace looks increasingly like what is expected intuitively for two oppositely chirped pulses, although, again, this is deceptive, as the two slices are very farther apart in time. In this case, the FROG trace has additional features that need to be explained. During a FROG measurment, as the gate pulse scans the time domain (), it convolutes with the double-pulse at three different instants in convolution times (
) indicated in Figure (B–D). This creates three images separated by a time interval equal to the time delay between the two slices of the double-pulse (at −1500, 0, and 1500 fs in the FROG trace of Figure , where the time delay between the two slices of the double-pulse is 1500 fs).
Figure 6. Formation of three images in the FROG trace for large-delay limit.
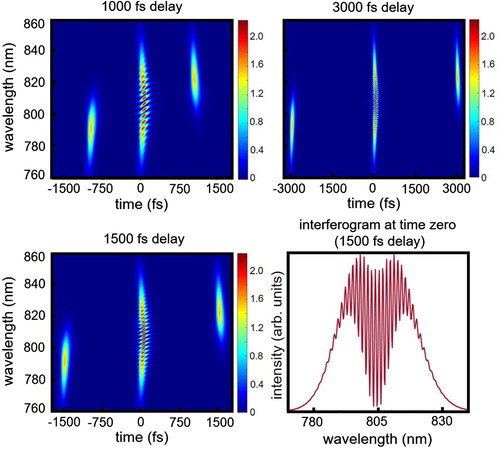
Since the convolution signal around zero convolution time (), indicated by C in the figure, has two components with a delay in time (
), an interferogram is generated after transforming to the frequency domain. The resultant interferogram at zero convolution time is shown in the right bottom panel of Figure . The spacing between the fringes of the interferograms depends on the delay between the two slices of the double-pulse and is reduced as the delay between the two slices is increased, as seen in Figure . The spacing between the fringes is clear when the delay between the two slices of the double-pulse is 1000 fs (top left panel of Figure ), but it becomes very small and barely distinguishable for 3000 fs (top right panel of Figure ). To detect theses interferograms experimentally the resolution of the FROG detector needs to be sufficiently smaller than this spacing.
Figure 7. Dependence of the FROG traces on the time delay between the two slices (large-delay limit). The spacing between the fringes of the interferograms depends on the delay between the two slices.
3.3. Using a transform-limited single-pulse as the gate
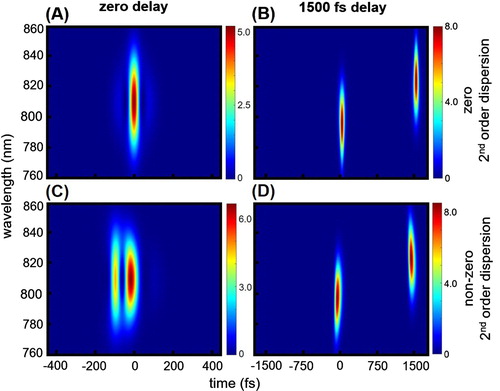
Given the complexity of the FROG traces, our simulations suggest that using a transform-limited single-pulse as the gate can produce simpler FROG traces. However, the alignment of the FROG instrument would be more difficult in this case.
The top panel in Figure shows the FROG traces for double-pulses with zero second order dispersion in both small-delay (0 fs, Figure (A)) and large-delay (1500 fs, Figure (B)) limits, when a transform-limited pulse is used as the gate. Results of similar simulations for oppositely chirped double-pulses are shown in the bottom panels (Figure (C,D)). As seen, the FROG traces for both small-delay and large-delay limits are much simpler when a transform-limited gate is used, compared to the ones that obtained previously (Figure and Figure ) with a replica of the signal as the gate.
Figure 8. Using a transform-limited pulse as the gate reduces the complexity of the FROG traces. FROG traces when the two slices have (A) zero delay and zero second-order dispersion, (B) 1500 fs delay and zero second-order dispersion, (C) zero delay and non-zero second-order dispersion, and (D) 1500 fs delay and non-zero second-order dispersion.
3.4. Dependence on the cutting width
The cutting width of the spectrum is another parameter affecting the FROG traces and needs to be investigated. The cutting width is the gap between the two maxima of the double-pulse in the frequency domain, caused by the elimination of the centre part of the spectrum in the experimental setup. A non-zero cutting width is inevitable due to the fact that there needs to be a non-zero distance between the M2 and M3 mirrors in the experimental setup (Figure (B)).
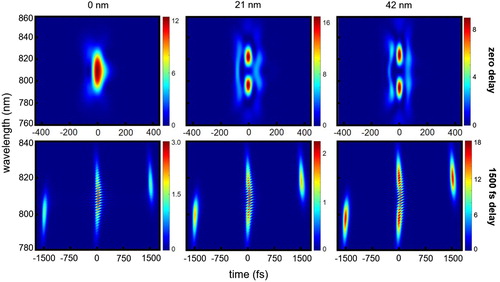
Results for both small-delay and large-delay limits for a double-pulse with oppositely chirped slices at three different cutting widths (0, 21, and 42 nm) are shown in the upper and lower panels of Figure . As expected, the only major effect is a reduced intensity at the centre of the FROG traces when the cutting width is increased. It would be ideal to keep the cutting width minimal in the experimental setup to make use of the entire spectrum of the pulse. All the simulations in the previous sections were generated by considering a 21 nm cutting width. Furthermore, as mentioned above, the results are insensitive to the exact functional form of the cut. For example, a straight notch with the same width gives very similar results.
Figure 9. Dependence of the FROG traces on the cutting width.
4. Conclusion and future work
It was demonstrated experimentally that tilting the centre mirror of the stretcher–compressor is equivalent to translating the reflective grating and introduces pure second-order dispersion to the input pulse. This equivalence is the principle working mechanism of our proposed double-pulse stretcher–compressor. The desired second-order dispersion can be introduced to each slice of the double-pulse separately by tilting the respective centre mirror. This enables us to generate a double-pulse with oppositely chirped slices which is ideal for RCAP experiments.
The challenging part is the characterization of the generated double-pulses. The relevant PG FROG traces are counterintuitive and strongly depend on the delay between the two slices. FROG retrieval algorithms have limited capability in the reconstruction of delicate features of these double-pulse FROG traces and the information regarding the time delay between the two slices is not readily available. Therefore, a code was developed to simulate these FROG traces under different experimental conditions and to investigate their dependence on the delay. The results of the simulations are presented in this work and provide a diagnostic tool for the characterization of double-pulses generated using our proposed double-pulse stretcher–compressor, as well as other similar ultrafast laser double-pulses.
The simulation results show that an output double-pulse almost as short as the input single-pulse is achievable, when zero dispersion is introduced by the stretcher–compressor. Therefore, if an autocorrelator is used to measure the pulse duration experimentally, a close value should be obtainable for both the input and output pulses. The respective FROG traces in this case are almost analogous, as well. However, the FROG traces of the output double-pulse strongly depend on the delay between the two slices when the delay is comparable to the pulse duration.
The FROG trace of an oppositely chirped double-pulse with zero delay between the two slices is counterintuitive and varies quickly with a change in the delay. Therefore, it is very likely for the zero-delay point to be missed when experimental FROG measurements are made, without having the current simulations as a guide. Achieving a zero-delay between the two slices of the double-pulse is essential for conducting dynamical measurements like RCAP. Therefore, a very precise control of the delay between the two slices in the experimental setup along with the simulated FROG traces at hand are required to achieve the zero-delay point. Our simulations also suggest that the use of a transform-limited single-pulse as the gate in the PG FROG instrument leads to simpler FROG traces compared to the case when a replica of the stretcher–compressor output is used as the gate.
We plan to employ the zero-delay oppositely chirped double-pulses, shown in Figure (A), for RCAP measurements on nitrogen and iodine molecules and demonstrate the first experimental realization of excitation on the vibrational ladder through RCAP for these molecules.
Acknowledgments
We would like to thank Drs Berrah, Kharchenko, Trallero, Kling, and Smith for their help, fruitful discussions, and providing us with some of the experimental apparatus.
Disclosure statement
No potential conflict of interest was reported by the author(s).
Additional information
Funding
References
- Monroe C, Kim J. Scaling the ion trap quantum processor. Science. 2013;339:1164–1169.
- Guo J, Feng X, Yang P, et al. High-performance Raman quantum memory with optimal control in room temperature atoms. Nat Commun. 2019;10:1–6.
- Nuernberger P, Wolpert D, Weiss H, et al. Femtosecond quantum control of molecular bond formation. Proc Natl Acad Sci [Internet]. 2010;107:10366–10370. Available from: http://www.pnas.org/content/107/23/10366.abstract.
- Keefer D, De Vivie-Riedle R. Pathways to new applications for quantum control. Acc Chem Res. 2018;51:2279–2286.
- Amitay Z, Levin L, Reich DM, et al. Quantum control in ultrafast coherent bond making. Quantum Information and Measurement (QIM) V: Quantum Technologies [Internet]. Rome: Optical Society of America; 2019. p. F5A.85. Available from: http://www.osapublishing.org/abstract.cfm?URI=QIM-2019-F5A.85.
- Puri P, Mills M, Simbotin I, et al. Reaction blockading in a reaction between an excited atom and a charged molecule at low collision energy. Nat Chem [Internet]. 2019;11:615–621.
- Butts DL, Kotru K, Kinast JM, et al. Efficient broadband Raman pulses for large-area atom interferometry. J Opt Soc Am B. 2013;30:922.
- Kotru K, Butts DL, Kinast JM, et al. Large-area atom interferometry with frequency-swept Raman adiabatic passage. Phys Rev Lett. 2015;115:1–5.
- Saywell J, Carey M, Belal M, et al. Optimal control of Raman pulse sequences for atom interferometry. J Phys B At Mol Opt Phys [Internet]. 2020;53:85006. DOI:10.1088/1361-6455/ab6df6.
- Vitanov N V, Halfmann T, Shore BW, et al. Laser-induced population transfer by adiabatic passage techniques. Annu Rev Phys Chem. 2001;52:763–809.
- Bergmann K, Vitanov NV, Shore BW. Perspective: Stimulated Raman adiabatic passage: The status after 25 years. J Chem Phys [Internet]. 2015;142:1–20.
- Vitanov NV, Rangelov AA, Shore BW, et al. Stimulated Raman adiabatic passage in physics, chemistry, and beyond. Rev Mod Phys. 2017;89:1–66.
- Chelkowski S, Gibson G. Adiabatic climbing of vibrational ladders using Raman transitions with a chirped pump laser. Phys Rev A. 1995;52:R3417–R3420.
- Chelkowski S, Bandrauk AD. Raman chirped adiabatic passage: A new method for selective excitation of high vibrational states. J Raman Spectrosc. 1997;28:459–466.
- Davis JC, Warren WS. Selective excitation of high vibrational states using Raman chirped adiabatic passage. J Chem Phys. 1999;110:4229–4237.
- Engin S, Sisourat N, Selles P, et al. Probing IR-Raman vibrationally excited molecules with X-ray spectroscopy. Chem Phys Lett [Internet]. 2012;535:192–195. DOI:10.1016/j.cplett.2012.03.062.
- Engin S, Sisourat N, Selles P, et al. Theoretical study of Raman chirped adiabatic passage by X-ray absorption spectroscopy: highly excited electronic states and rotational effects. J Chem Phys [Internet]. 2014;140:234303(1-10).
- Xia JF, Sanderson JH, Liu WK, et al. Experimental observation of Raman chirped adiabatic rapid passage. J Phys B At Mol Opt Phys. 2003;36:L409–L414.
- Fork RL, Martinez OE, Gordon JP. Negative dispersion using pairs of prisms. Opt Lett. 1984;9:150–152.
- Akturk S, Gu X, Kimmel M, et al. Extremely simple single-prism ultrashort-pulse compressor. Optics Express. 2006;14:10101–10108.
- Treacy EB. Optical pulse compression with diffraction gratings. IEEE J Quantum Electron. 1969;5:454–458.
- Caracciolo E, Kemnitzer M, Rumpel M, et al. Single-grating-mirror intracavity stretcher design for chirped pulse regenerative amplification. Opt Lett. 2015;40:1532–1535.
- Brito Cruz CH, Becker PC, Fork RL, et al. Phase correction of femtosecond optical pulses using a combination of prisms and gratings. Opt Lett. 1988;13:123–125.
- Kane S, Squier J. Grism-pair stretcher–compressor system for simultaneous second- and third-order dispersion compensation in chirped-pulse amplification. J Opt Soc Am B. 1997;14:661.
- Chauhan V, Bowlan P, Cohen J, et al. Single-diffraction-grating and grism pulse compressors. J Opt Soc Am B [Internet. 2010;27:619. Available from: https://www.osapublishing.org/abstract.cfm?URI=josab-27-4-6190.
- Walmsley L, Waxer L, Dorrer C. The role of dispersion in ultrafast optics. Rev Sci Instrum. 2001;72:1–29.
- Steinmeyer G. Femtosecond dispersion compensation with multilayer coatings: toward the optical octave. Appl Opt. 2006;45:1484–1490.
- Monmayrant A, Weber S, Chatel B. A newcomer’s guide to ultrashort pulse shaping and characterization. J Phys B At Mol Opt Phys. 2010;43:103001(1-34).
- Weiner AM. Ultrafast optical pulse shaping: a tutorial review. Opt Commun. 2011;284:3669–3692.
- Backus S, Durfee CG, Murnane MM, et al. High power ultrafast lasers. Rev Sci Instrum. 1998;69:1207–1223.
- Wollenhaupt M, Assion A, Baumert T. Femtosecond laser pulses: linear properties, manipulation, generation and measurement. In: Träger F, editor. Springer handbook of lasers and optics [Internet]. New York (NY): Springer New York; 2007. p. 937–983. Available from: https://doi.org/10.1007/978-0-387-30420-5_12.
- Tien AC, Backus S, Kapteyn H, et al. Short-pulse laser damage in transparent materials as a function of pulse duration. Phys Rev Lett. 1999;82:3883–3886.
- Carbajo Garcia S, Bauchert K. Power handling for LCoS spatial light modulators. Proc. of SPIE. 2018;10518:105181R(1-9).
- Martinez OE. Design of high-power ultrashort pulse amplifiers by Expansion and Recompression. IEEE J Quantum Electron. 1987;23:1385–1387.
- Martinez OE. 3000 times grating compressor with positive group velocity dispersion: application to fiber compensation in 1.3-1.6 µm region. IEEE J Quantum Electron. 1987;23:59–64.
- Lai M, Lai ST, Swinger C. Single-grating laser pulse stretcher and compressor. Appl Opt. 1993;33:6985.
- Rudd JV, Korn G, Kane S, et al. Chirped-pulse amplification of 55-fs pulses at a 1-kHz repetition rate in a Ti:A1203 regenerative amplifier. Opt Commun. 1993;18:2044–2046.
- Lemoff BE, Barty CPJ. Quintic-phase-limited, spatially uniform expansion and recompression of ultrashort optical pulses. Opt Lett. 1993;18:1651.
- Zhou J, Huang C-P, Shi C, et al. Generation of 21-fs millijoule-energy pulses by use of Ti:sapphire. Opt Lett. 1994;19:126.
- Du D, Bogusch C, Cotton CT, et al. Terawatt Ti:sapphire laser with a spherical reflective-optic pulse expander. Opt Lett. 1995;20:2114.
- Banks PS, Perry MD, Yanovsky V, et al. Novel all-reflective stretcher for chirped-pulse amplification of ultrashort pulses. IEEE J Quantum Electron. 2000;36:268–274.
- Trebino R, Delong KW, Fittinghoff DN, et al. Measuring ultrashort laser pulses in the time-frequency domain using frequency- resolved optical gating. Rev Sci Instrum. 1997;68:3277–3295.
- Trebino R. Improvisation in FROG. frequency-resolved optical gating: the measurement of ultrashort laser pulses [Internet]. Boston (MA): Springer US; 2000. p. 219–228. Available from: https://doi.org/10.1007/978-1-4615-1181-6_11.