
ABSTRACT
This paper explores students’ ability to analyse and interpret empirical data as inadequate data analysis skills and understandings may contribute to the renowned disappointing outcomes of practical work in secondary school physics. Selected competences, derived from a collection of leading curricula, are explored through interviews and practical tasks, each consisting of three probes. The 51 students, aged 15 and commencing post-compulsory science education in the Netherlands, were able to carry out basic skills such as collecting data and representing these. In interpreting the data in terms of the investigated phenomenon or situation however, performance was weak. Students often appeared to be unable to identify the crucial features of a given graph. Conclusions based on the data were often tautological or superficial, lacking salient features. Students failed to infer implications from the data, to interpret data at a higher level of abstraction, or to specify limitations to the validity of the analysis or conclusions. The findings imply that the students’ understanding of data-analysis should be developed further before they can engage successfully in more ‘open’ practical work. The study offers a collection of activities that may help to address the situation, suggesting a baseline for guided development of data analysis abilities.
Introduction
We expect students who have completed the compulsory part of science education to be able to carry out a basic scientific inquiry independently. Focusing on data analysis and interpretation, we explore whether this expectation is justified for Dutch students, and how potential deficiencies may be diagnosed and eventually addressed.
The common approach to educational aims related to scientific inquiry is through practical work (Millar, Citation2010), activities in which students observe or manipulate the objects of interest (Millar et al., Citation1999), and draw conclusions from the data collected (Kanari & Millar, Citation2004). The main purpose of practical work is usually to ‘discover’ physics concepts or enhance conceptual knowledge by establishing the relationship between physical quantities (Hofstein, Citation2017; Millar et al., Citation1999). Although an important part of finding and interpreting these relationships involves carrying out a proper data analysis, enhancing competence in data analysis is rarely the central objective of practical work. Still, students often encounter various insuperable problems when analysing data resulting in superficial and incomplete conclusions (Kanari & Millar, Citation2004) or even ‘alternative science’ (Hodson, Citation1990). A lack of competence in data analysis potentially contributes to the limited learning outcomes of practical work that prompt some to wonder if the same learning goals may and should be achieved with less costly and time consuming methods (Hodson, Citation1990; Hofstein, Citation2017; Hofstein & Kind, Citation2012; Hofstein & Lunetta, Citation2004; Lunetta et al., Citation2007; van den Berg, Citation2013).
This study investigates whether students who have just finished the compulsory part of science education in the Netherlands have the ability to analyse and interpret experimental data by constructing adequate data representations and drawing qualified, appropriate, defensible conclusions from these data. From this baseline, potential deficiencies may be specified as a starting point for designing suitable learning pathways to develop more advanced kinds of science inquiry later.
Research questions
The central research questions are:
How do 15-year old students, after completing compulsory science education and entering a pre-academic science-based exam program analyse experimental data?
What is the quality of that analysis?
Background
Dutch educational system
In the Netherlands, students enter one of three ability levels of lower secondary education at age 12. The stream for preparatory vocational education (opted for by approximately 60% of the Dutch student population) is not considered here, as the study takes place in a school preparing for higher vocational education (opted for by approximately 20%) or university studies (opted for by approximately 20%) (DUO, Citation2017). After three years of lower secondary education with physics as a compulsory subject in the second and third year, students choose between a program oriented towards the natural sciences and towards the humanities, based on their abilities and interests. While broad learning goals have been formulated nationally, there are no exams upon completion of lower secondary, which smoothens the transition to the upper levels but complicates the establishment of national attainment levels of these educational standards. Upper secondary education is concluded with national exams. More detailed information about the Dutch educational system, specifically the role of mathematics and physics, can be found in Tursucu (Citation2019, pp. 24–26).
Scientific literacy
The compulsory part of science education is meant to effect ‘scientific literacy’ in students (Millar & Osborne, Citation1998; Ottevanger et al., Citation2014). Critical, scientifically literate citizens are capable of forming substantiated opinions on ethical and political dilemmas concerning science and technology (Aikenhead, Citation2005; European Commission, Citation1995). An important part of this literacy involves the ability to engage successfully in basic science inquiry and interpret scientific data and evidence, ‘the competency both to construct claims that are justified by data and to identify any flaws in the arguments of others’ (OECD, Citation2013, p. 9). This competency is one of three core competences of scientific literacy and a major aim of science education (Next Generation Science Standards, Citation2013). It involves engaging faculties such as asking relevant questions, collecting and interpreting valid and reliable data, interpreting these data in acceptable ways, making informed choices based on these interpretations, and engaging in the critical debate on each of these issues. Practical work in science is often expected to result in the development of this competency.
Practical work
Practical work is expected to achieve more than developing aspects of scientific literacy or illustration of the empirical aspects of a science discipline. It is used to foster the understanding of scientific concepts, raise interest in scientific disciplines, teach practical skills (e.g. how to manipulate equipment), enhance students’ ability to do science in which the aforementioned faculties are applied and teach students about the nature of science (Abrahams, Citation2011; Dillon, Citation2008; Hofstein, Citation2017; Millar, Citation2010).
To attain these goals, secondary school students usually follow a prescribed, fixed procedure starting with a research question posed by the teacher. Students manipulate the given measuring equipment to collect the necessary data. They analyse and interpret these by answering scaffolding questions often provided in worksheets. As much of the work and thinking has already been done for the students in these highly teacher-directed activities they are called closed or guided (Bell et al., Citation2005; Tamir, Citation1991). However, it is demonstrated and often argued that these closed inquiries do not result in the understandings, attitudes and skills we want students to develop (Hodson, Citation1990, Citation1993, Citation2014; Hofstein & Kind, Citation2012; Holmes et al., Citation2017; Holmes & Wieman, Citation2018; Schwartz et al., Citation2004; Wieman, Citation2015, Citation2016). Various authors (Banchi & Bell, Citation2008; Hodson, Citation2014; Hofstein & Kind, Citation2012; Holmes & Wieman, Citation2018; Wieman, Citation2015; Zion & Mendelovici, Citation2012) recommend (gradually) more ‘open’ activities with more cognitive tasks for students to pursue inquiry learning. It is argued that students learn more and better when given opportunities to make decisions and to evaluate their decision (Hodson, Citation2014; Holmes & Wieman, Citation2018), since only then they are obliged to be engaged minds-on rather than merely hands-on (Abrahams & Millar, Citation2008; Hofstein & Kind, Citation2012). However, the limitations of the actual classroom often mean that students, in any type of practical, collect the data during class but analyse these and reach conclusions at home without the teacher’s help so that the most demanding cognitive tasks (Wieman, Citation2015) are carried out without additional aid. Doing so successfully requires that they can perform an adequate, independent data analysis.
Data analysis in practical work
Previous studies of students’ data analysis competence focused on students aged 14 and younger (Gott & Duggan, Citation1995; Gott & Roberts, Citation2008; Kanari & Millar, Citation2004; Lubben & Millar, Citation1996; Millar et al., Citation1994) involving only qualitative relationships (‘more of A then more of B’) or quantitative relationships at university level (Allie et al., Citation1998; Séré et al., Citation1993; Walsh et al., Citation2019). Other studies involving data-analysis focus on the students’ knowledge of measurement uncertainties (Farmer, Citation2012; Kok et al., Citation2019; Stump et al., Citation2020) or the role and use of graphs (Lachmayer et al., Citation2007; Pospiech et al., Citation2019; von Kotzebue et al., Citation2015). Recent attempts to provide more coherence between mathematics and physics education (Boohan, Citation2016a, Citation2016b; Mooldijk & Sonneveld, Citation2010) show that the problem of using mathematics in physics, and data-analysis skills in particular is still pertinent and unsolved (Tursucu, Citation2019; Wong, Citation2018).
Compulsory science education is expected to prepare students for their pursuit of science at the senior secondary level where they are expected to take agency in and organise independently their own research. It is important to establish a baseline of students’ competence in quantitative data analysis at this stage, since this freedom and autonomy can lead to successful performance only if accompanied by sufficient competence. Rather than passing judgement on how well students do, however, this study is meant to evaluate the outcomes of inquiry-oriented aspects of Dutch compulsory science education. We are unaware of other studies of these competencies in this age group and at this stage.
Theoretical framework
We present the Procedural And Conceptual Knowledge in Science (PACKS) as a model (Millar et al., Citation1994) to discuss the role of data analysis in practical work. We then use various curriculum documents to construct a consensus view on data analysis competences expected of 15 year-olds. We conclude the theoretical framework with an overview and description of these competences.
PACKS
Since practical work often involves setting up and manipulating equipment and gathering data it may seem to mainly consist of hands-on activities. Millar et al. (Citation1994), however, see practical work as a knowledge-based, primarily ‘minds-on’ activity where performance quality depends on access to pertinent knowledge. Their PACKS model () describes different types of knowledge that influence the choices students make in various stages of an investigation.
Figure 1. The PACKS model (Millar et al., Citation1994) relates the various phases in inquiry and the types of knowledge affecting the decisions made in these phases.
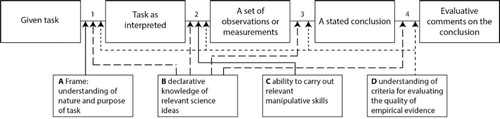
While knowledge of type A mainly influences the initial stages in identifying the inquiry task, type B, understanding of the science relevant to the phenomenon, affects every step in the investigation. Type C includes knowledge involved in using appropriate equipment properly. The focus of this study is on knowledge of type D, understanding the role of experimental data (Gott & Duggan, Citation1996; Millar et al., Citation1994). It includes an understanding of how measurement is subject to error, knowledge involved in reducing measurement uncertainties, and skills in assessing the reliability of data. It is indispensable in assessing the minimum number of measurements needed to establish a relationship, the reliability of data, the (in)significance of differences in measured values, and drawing adequate conclusions (Millar, Citation1997; Millar et al., Citation1994). Millar (Citation1997) therefore recommends practical work in which students themselves are enabled to assess the quality of experimental data and use a scientific approach to do so.
While curriculum documents often specify elements of type D knowledge in isolation, different types of PACKS tend to be applied in an integrated way (Walsh et al., Citation2019). We show below how we minimised interference between the types of knowledge in PACKS sufficiently to enable us to answer the research questions.
Concepts of evidence
Prominent elements in knowledge of type D are the concepts of evidence (CoE), including basic ideas such as repeatability, reproduction, precision and measurement uncertainty that underpin more abstract concepts such as reliability and validity (Gott et al., Citation2003; Gott & Duggan, Citation2007). The CoE guide decisions about how the practical work is set up, which measuring instruments are preferred, what types of patterns are detected, how anomalous data are treated, how a line of best fit is found to illustrate the underlying relationship, and how a defensible conclusion is derived from the available data (Gott & Roberts, Citation2008). Although not all CoE need to be understood in every scientific inquiry, understanding of the CoE supports the gathering of accurate experimental data and subsequently the drawing of acceptable conclusions supported by patterns or trends identified in the dataset.
Expected proficiency levels in data analysis
Over time, students should develop more understanding of evidence and a more sophisticated understanding. So what level of understanding is required of students that have completed compulsory science education, what level of scientific literacy is satisfactory in this regard? We answer this question by constructing, below, an overview of CoE that need to be operationally understood by these students according to an apparent consensus among collected curriculum documents (Department for Education England, Citation2013; Jones et al., Citation2015; Ministry of Education Singapore, Citation2013; Next Generation Science Standards, Citation2013; Ottevanger et al., Citation2014; Spek & Rodenboog, Citation2011; United Kingdom Department for Education, Citation2014). We hold that this overview is feasible and sufficiently detailed for the purpose of this study. The abilities included in this study are printed in italics below and summed up in .
Table 1. Data analysis and interpretation skills for 15-year-olds in selected international curricula assessed in interview (I1–3) and practical (P1–3) probes.
Students aged 15 are expected to be able to spot trends, represent data graphically and use statistical tools according to the OECD (Citation2013, p. 9 & 16). Scientific literacy includes the ability to account for the uncertainty of measurements (OECD, Citation2013, pp. 8 & 16) and to assess whether a claim is supported by data (OECD, Citation2013, pp. 9 & 16). These abilities accord with those specified in NGSS (Citation2013, p. App. 57) for the ages of 12–14 in terms of ‘analysing and interpreting data’ and other curricula, e.g. the Science programmes of study: key stage 4 (United Kingdom Department for Education, Citation2014, pp. 5–6).
Dutch curriculum documents (Ottevanger et al., Citation2014, pp. 18–20) largely paraphrase documentation from PISA (OECD, Citation2013) and the K-12 science education frameworks (National Research Council, Citation2000). The attainment levels, specifying data analysis abilities expected of 15 year-olds in The Netherlands, therefore align with these in other international curricula. For the Dutch school context, Spek and Rodenboog (Citation2011) specify further requirements. According to these curriculum developers, a student should be able to: (1) process data using a table and graph, (2) draw a straight or curved line through a dataset while excluding erroneous data points, recognizing and estimating measurement errors, (3) use the processed data to formulate one or more conclusions fitting the data, and (4) compare the results and conclusions with an hypothesis. This study explores whether students at age 15 can analyse and interpret experimental data adequately in terms of the aforementioned competences.
In the absence of data from a nationwide exam or other means of testing, and in view of informal but frequent reports of teachers to the contrary, it is worthwhile to explore this baseline. While there is no formal (exam) program that specifies what data analysis competencies Dutch 15-year-olds should master, summarises seven competences as a tentative core derived from the relevant literature. These competences overlap within the relevant curricula. The table comprises the criteria in this study for determining to what extent students have mastered data analysis and to describe the problems they encounter when applying it.
Method
Participants and setting
The study’s setting is a modern, medium-sized school preparing for higher vocational education or university studies. Information provided by the Inspectorate of Education (VO-raad, Citation2018) regarding average final exam scores, number of students repeating years, and percentages of students electing a science stream shows that this school is situated close to or slightly above national averages in terms of participation and performance in science exam subjects. Hence these students can be regarded as representative of their age and ability group.
In terms of demographic characteristics as well, the 51 students (32 boys, 19 girls), with an average age of 15 and comprising two different classes, are not exceptional in that they are in majority autochthonous and generally from affluent families. They have opted for a science-based exam programme with physics as an exam subject, chosen by 30–40% of all students at the school.
A sample size of 51 accords with the average size of samples in qualitative educational studies, 40 (Guetterman, Citation2015). It is both manageable and large enough to observe regularities and patterns as well as exceptional cases.
The lessons were taught by the first author who is the students’ regular physics teacher. As a former trainer in an in-service professional development course focusing on practical work, he is well aware of the challenges. In both action research (Altricher et al., Citation2005; Carr & Kemmis, Citation2003) and educational design research (McKenney & Reeves, Citation2013; Van den Akker et al., Citation2006) teachers who research their own classroom practice are seen as situated close to the research-practice gap (Vanderlinde & Braak, Citation2010) and potentially equipped to close it (Bakx et al., Citation2016). Potential threats to impartiality, objectivity and unconsciously influencing students (Trowler, Citation2011) were minimised by adhering to a pre-established interview protocol and virtually teacher-independent, worksheet-guided practical tasks.
From informal talks with teachers in our professional network, we infer that practical work and learning about inquiry receive above-average attention at this school. The outcomes of the latest European PISA study suggest that our findings may be relevant to various other western European countries (Gurria, Citation2016).
Design
Two complementary approaches are used and triangulated to explore the competences listed in . The first uses interviews to explore what students think and do when asked to interpret data presented in a graph, and are prompted to provide as much information as they can. The second approach is used to study how students perform in a basic inquiry task spontaneously, without assistance. In a qualitative, participatory research design (Bryman, Citation2015) detailed information is obtained about how students analyse and interpret data in three stages.
The first stage consists of three preparatory activities that develop in students the ability to collect sufficient and adequate data, making data pattern recognition possible. In stage 2, over the next three weeks, students are interviewed in pairs outside normal classes. Each interview consists of three probes, I1–3. In stage 3, three practical probes P1–3 are carried out. Each probe addresses several competences, though no single probe addresses them all: see .
Stage 1: preparatory activities
Preparatory activities are used to teach the necessity of repeating measurements, the importance of choosing an optimal data spread and range, and the purpose of averaging measured values. Students explore relationships between (1) body and arm length (Pols et al., Citation2019), (2) mass and period of a pendulum and (3), the distance travelled and number of cups propelled by a rolling marble (Farmer, Citation2012).
Stage 2: interviews
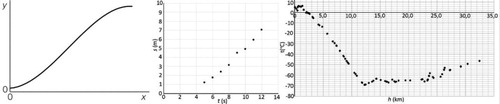
In the interviews, the researcher explains the purpose of the interview to the student pairs, asks for permission to make audio recordings while maintaining confidentiality and anonymity, and states that their answers do not influence their marks. He asks students to tell as much as they can, elaborate on what they think and express what they are looking at. Students then interpret the three graphs in by answering the questions in Appendix. If only one student answers, the other is asked whether (s)he agrees or could add to the given answer. Room is given for discussion when students are not in agreement.
Figure 2. Graphs presented to interviewees in probes I1–3, respectively.
Students are used to doing practical work and to discussing their work, of any kind, in class with the teacher and each other. Although these discussions are normally not performed in interview style or recorded, there is no indication that this affected the validity or reliability of the data, or the content and form of what they brought forward.
Probe I1
As in Boohan (Citation2016b), students describe the graph on the left in to someone who cannot see it. This allows us to determine whether all essential parts of a graph are identified and described (C3, see .)
Probe I2
Presented with the computer-generated data in a table and in the diagram central in , students are asked, first, what the data might represent. This serves to determine whether students can interpret the observed data pattern (C1) in terms of any familiar event or episode in which quantities relate similarly. The graph is then said to represent the position-time graph of a marble, initially at rest, rolling down an incline. Students are invited to describe the pattern (C3), draw the trend line (C2), draw conclusions concerning the motion (C5 and C6), and predict two values (C7). Unless they note it spontaneously they are asked to consider whether the line of best fit includes the origin of the graph. Similarly, they are asked whether some data points require special attention unless they note that the datum at t = 9 s is anomalous. Uniformly accelerated motion from rest is a topic that has been taught in the preceding two years.
Probe I3
Students are asked what the graph on the right of might represent. They are then told that it features temperature measurements of a weather balloon by height. They are asked to identify and draw the trend line (C2), describe the pattern (C3), and explain whether they would provide this same description if they were writing a science report. Asked what conclusions might be drawn from the graph (C5), we expect them to identify two regions, one where the temperature decreases, one where it increases. We do not expect them to identify, as an expert might, the troposphere, tropopause and stratosphere, respectively (Boeker & Van Grondelle, Citation2011).
The next question as to what additional data they would like to obtain to draw firmer conclusions, seeks to probe whether they can identify the limitations of their conclusions (C6). Students are finally asked which of the three probes they rate as the most difficult.
The audio recorded interviews of Probes I1–3 reveal what students are able to say about the issue if probed and encouraged by the interviewer who helps to bridge the ‘knowing-doing gap’ (Pfeffer & Sutton, Citation1999). The approach below is expected to yield less detailed answers, but does show what students do independently in a real class situation and thus has a higher degree of ecological validity (Brewer, Citation2000).
Stage 3: practical tasks
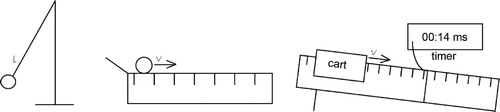
Students, working in pairs or an occasional triplet, carry out the three practical probes P1–3 (see ) guided by worksheet tasks that specify what should be measured. Further worksheet questions include: ‘what is the shape of the graph?’, ‘what is the time required to travel X meters?’, ‘are there any outliers? if so, which?’. The worksheets were handed out at the start of the lessons. The answers to the worksheet questions together with audio recorded answers to teacher questions in P1 are the main data sources. The first two probes are executed in regular physics lessons, the last by appointment with the technical assistant in the prep room, as is usual if only one setup is available.
Figure 3. Practical probes P1–3 on analysis of data and drawing conclusions
Probe P1
After watching a movie scene of Spiderman swinging between tall buildings (Webb, Citation2012), where his motion can clearly be seen and the time for half a period can be measured accurately, student pairs develop a plan to investigate whether this motion is realistic. Their plans are discussed in class to make sure students understand the task and know how to obtain highly accurate data. While data are gathered in pairs they are asked how they will go about establishing a relationship between variables from these. Thus is explored whether their actions are guided by a plan of approach and whether they are aware of appropriate data analysis strategies.
Student pairs then predict the ‘swing time’ of a 5-m long swing by using their measurements (C1, C2 & C7). Their predictions are tested in the next lesson by actual measurement. Using this additional data point, each pair is asked again to predict Spiderman’s swing time if the movie was realistic and thus to answer the research question (C5).
Probe P2
Student pairs establish the relation between the distance travelled and time required (C1 & C2) for a marble rolling on a horizontal track. As time is measured by hand, measurement uncertainty ought to be considered. Student pairs compare their datasets with those of others (C3 & C4), interpolate or extrapolate the travel time for two new distances (C7) and draw a conclusion about the type of motion of the marble (C5 & C6).
Probe P3
Using a cart on a frictionless inclined track, student pairs investigate the relation between travelled distance and time (C2) and compare their datasets with other pairs to investigate the influence of the incline. Measurement uncertainty plays almost no role as an automated, accurate timer is used. Student pairs draw conclusions about the car’s motion (C5 & C6) and predict its travelling times (C7).
Potential interference of other types of knowledge
A student lacking adequate knowledge of PACKS types A–C (of the research question, the situation at hand and the measuring techniques used to study it) may be prevented from succeeding in a probe even if the necessary type D knowledge is present, involving competence in analysing and interpreting the data. To exclude potential interference of this kind we used clear and simple inquiry tasks (A) employing familiar instruments and methods (C) in situations studied previously at a basic level (B). More specifically, probe I1 requires understanding only of the graph itself, how it came about is irrelevant to answering the questions. The situation of uniform motion in I2 ought to be familiar to students as it was taught previously, as will be verified. In I3, students are familiar with weather balloons and temperature measurements. Piloting with similar students shows that no interference is to be expected. In the interview probes, students are invited to ask for clarification of aim, method or phenomenon before being questioned further.
The practical probes are introduced by the teacher or assistant demonstrating the equipment. Student responses are used to verify that students understand the purpose of the tasks, the nature of the situations and are familiar with the equipment, and thus enabled to answer the questions probing knowledge of type D. More specifically, in P1 we verified that students understood and accepted the model for Spiderman’s motion, and that students are familiar with the equipment and measurement techniques (stopwatch, ruler, scales). A detailed knowledge of pendulum physics is not required here. In P2 we verified that all students were able to collect the required data, implying they understood what to do and how to use the instruments (stopwatch, rulers). Since students should be familiar with the kinematics of uniform motion we expect no interference of knowledge type B either. In P3, the teaching assistant helps students with their first measurement to familiarise them with the equipment. Students are expected to perform a simple comparison using the theory of uniform acceleration, taught in the preceding two years.
The interviews and practical probes are carefully monitored for signs of interference from other knowledge types and findings reported accordingly.
Data analysis
Following Schalk et al. (Citation2008) who analysed students’ application of CoE in biology, attainment criteria were specified for each competence and each probe. The three competence attainment levels (novice, intermediate and master) in were defined on the basis of Lachmayer et al. (Citation2007) for C1, (Boohan, Citation2016b) and (Lubben et al., Citation2001) for C2; (Toulmin, Citation2003) and Gott and Duggan (Citation2007) for C6. In all competences, the level ‘novice’ was allocated if none of the other levels applied.
Table 2. Level attainment criteria (where level ‘Novice’ is allocated if neither ‘Master’ nor ‘Intermediate’ apply).
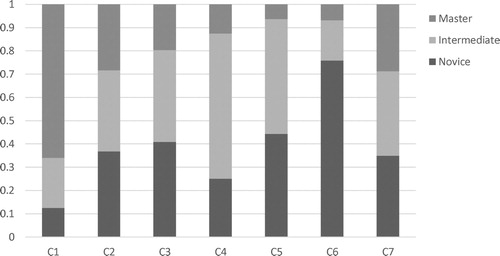
For each probe and each pair, the attained competence level was determined. Since each probe addresses only a subset of competences, the number of relevant probes per competence varies (see ). For each competence and level, the number of probes in which that level is attained was divided by the total number of probes addressing that competence. These fractions are interpreted as the competence levels of the whole sample. E.g. since ‘mastery’ of competence C4 was observed in 32 probes out of 109 probes relevant to C4, we express that level as: Master C4 = 32/109 = .29. While these numbers provide an overall, global description of the attainment levels of the sample, we provide a more detailed, qualitative illustration of each competence using students’ thoughts and actions as expressed in the documents.
The analysis of attainment levels was carried out independently by a second researcher for 20% of the probes, randomly selected from the total sample. No significant differences with the original analysis were found, we regard the initial analysis as valid and reliable.
Results
An overall description of the attainment levels across different competences, constructed as outlined above, is given in . Immediately obvious is that master level is attained across the sample only in competence C1. The figure also shows that these students generally do not make use of argumentation to justify their conclusions (C6). A further, qualitative elaboration of the data per competence is presented below. Labels such as ‘P2-10’ are used to refer to, in this case, the record of student pair 10 performing probe P2.
Figure 4. Attainment levels per student pair in each competence (N = 51).
Exclusion of interference of PACKS types A–C
Since in each of the practical probes P1–3, all responses include an appropriate graph of relevant data and attempts to identify pertinent relationships between one or more salient dependent and independent variables, students’ PACKS of types A–C appears adequate for these tasks. In interview probes I1–3 (see Appendix), questions Q1–4 require answers about the appearance of the graph that do not require PACKS types A–C. Questions Q5–7 require PACKS of types A and B and findings are discussed among the relevant competences, C5–7.
Attainment level of competences
Competence 1: Visualising data
All students construct suitable graphs to visualise the data, including labels, units and suitable scales. displays a typical and correct graph. Aside from some students who do not place the independent variable on the horizontal axis (14%) or do not label the axes at all (12%), most graphs (67%) meet all scientific conventions.
Competence 2: drawing a trend line
Students’ ability to draw a trend line differs substantially across probes, as is illustrated in . Some students simply connect the dots, or disregard measurement uncertainties in some other way (41%). Students often cannot produce a trend line, either because they do not understand the concept or are unable to construct it. If present at all, the concept of a trend line is not expressed with detail or precision, as is illustrated in this dialogue between the researcher (R) and a student (S) during probe P1:
How will you establish the relationship between the variables?
Draw a graph. (R: And then?) Looking whether it is a linear relationship, or another odd one … (R: By?) By looking how the line goes.
And if is not a linear relationship, then?
Then it is a different kind of relationship. Or none at all.
Figure 5. A representative graph from P2 (P2–3) with travelled distance displayed on the x-axis and the measured time on the y-axis. Scientific conventions (C1) are satisfied, the trend line is smooth, partly connecting the data points (C2).
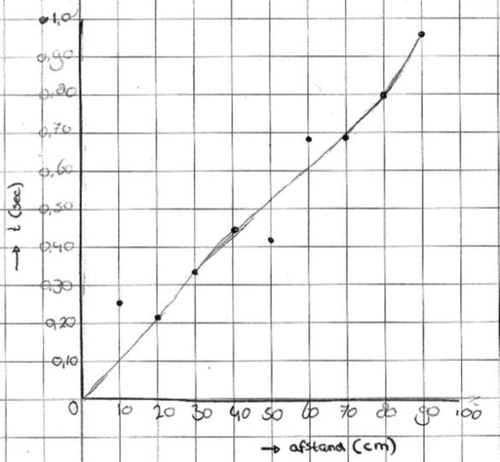
Figure 6. A straight line is drawn in I2, disregarding the identified anomaly at t = 9 s. As the graph displays the motion of a ball, starting from rest, in a travelled distance versus time graph, the origin should be used as well.
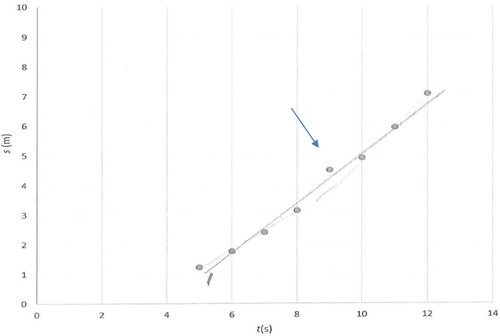
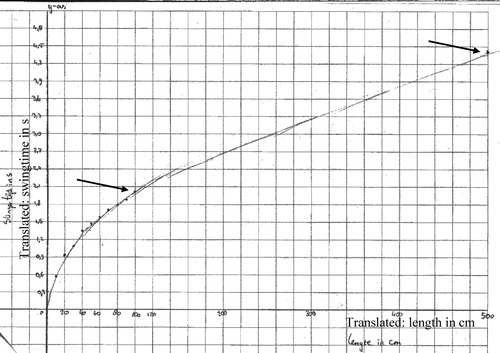
Figure 7. In probe P1, students investigate how the swing time (y-axis) is affected by the length of the swing (x-axis). Some students combine a curved and a straight line to connect the last datum of initial dataset with the additional datum at l = 5,0 m, both indicated with arrows.
In I2, the fact that the movement starts from rest implies that the graph must start horizontally and curve upward. 50% of the students do not provide this interpretation, but rather than failing to interpret the given they appear to ignore it altogether.
Competence 3: describing a dataset
In the interviews, students experience exceptional difficulties in describing a graph verbally. Important features such as, e.g. the process it represents, the value of the y-intercept or the shape are omitted. Most students fail to use (correctly) such scientific terms. The information density of the graph seems to influence the quality of descriptions negatively, as graph I3 tends to be described less elaborately than I1. The students’ struggle is illustrated in the following (I1–25):
How would you describe the graph to someone who does not see the graph?
Upward with curves.
Increasing rise, decreasing decline.
Have you described all essential features?
I expect it to stop at the end.
What do you mean with stop at the end?
That it runs horizontally. [No further details are given.]
On the x-axis is the distance in cm with a 10 cm interval. The time is on the y-axis with a 0.1 s interval. The line is fairly linear. We have also drawn the maximum, minimum and average value.
Competence 4: comparing datasets
Over 60% of students’ answers are categorised as intermediate because they include either a comparison of shape or steepness, but rarely of both. Students compare the datasets merely qualitatively and by sight, superficially. Comparisons are brief and provide little insight into the precise differences and similarities, even if students were specifically asked to do so. The tools for comparing datasets that students ought to have acquired in mathematics are not applied at all. The following are typical examples at intermediate and master level, respectively (P2–8; P3–22):
Same relation. A few deviating points. Our line goes through most points. Theirs through all.
We both have a quadratic relation. Their graph is slightly steeper than ours.
Competence 5: drawing conclusions
Students’ answers reflect an understanding of the situations and the questions asked about it (PACKS types A and B), in accord with prior learning and our expectations. In respect of C5, a conclusion is rated ‘intermediate’ if it answers the research question and accords with the data – an optimally informative answer is not required. The substantial ‘intermediate’ fraction in C5 () therefore includes superficial conclusions such as, e.g.:
as time increases the travelled distance of the marble increases (25% in I2),
the marble accelerates. (50% in I2)
The higher you go, the colder it becomes. The temperature doesn’t fall below -70 above 12 km. At 2000m it drops below 0.
Competence 6: specifying limitations
The first two examples in the above section illustrate that students often do not clearly link the data to their conclusions. The specific evidence supporting a particular claim, or whether that evidence suffices to make the claim acceptable is not provided. There are exceptions to these superficial, unsubstantiated conclusions, but only in P1 where most students conclude that Spiderman’s swing in the film is unrealistic, e.g. (P1–2 & 5):
the swing time is much smaller than we found using the pendulum.
If our calculations are correct and the sling is indeed 50 m long, then the motion of Spiderman in the movie is not possible.
Since students answers to I3-Q5 & 6 reveal an insufficient knowledge of the atmosphere (PACKS type B) to suggest appropriate ways to address the limitations of the given measurements, these data are excluded from further consideration here.
Competence 7: predicting the values of variables
Students are generally aware of extrapolation and interpolation as techniques for estimating values based on measurement and show adequate PACKS types A–B in all probes. In cases where the mathematical relationship between the two physical quantities is directly proportional and the measurement uncertainty small, they apply these techniques correctly. However, if the uncertainty in the measurements is more substantial, students tend to incorrectly connect the data points (C2) and fail to interpolate properly. Some students use a direct proportional relation when they identify it as a linear relation, forgetting to take the y-intercept into account. In P1, half of the students extrapolate values based on a direct proportional relationship though the trend is curved. Two groups correctly predict the ‘swing time’ of a 5 m long swing but fail to explain why their method is justified.
Discussion
Our findings accord with previous studies reporting that students of various ages have difficulties in analysing data (Bailey & Millar, Citation1996; Kanari & Millar, Citation2004; Lubben & Millar, Citation1996; Millar et al., Citation1994). In analysing the data, we confirmed the students’ ability to visualise the data graphically and look for a linear pattern. Although students learned in mathematics how to establish proportional, linear and squared relations and studied various aspects of data analysis, they have no strategy available to analyse the data unless the relationship is directly proportional. The failure to apply in physics what was learned in, e.g. mathematics is known as a transfer problem (Boohan, Citation2016b; Leinhardt et al., Citation1990; Wong, Citation2017). This study extends results reported there about qualitative data analysis to the students’ approach and the difficulties experienced in quantitative data analysis and, below, in drawing conclusions based on empirical data.
Throughout all tasks, students make mistakes and encounter difficulties that prevent a successful data analysis and lead to merely superficial conclusions. Students tend to ignore or be unable to use all relevant information in constructing a graph. They have trouble in describing graphs and are not fully aware of their purposes in science reports. They do not always distinguish linear relationships from other types, but if they do, fail to apply that insight correctly in predicting a value. When analysing the data, they hardly use their existing knowledge of physics or mathematics. As a consequence, their conclusions are often superficial, unsubstantiated and without specification of limitations to their validity or reliability. Out of seven higher-order data analysis competences expected of students at this level, only one, drawing a graph given a quantitative dataset, is attained at an acceptable level in the sample.
The participants in this study enjoyed some of the best compulsory science education available in the Netherlands, belonged to the top 40% of Dutch students in terms of academic ability and had, since they had elected a science-based exam programme, expressed an interest and willingness to learn science. Our results indicate, albeit in a small sample but without any reason to regard these students as special, that in the area of data analysis and interpretation they have not attained scientific literacy as specified by national and international curricula, nor the level assumed at the start of post-compulsory science education. Addressing the problem seems to be relevant.
We tentatively identify four areas of concern in mapping a way forward:
Students rarely attach intrinsic (scientific) relevance or value to the questions or problems we present (Hodson, Citation1990, Citation2014). They are quite willing to please their teacher and do as they are asked but the issues at hand seem rarely to relate to any concern or interest of their own. They are quite satisfied with a common sense or superficial answer to the questions but note that in a report they would embellish their account by using ‘difficult’ words in the expectation of obtaining a higher mark. We should try to engage students in inquiry that they too see as relevant and worthwhile if we expect them to invest in learning how do inquiry well.
As found by others (Abrahams & Millar, Citation2008; Millar et al., Citation1999; Pols, Citation2020), students happily leave judgement on the quality of the answer to the teacher or another external authority. This is arguably not conducive to an approach that takes on the rigour and thoroughness required in scientific inquiry. The Spiderman probe (P1) provides a notable exception: here, some students clearly are personally interested in finding out if movies depict Spiderman’s movements realistically, and eager to carry out additional measurements on their own to obtain more information about what happens if a swing’s length increases from 1 to 5 m. Students engaged in personally relevant and worthwhile inquiry can be expected to become interested in finding useful and trustworthy answers, and stimulated to take responsibility for finding these.
Useful, trustworthy answers are optimally supported by cogent arguments connecting claims to data. Inquiry ought to aim at students constructing these arguments and develop the understanding that a scientific approach is optimally suited to doing so (Gott & Duggan, Citation2007; Hodson, Citation2014; Hofstein & Kind, Citation2012; Woolgar & Latour, Citation1986).
Students need to develop an understanding of what counts as convincing evidence in a scientific argument and develop an understanding of the CoE (Gott & Duggan, Citation1996, Citation2007; Lubben & Millar, Citation1996; Millar, Citation1997; Roberts & Reading, Citation2015; Wellington, Citation2002).
This combination of characteristics is probably necessary, but not necessarily sufficient in constructing a viable pathway of inquiry learning. Our current research is directed at developing and evaluating these ideas in a practical sense (Pols et al., Citation2019). We think we may do so by changing students’ task perception to that of an experienced scientific researcher: find and defend the best possible answer given the circumstances. This study provides both instruments that are useful in establishing what learning takes place, and a starting point for deriving suitable learning activities.
The findings imply students should develop their data-analysis skills before they can be expected to apply these independently. To this end, the probes can be adapted. Probes I1–3 can be carried out using a classroom discussion. As Wellington (Citation2002) suggests: after students elaborate their views, the teacher discusses what features are essential, what patterns can be detected, and if available, how theory of the phenomenon might help in doing the analysis. In this way, ‘the students’ conclusions are valued, discussed and related to the teacher’s hoped-for conclusion’ (Tasker & Freyberg, Citation1985).
Data gathered in the practical probes can be shared on the interactive whiteboard and discussed with a focus on similarities and differences in the datasets. Sharing the measurements reveals spread in measurements, similarities in shape, difference in slope, etc. In this way, the central part of practical work is the discussion and meaning making of the data rather than merely gathering data to confirm a known relationship (Abrahams & Millar, Citation2008; Gunstone & Champagne, Citation1990).
Limitations
Eventually, we will be interested in establishing whether secondary students can develop and apply in an integrated way the full scope of PACKS. This study addresses only a small section of it, referred to as PACKS type D, where potential interference of types A-C was reduced as far as possible. Therefore, while a baseline of this knowledge type is established for a specific age and ability group, a more comprehensive approach will eventually be required. Similarly, we used a small scale, qualitative approach, providing our baseline with depth and detail. While we have argued that the findings have a fair degree of generalisability, a more quantitative and large scale confirmation may be desirable.
Conclusions
This study investigates Dutch students’ ability to analyse and interpret experimental data by constructing adequate data representations and drawing qualified, appropriate, defensible conclusions from these data. Seven associated competences, distilled from contemporary curricula in the international literature, specify what we can expect in that area of 15-year-olds in a science-based program. The attainment level in these competences is established in a sample of 51 students of two intact science classes using three thinking-aloud and three practical probes. Both approaches show that students encounter many difficulties in analysing and interpreting data. The competence of constructing a graph from given data is the only one that was adequately mastered. We argue that neither the students’ academic level nor the quality of the education they had received can account for these results. There is every reason to expect that these results are relevant in much wider settings than the one studied here. In this particular respect, the outcomes of Dutch compulsory science education fall well short of realising scientific literacy for all. The findings further imply that before students can benefit from more ‘open’ practical work in developing independent scientific research competences, they first or concurrently need support in developing the data analysis and interpretation competences studied here. Before students can be expected to analyse and interpret data without help, they will have to overcome the many problems uncovered or confirmed here.
Acknowledgements
This work is part of a research programme for teachers financed by the Netherlands Organisation for Scientific Research (NWO).
Disclosure statement
No potential conflict of interest was reported by the author(s).
Additional information
Funding
References
- Abrahams, I. (2011). Practical work in secondary science: A minds-on approach. Continuum.
- Abrahams, I., & Millar, R. (2008). Does practical work really work? A study of the effectiveness of practical work as a teaching and learning method in school science. International Journal of Science Education, 30(14), 1945–1969. https://doi.org/10.1080/09500690701749305
- Aikenhead, G. S. (2005). Science-based occupations and the science curriculum: Concepts of evidence. Science Education, 89(2), 242–275. https://doi.org/10.1002/sce.20046
- Allie, S., Buffler, A., Campbell, B., & Lubben, F. (1998). First-year physics students’ perceptions of the quality of experimental measurements. International Journal of Science Education, 20(4), 447–459. https://doi.org/10.1080/0950069980200405
- Altricher, H., Feldman, A., Posch, P., & Somekh, B. (2005). Teachers investigate their work: An introduction to action research across the professions. Routledge.
- Bailey, S., & Millar, R. (1996). From logical reasoning to scientific reasoning: Students’ interpretation of data from science investigations. Science Education Research Paper, 96, 01.
- Bakx, A., Bakker, A., Koopman, M., & Beijaard, D. (2016). Boundary crossing by science teacher researchers in a PhD program. Teaching and Teacher Education, 60, 76–87. https://doi.org/10.1016/j.tate.2016.08.003
- Banchi, H., & Bell, R. (2008). The many levels of inquiry. Science and Children, 46(2), 26. ISSN-0036-8148
- Bell, R. L., Smetana, L., & Binns, I. (2005). Simplifying inquiry instruction. The Science Teacher, 72(7), 30–33.
- Boeker, E., & Van Grondelle, R. (2011). Environmental physics: Sustainable energy and climate change. John Wiley & Sons.
- Boohan, R. (2016a). The language of mathematics in science. School Science Review, 97(360), 15–20.
- Boohan, R. (2016b). The language of mathematics in science: A guide for teachers of 11–16 science. Association for Science Education. www.ase.org.uk/resources/maths-in-science
- Brewer, M. B. (2000). Research design and issues of validity. H. T. Reis & C. M. Judd (Eds.). Cambridge University Press.
- Bryman, A. (2015). Social research methods. Oxford University Press.
- Carr, W., & Kemmis, S. (2003). Becoming critical: Education knowledge and action research. Routledge.
- Department for Education England. (2013). Science programmes of study: key stage 3. National curriculum in England. https://assets.publishing.service.gov.uk/government/uploads/system/uploads/attachment_data/file/335174/SECONDARY_national_curriculum_-_Science_220714.pdf
- Dillon, J. (2008). A review of the research on practical work in school science (pp. 1–9). King’s College.
- DUO (Ministry of Education, Cultural Affairs and Science (OCW)). (2017). Programs in secondary education.
- European Commission. (1995). White paper on education and training. Teaching and learning: Towards the learning society. European Union. https://www.voced.edu.au/content/ngv:23953
- Farmer, S. (2012). Real graphs from real data: Experiencing the concepts of measurement and uncertainty. School Science Review, 346, 81–84.
- Gott, R., & Duggan, S. (1995). Investigative work in the science curriculum. Developing science and technology education. Open University Press.
- Gott, R., & Duggan, S. (1996). Practical work: Its role in the understanding of evidence in science. International Journal of Science Education, 18(7), 791–806. https://doi.org/10.1080/0950069960180705
- Gott, R., & Duggan, S. (2007). A framework for practical work in science and scientific literacy through argumentation. Research in Science & Technological Education, 25(3), 271–291. https://doi.org/10.1080/02635140701535000
- Gott, R., Duggan, S., Roberts, R., & Hussain, A. (2003). Research into understanding scientific evidence. http://www.dur.ac.uk/rosalyn.roberts/Evidence/cofev.htm
- Gott, R., & Roberts, R. (2008). Concepts of evidence and their role in open-ended practical investigations and scientific literacy; background to published papers. The School of Education, Durham University.
- Guetterman, T. C. (2015, May). Descriptions of sampling practices within five approaches to qualitative research in education and the health sciences [Paper presentation]. Forum Qualitative Sozialforschung/Forum: Qualitative Social Research, Nebraska.
- Gunstone, R. F., & Champagne, A. B. (1990). Promoting conceptual change in the laboratory. In E. Hegarty Hazel (Ed.), The student laboratory and the science curriculum (pp. 159–182). Routledge.
- Gurria, A. (2016). PISA 2015 results in focus. PISA in Focus, 67, 1. https://doi.org/10.1787/22260919
- Hodson, D. (1990). A critical look at practical work in school science. School Science Review, 70(256), 33–40.
- Hodson, D. (1993). Re-thinking old ways: Towards a more critical approach to practical work in school science. Studies in Science Education, 22, 85–142.
- Hodson, D. (2014). Learning science, learning about science, doing science: Different goals demand different learning methods. International Journal of Science Education, 36(15), 2534–2553. https://doi.org/10.1080/09500693.2014.899722
- Hofstein, A. (2017). Ch26: The role of laboratory in science teaching and learning. In K. S. Taber & B. Akpan (Eds.), Science education (pp. 357–368). Springer.
- Hofstein, A., & Kind, P. M. (2012). Learning in and from science laboratories. In B. Fraser, K. Tobin, & C. J. McRobbie (Eds.), Second international handbook of science education (pp. 189–207). Springer.
- Hofstein, A., & Lunetta, V. N. (2004). The laboratory in science education: Foundations for the twenty-first century. Science Education, 88(1), 28–54. https://doi.org/10.1002/sce.10106
- Holmes, N. G., Olsen, J., Thomas, J. L., & Wieman, C. (2017). Value added or misattributed? A multi-institution study on the educational benefit of labs for reinforcing physics content. Physical Review Physics Education Research, 13(1), 010129. https://doi.org/10.1103/PhysRevPhysEducRes.13.010129
- Holmes, N. G., & Wieman, C. (2018). Introductory physics labs: We can do better. Physics Today, 71, 1–38. https://doi.org/10.1063/PT.3.3816
- Jones, L. R., Wheeler, G., & Centurino, V. A. (2015). TIMSS 2015 science framework (pp. 29–58). TIMMS.
- Kanari, Z., & Millar, R. (2004). Reasoning from data: How students collect and interpret data in science investigations. Journal of Research in Science Teaching, 41(7), 748–769. https://doi.org/10.1002/tea.20020
- Kok, K., Priemer, B., Musold, W., & Masnick, A. (2019). Students’ conclusions from measurement data: The more decimal places, the better? Physical Review Physics Education Research, 15(1). https://doi.org/10.1103/PhysRevPhysEducRes.15.010103
- Lachmayer, S., Nerdel, C., & Prechtl, H. (2007). Modelling of cognitive abilities regarding the handling of graphs in science education. Zeitschrift für Didaktik der Naturwissenschaften, 13, 161–180.
- Leinhardt, G., Zaslavsky, O., & Stein, M. K. (1990). Functions, graphs, and graphing: Tasks, learning, and teaching. Review of Educational Research, 60(1), 1–64. https://doi.org/10.3102/00346543060001001
- Lubben, F., Campbell, B., Buffler, A., & Allie, S. (2001). Point and set reasoning in practical science measurement by entering university freshmen. Science Education, 85(4), 311–327. https://doi.org/10.1002/sce.1012
- Lubben, F., & Millar, R. (1996). Children's ideas about the reliability of experimental data. International Journal of Science Education, 18(8), 955–968. https://doi.org/10.1080/0950069960180807
- Lunetta, V. N., Hofstein, A., & Clough, M. P. (2007). Learning and teaching in the school science laboratory: An analysis of research, theory, and practice. In N. Lederman & S. K. Abell (Eds.), Handbook of research on science education (pp. 393–441). Lawrence Erlbaum Associates.
- McKenney, S., & Reeves, T. C. (2013). Conducting educational design research. Routledge.
- Millar, R. (1997). Student's understanding of the procedures of scientific enquiry. In A. Tiberghien, E. L. Jossem, & J. Barojas (Eds.), Connecting research in physics education with teacher education (pp. 65–70). International Commission on Physics Education.
- Millar, R. (2010). Practical work. In J. Osborne, & J. Dillon (Eds.), Good practice in science teaching: What research has to say: What research has to say (2nd ed., p. 108). Open University Press.
- Millar, R., Le Maréchal, J. F., & Tiberghien, A. (1999). Mapping the domain: Varieties of practical work. In J. Leach & A. Paulsen (Eds.), Practical work in science education – recent research studies (pp. 33–59). Roskilde University Press/Kluwer.
- Millar, R., Lubben, F., Gott, R., & Duggan, S. (1994). Investigating in the school science laboratory: Conceptual and procedural knowledge and their influence on performance. Research Papers in Education, 9(2), 207–248. https://doi.org/10.1080/0267152940090205
- Millar, R., & Osborne, J. (1998). Beyond 2000: Science education for the future. Kings College London.
- Ministry of Education Singapore. (2013). Science syllabus lower and upper secondary. https://www.moe.gov.sg/docs/default-source/document/education/syllabuses/sciences/files/science-lower-upper-secondary-2014.pdf
- Mooldijk, A., & Sonneveld, W. (2010). Coherent education in mathematics and physics: The theme of proportionality in mathematics and physics. Trend in Science and Mathematics Education (TiSME), 43–50.
- National Research Council. (2000). Inquiry and the national science education standards: A guide for teaching and learning. The National Academies Press.
- Next Generation Science Standards. (2013). Next generation science standards: For states, by states. Appendix D: All standards, all students: Making the Next Generation Science Standards accessible to all students.
- OECD. (2013). PISA 2015: Draft science framework. http://www.oecd.org/pisa/pisaproducts/pisa2015draftframeworks.htm
- Ottevanger, W., Oorschot, F., Spek, F., Boerwinkel, D.-J., Eijkelhof, H., De Vries, M. J., van der Hoeven, M., & Kuiper, W. (2014). Kennisbasis natuurwetenschappen en technologie voor de onderbouw vo: Een richtinggevend leerplankader: SLO (nationaal expertisecentrum leerplanontwikkeling).
- Pfeffer, J., & Sutton, R. I. (1999). The knowing-doing gap: How smart companies turn knowledge into action. Harvard business press.
- Pols, C. F. J. (2020). A physics Lab course in times of COVID-19. The Electronic Journal for Research in Science & Mathematics Education, 24(2), 172–178. https://ejrsme.icrsme.com/article/view/20276
- Pols, C. F. J., Dekkers, P. J. J. M., & de Vries, M. J. (2019). Introducing argumentation in inquiry – a combination of five exemplary activities. Physics Education, 54(5), 055014. https://doi.org/10.1088/1361-6552/ab2ae5
- Pospiech, G., Geyer, M., Ceuppens, S., De Cock, M., Deprez, J., Dehaene, W., Michelini, M., & Stefanel, A. (2019). Role of graphs in the mathematization process in physics education [Paper presentation]. GIREP-MPTL, San-Sebastian, Spain, 9–13 July 2018.
- Roberts, R., & Reading, C. (2015). The practical work challenge: Incorporating the explicit teaching of evidence in subject content. School Science Review, 357, 31–39.
- Schalk, H. H., Van der Schee, J. A., & Boersma, K. T. (2008, September). The use of concepts of evidence by students in biology investigations: Development research in pre-university education [Paper presentation]. 7th ERIDOB Conference (pp. 1–12). Utrecht: Utrecht University.
- Schwartz, R. S., Lederman, N. G., & Crawford, B. A. (2004). Developing views of nature of science in an authentic context: An explicit approach to bridging the gap between nature of science and scientific inquiry. Science Education, 88(4), 610–645. https://doi.org/10.1002/sce.10128
- Séré, M. G., Journeaux, R., & Larcher, C. (1993). Learning the statistical analysis of measurement errors. International Journal of Science Education, 15(4), 427–438. https://doi.org/10.1080/0950069930150406
- Spek, W., & Rodenboog, M. (2011). Natuurwetenschappelijke vaardigheden onderbouw havo-vwo: SLO, nationaal expertisecentrum leerplanontwikkeling.
- Stump, E. M., White, C. L., Passante, G., & Holmes, N. (2020). Student reasoning about sources of experimental measurement uncertainty in quantum versus classical mechanics. arXiv preprint arXiv:2007.06675
- Tamir, P. (1991). Practical work in school science: An analysis of current practice. In B. E. Woolnough (Ed.), Practical science (pp. 13–20). Open University press.
- Tasker, R., & Freyberg, P. (1985). Facing the mismatches in the classroom. Learning in Science: The Implications of Children’s Science, 66–80.
- Toulmin, S. E. (2003). The uses of argument. Cambridge University Press.
- Trowler, P. (2011). Researching your own institution: Higher education. British Educational Research Association online resource.
- Tursucu, S. (2019). Successful transfer of algebraic skills from mathematics into physics in senior pre-university education [PhD]. University of Technology Delft. https://repository.tudelft.nl/islandora/object/uuid:80f98acd-dc72-4aa8-bec6-ce72a26c2c65
- United Kingdom Department for Education. (2014). National curriculum in England: Science programmes of study. Crown Publishing.
- Van den Akker, J., Gravemeijer, K., McKenney, S., & Nieveen, N. (2006). Educational design research. Routledge.
- van den Berg, E. (2013). The PCK of Laboratory teaching: Turning Manipulation of equipment into Manipulation of ideas. Scientia in Educatione, 4(2), 74–92.
- Vanderlinde, R., & Braak, J. (2010). The gap between educational research and practice: Views of teachers, school leaders, intermediaries and researchers. British Educational Research Journal, 36(2), 299–316. https://doi.org/10.1080/01411920902919257
- von Kotzebue, L., Gerstl, M., & Nerdel, C. (2015). Common mistakes in the construction of diagrams in biological contexts. Research in Science Education, 45(2), 193–213. https://doi.org/10.1007/s11165-014-9419-9
- VO-raad. (2018). Scholen op de kaart (mapping schools). https://www.scholenopdekaart.nl/
- Walsh, C., Quinn, K. N., Wieman, C., & Holmes, N. (2019). Quantifying critical thinking: Development and validation of the physics lab inventory of critical thinking. Physical Review Physics Education Research, 15(1), 010135. https://doi.org/10.1103/PhysRevPhysEducRes.15.010135
- Webb, M. (Producer). (2012). The Amazing Spider-Man – crane swinging scene [Movie scene]. https://www.youtube.com/watch?v=CoSY8jeLIfw
- Wellington, J. (2002). Practical work in school science: Which way now? Routledge.
- Wieman, C. (2015). Comparative cognitive task analyses of experimental science and instructional laboratory courses. The Physics Teacher, 53(6), 349–351. https://doi.org/10.1119/1.4928349
- Wieman, C. (2016). Introductory labs; what they don't, should, and can teach (and why) [Paper presentation]. APS April Meeting Abstracts, Baltimore, Maryland.
- Wong, V. (2017). Variation in graphing practices between mathematics and science: Implications for science teaching. School Science Review, 98(365), 109–115.
- Wong, V. (2018). The relationship between school science and mathematics education. King's College London.
- Woolgar, S., & Latour, B. (1986). Laboratory life: The construction of scientific facts. Princeton University Press.
- Zion, M., & Mendelovici, R. (2012). Moving from structured to open inquiry: Challenges and limits. Science Education International, 23(4), 383–399.
Appendix
Probe I1:
Q1a: How would you describe the graph to someone who does not see the graph?
Q1b: Have you described all essential features, or would you like to add something?
Probe I2:
Q1: What kind of event can this be a graph of?
Q2a: How would you describe the graph to someone who does not see the graph?
Q2b: Are there any special data points?
Q3a: What would be the line that best fits these measurements? Discuss and subsequently draw that line.
Q3b: Are there other lines that could fit as well?
Q4: Would a line going through the origin fit well with these measurements?
Q5: What conclusion can you draw from this graph about the motion described with this graph?
Q6: After how much time has the ball travelled 4 meters?
Q7: After how much time has the ball travelled 9 meters?
Probe I3:
Q1: What could these measurements be about?
Q2: What would be the line that best fits these measurements? Discuss and subsequently draw that line.
Q3: How would you describe the graph to someone who does not see the graph?
Q4a: Is the description you just gave the same as you would write in a report?
Q4b: Why (not)? What else would you include? Why?
Q5: Using these measurements, what could a conclusion be about?
Q6: What additional information would you like to receive in order to draw a more reliable conclusion?
Q7: What was the most difficult part of the interview?