?Mathematical formulae have been encoded as MathML and are displayed in this HTML version using MathJax in order to improve their display. Uncheck the box to turn MathJax off. This feature requires Javascript. Click on a formula to zoom.
ABSTRACT
Student problems (preconceptions, errors, and learner-specific approaches) that arise when planning and conducting experiments are relevant for lesson planning and the further development of teaching practice overall. student problems are understood as a learning opportunity. So far, little attention has been paid to the relationships between different student problems when planning and conducting an experiment. A search of relevant literature revealed no work addressing this issue. So, this study investigates whether any relationships exist between various student problems. 53 students (age: 10–16) were filmed while planning and conducting experiments themselves (students worked individually, not in groups). The films were translated into observation protocols and analysed according to Mayring’s qualitative content analysis technique. Students were given two tasks to solve using experiments: one on yeast and another on cone scales. The student problems identified were analysed using hierarchical cluster analysis to search for relationships. In the analyses of both tasks, only one, near-identical cluster was found. The cluster includes the student problem variables: ‘hypothesis consists of a combination of variables’, ‘hypothesis is changed during the experiment without being checked’, ‘missing test trial’, ‘missing control trial’, and ‘experimental trials are altered’. No other student problems showed any relationship to each other.
KEYWORDS:
1. Introduction
Many twenty-first-century challenges will require solutions based on scientific thinking and scientific discovery. Therefore, scientific literacy is a key competence for studentsFootnote1 (OECD, Citation2017). At the same time, it serves as a comprehensive term for, among others, referring to declarative knowledge of scientific inquiry methods (i.e. manual and technological aspects), to procedural knowledge of these methods (i.e. how a method is employed in investigating a scientific question), and to epistemic knowledge (knowledge about the nature of science) (e.g. OECD, Citation2017; Van Uum et al., Citation2016; Hodson, Citation2014; Bybee, Citation1997). Worldwide reforms in science education aimed at improving scientific literacy have prioritised investigative approaches, such as inquiry-based education (Capps et al., Citation2016). This practice can be defined as a discovery process, in which the learner plans and conducts inquiry (Pedaste et al., Citation2015). Inquiry-based education guidance is seen as helpful (e.g. Bell et al., Citation2005), as inquiry combined with teacher guidance is associated with a better learning outcome (Aditomo & Klieme, Citation2020). On the other hand, forms of inquiry-based education that are too wide and too quickly opened are ineffective (Kirschner et al., Citation2006; Klahr & Nigam, Citation2004; Sweller et al., Citation2007). Applying guiding inquiry scaffolds can therefore be useful (Van Uum et al., Citation2016). A scaffold is a temporary support that is no longer used when students are competent enough (Lajoie, Citation2005). To implement scaffolding, an assessment of students’ competence is important (Van Uum et al., Citation2016). There are two types of student assessment: summative and formative. Summative assessment takes place at the end of a learning process to capture the outcome. Formative assessment is the assessment of learning (Nieminen et al., Citation2021) and occurs during the learning process to support students (by giving feedback, adapting the learning process, etc.). As an example, one form of formative assessment is on-the-fly assessment, where a teacher collects information by holding a discussion with students about what the latter have learned and by asking questions (Nieminen et al., Citation2021). The information collected in this way could be, among other things, students’ preconceptions, students’ errors in the inquiry process, or learner-specific approaches in planning and conducting an investigation. Learner-specific approaches are actions in the inquiry process that are not false from a scientific point of view, but which do not lead students towards a solution in the scientific problem-solving process. Therefore, they are not errors, but could make it difficult or even impossible for students to obtain a result. For example, students tend to investigate combinations of variables, which often leads to an overload when drawing conclusions (Glaser et al., Citation1992). Jong et al. (Citation1998) used the term ‘problems’ when they searched for and identified barriers that students may encounter in discovery learning. The problems found by de Jong and van Joolingen are varied. Some are based on preconceptions (‘students come to science classes with pre-instructional conceptions […] that are not in harmony with science views’ Duit et al., Citation2013, p. 417). Others arise because the learner does not already have a concept; still others are based on learner-specific approaches. These barriers lead to non-results or non-evident results in the discovery process. In this work, the term ‘problem’ is used in the sense employed by de Jong and van Joolingen, with the only difference being that here we call them ‘student problems’. Knowledge about students’ problems could be very helpful for formative and also for summative assessments, because it gives a teacher indicators to look for when analysing the assessed inquiry activity (Baur, Citation2015). So, knowledge about student problems is beneficial for lesson planning (Schumacher, Citation2008), planning of tailored training, or coaching. Student problems can be used to develop scaffolds, according to this author’s opinion. The temporary help and support (scaffold) can be created or chosen to educate students about common or individual problems. Student problems should therefore not be seen as a learning deficit, but instead as a learning opportunity (Metcalfe, Citation2017; Schumacher, Citation2008). In this research, student problems are seen as a learning opportunity. Even though the emphasis here is on student problems, this should not be understood as a competing paradigm to competency-oriented education.
Experimentation is one aspect of inquiry, and student problems in planning and conducting experiments will be the central point of this article. This choice of emphasis is not a value judgement on other aspects of inquiry but is necessary for a differentiated analysis.
2. Student problems in planning and conducting experiments
A vast body of research exists on student problems (preconceptions, errors, and learner-specific approaches) in experimentation, including in psychology and different domains of science education (biology education, chemistry education, and physics education). These identified problems also occur in adults, not only in students. Because the focus of this article is on student problems, other problems of adult learning are not included.
Problems that were encountered in literature are presented below in a structured manner according to the phases of experimentation: ‘state a hypothesis’, ‘design and conduct an experiment’, and ‘observe and analyse data’ (see e.g. Pedaste et al., Citation2015; Mayer, Citation2007). The questioning phase is neglected because it will not be part of the study described below.
State a hypothesis: students often do not formulate hypotheses when experimenting (Zhai et al., Citation2014; Millar & Lubben, Citation1996; Dunbar & Klahr, Citation1989), some students formulate hypotheses during or at the end of the experiment (Baur, Citation2018), and students sometimes change their original hypotheses during the experiment (Baur, Citation2018). A specific approach by some students is to formulate hypotheses that include a combination of variables (Baur, Citation2018), which requires a multivariate experimental setting. Overall, there is a tendency for students to use too many variables, making it difficult for them to draw a conclusion (Glaser et al., Citation1992). Many students consider the goal of an experiment to be achieving an effect (Hammann et al., Citation2006; Schauble et al., Citation1991).
Design and conduct an experiment: Regularly, more than one trial (set-up) is included in an experiment, at a minimum a control and test trial are necessary. However, several students plan experiments that include only one trial and therefore do not allow comparison of the independent variable’s influence (Hammann et al., Citation2008; Hammann et al., Citation2006). While some students do not use a control trial (Germann et al., Citation1996) – a control trial does not include a variable modification – others do not modify the suspected variable (independent variable) (Chen & Klahr, Citation1999). Some students forget to add a crucial variable in experimental trials (e.g. yeast itself in yeast fermentation experiments) (Baur, Citation2018). In planning and conducting experiments, variable control is often not considered by students (Siler & Klahr, Citation2012; Hammann et al., Citation2006; Kuhn & Dean, Citation2005; Schauble et al., Citation1991). Often, students simply try things out and do not work according to a strictly scientific approach (Meier & Mayer, Citation2012; Wahser & Sumfleth, Citation2008; Hammann et al., Citation2008).
Observe and analyse data: Some students suspect an error in their experiment’s performance (whether related to equipment, measurement, or manipulation) if the data they determine do not match their expectations (Ludwig et al., Citation2021; Wahser & Sumfleth, Citation2008; Chinn & Brewer, Citation1998; Carey et al., Citation1989). Often, students ignore data that does not fit their imagination (Chinn & Brewer, Citation1993; Schauble et al., Citation1991; Watson & Konicek, Citation1990; Kuhn, Citation1989; Gauld, Citation1986). Last, some students mix up an experiment’s result (observation, measurement) and conclusion (Boaventura et al., Citation2013).
Although there has been a lot of research, none of it nor the reviews (namely, the reviews by Jong et al., Citation1998; and Zimmerman, Citation2007) dealing with student problems in experimentation have either reported or analysed relationships between the identified problems of students in planning and conducting experiments. Knowledge of the relationships between the various identified student problems in planning and conducting experiments could be crucial for the development of teaching and learning material, scaffolding, and assessment tools. If student problems are related to one another, several questions arise:
How should teaching and learning material that concerns planning and conducting exercises and experimentation be configured?
Should inquiry competence training be carried out considering all related student problems together or taking each problem separately?
How must related problems be treated in scaffold building? Is higher-level guidance through scaffolding more effective considering all related student problems?
Should teachers look at all related student problems, or is looking at only some of them sufficient for assessment?
The relationships between these problems and their use for educational purposes could be helpful to enhance students’ scientific literacy and motivation for science.
3. Article objective and research question
This article’s objective is to analyse whether a given student problem in experimentation is related to other student problems (be that to one or to several). The meaning of ‘related’ here is illustrated by the following example: Imagine two fictitious problems (Problem A and Problem B). Problem A and B are said to be ‘related’ if the occurrence of Problem A in a student’s work suggests that Problem B also occurs in the same student’s work and vice versa. Here, the term ‘related’ is used because it enables one not only to look at the degree of linear connectivity (correlation) but also to the similarity or dissimilarity (see more about similarities/dissimilarities in section 4.3). In the existing literature, no study was found that analysed relationships between student problems while planning and conducting experiments explicitly. So, there seems to be a research desideratum. However, knowledge of relationships could be, as shown above, crucial for school practice and further science education research. Therefore, the research question of the presented study is:
What, if any, relationships exist between various student problems in planning and conducting experiments?
4. Method
4.1 Sample
The data were collected from n = 53 students:
6 students were in 5th grade,
12 students were in 6th grade,
12 students were in 7th grade,
11 students were in 8th grade,
12 students were in 9th grade.
The arithmetic mean of the students’ ages was M = 13.20 (range: 10–16 years; SD = 1.51). All students attended secondary schools in Germany (federal state Baden-Württemberg).
The sample consisted of 27 boys and 26 girls. The decision to include older and younger students was made to enable statements about a broader age group and not only for a small age group. However, using a broader age group implies the risk of age acting as a confounding variable. To control for this, possible differences were investigated on a sub-sample (5th-, 6th-, and 9th-graders; nsub-sample = 30; using Fisher’s exact test). The comparison of the age groups revealed significant differences only in two student problems in the phase ‘state a hypothesis’, but each difference was only measurable in one of two investigated experimental task contents (student problem H1 in yeast content and H2 in cone scale content: for explanation of these problems see Appendix 2A and for the tasks see Appendices 1A and 1B). Both occurred more frequently among older students (Baur, Citation2021). In all the other student problems, there were no significant differences. In addition, in a cluster analysis, each element xi of a given vector (x1, x2, … , x3) was compared with the corresponding element yi of the other vectors. These are comparisons of the elements belonging to a person (see for further explanations). Therefore, age effects could be seen as only a minor limitation.
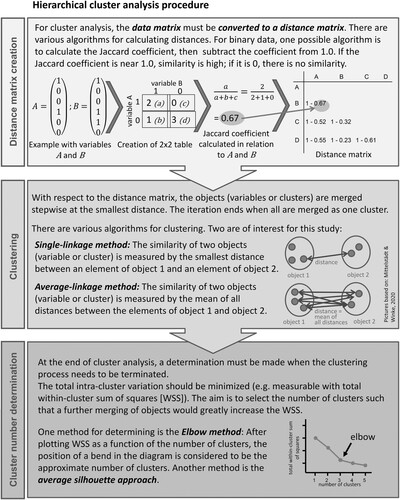
Figure 1. Hierarchical cluster analysis procedure.
The students took part in the investigation voluntarily. School teachers asked students who corresponded to defined achievement levels to participate. The reason for including students of different achievement levels was to create a heterogeneous sample. The levels were based on three categories of achievement levels: good school performance, average school performance, and poor school performance. To classify the students, their school grades were used (grades in mathematics, German, and natural science subjects (NWA)):
Achievement level 1: Mathematics: very good or good; German: at least good to satisfactory; NWA: very good or good,
Achievement level 2: Mathematics: satisfactory; German: at least satisfactory; NWA: satisfactory,
Achievement level 3: Mathematics: sufficient or worse; German: satisfactory or worse; NWA: sufficient or worse.
For each of the three categories, the subsamples consisted of an equal number of boys and girls. Using school grades did not put an excessive workload on the schools. The use of competence tests involves a lot of testing time, which is not often available from schools. The investigation was conducted with the students’ parents’ consent.
4.2 Data recording
The students were filmed while they worked on solving the experimental tasks. In addition, the students were instructed to report on their planning, implementation, and results in the form of a written experimentation report. Each student was given two tasks (see also Appendices 1A and 1B). Two tasks were used rather than one because it is known that experimental content affects the student problems that arise (Ruiz-Primo & Shavelson, Citation1996). With two tasks, this influence was to be minimised, and the focus on student problems expanded. For each task, they had to plan the experiment set-ups, conduct the planned experiment, and interpret the resultant data. The first task was: ‘Find out what yeast needs to produce carbon dioxide’ (‘task 1’/the ‘yeast experiment’); the second task was: ‘Find out what triggers cone scales to close’ (‘task 2’/the ‘cone scale experiment’). These two experimental tasks were selected because both are close to the lives of students, the prerequisite knowledge needed to handle the tasks is fast explained, in both tasks there are many possibilities to plan experiments, and the number of independent variables offered through the triggers is nearly equal (see Appendices 1A and 1B). The number of independent variables is four in the yeast experiment and three in the cone scale experiment. To plan and implement each experiment, the students were offered a range of materials. The material collection for the yeast experiment consisted of Erlenmeyer flasks, beakers, test tubes, stoppers, balloons, a test tube rack, a precision scale, a spatula, a stirring rod, paper towels, flour, salt, cold and warm water, and yeast. The trigger for the experimental process was the presentation of a short film. In the film, the students saw a closed can in which pizza dough expanded. After a short time, students saw the lid of the can blowing off. After the film was shown, students were given the explanation that carbon dioxide is produced by yeast during fermentation. Then, the task 1 instructions were communicated. The ingredients for pizza dough were listed in a joint conversation before the film was shown. For the cone scale experiment, the following material collection was provided: dried conifer cones, beakers, cardboard, paper towels, a thermometer, a hairdryer, a cooler bag, ice cubes, and water. As with task 1, in task 2 an introduction was used to lead into the task. Two pictures were put to use as a trigger. In the first picture, a conifer cone with opened scales was visible. In the second picture, the cone scales were closed. The second picture also showed that it had started raining and that it was becoming darker and colder outside (on each picture, a thermometer was visible). After the differences between the pictures had been discussed with the students, the task 2 instructions were communicated. The participating students had 60 min for each task. The student experiments took place outside the regular classroom. Three at a time, the students went to a dedicated room in the school (they either left their classrooms during their regular lessons or went there afterwards) to perform the experiments. Within the room, each student worked individually under supervision by an assistant, in a space arranged so they could not perceive what the other students in their set of three were doing. The assistants were student teachers from the University of Education Schwäbisch Gmünd and the University of Education Heidelberg. The assistants were trained in advance and were tasked with the following during the investigation:
check whether students understood the task properly and provide explanations if needed,
explain how to complete the experimentation report when experimenting,
remind students to continue filling in the experimentation report,
cue students’ out-loud thinking.
The student teacher assistants did not help the students to carry out the experiments.
4.3 Data analysis
Each video was transferred by transcription to an observation protocol (by integrating the audio and video tracks). In total, 103 videos were transferred to observation protocols (103 × 60 min = 6180 min). The number of 103 videos results from two students taking part in only one experiment and a faulty audio track in one recording. The software ELAN (version 5.2) was used for transcriptions. The information from the students’ experimentation reports was also included in the observation. To reduce the amount of text without reducing the content in each observation protocol qualitative content analysis following Mayring (Citation2008) was applied. According to Mayring’s content analysis, the steps ‘paraphrasing’ and ‘generalising’ are carried out to reduce text:
‘paraphrasing’: Leave out all text parts that do not carry content and simplify them to a reduced mode of expression.
‘generalising’: Generalise observations to a wider level of abstraction. (Mayring, Citation2008, p. 62)
To ensure quality criteria, the objectivity was tested using the interrater method. Therefore, a second rater (interrater) again analysed 25% of the sample. The observation protocols used for the interrater method were randomly selected. However, it was noted that an equivalent number of observation protocols from both sets of content (the yeast experiment and the cone scale experiment) were included. To interpret the interrating, Cohen’s kappa (κ) and the percentage match (PM) were calculated (interrater values are listed in Appendices 3A and 3B). κ could not be calculated in all cases. In some instances, this was down to dividing by zeroFootnote2 or the fact that one of the variables was constant,Footnote3 making the calculation impossible. Here only the PM was used as a characteristic.
The ‘code-recorder method’ was used to reliably analyse the sample (the data were re-analysed after two to three months, cf. Krefting, Citation1991), while the ‘interrating method’ was used to calculate values for reliability control (the ‘interrating method’ was used as a measure of reliability and objectivity). Only four variables had a κ < .60 (see also Appendices 3A and 3B). Variables A3 in the yeast experiment, A3 in the cone scale experiment, and variable A2 in the cone scale experiment were therefore removed from the data set. The variable H1 in the yeast experiment had a value of κ = .57, which is between moderately reliable and reliable and therefore still acceptable (see Greve & Wentura, Citation1997).
As mentioned above, two students took part in only one experiment, one only in the yeast experiment and the other only in the cone scale experiment. In one video, the audio track was faulty (yeast experiment). In five cases, the assistant helped the student to perform the experiment, so the corresponding data were not used (two videos in the yeast experiment and three videos in the cone scale experiment).
A hierarchical cluster analysis (grouping of variables) was carried out to answer the research question. The deductive identification of student problems’ occurrence or non-occurrence led to binary variables (see an overview of the variables and results of occurrence in Appendices 3A and 3B). Each variable forms a vector identifying whether a given student problem was made by student 1, student 2, … , student 53. For each student problem, there was a separate variable for the yeast experiment and the cone scale experiment. Therefore, two cluster analyses were carried out (one for the yeast experiment and one for the cone scale experiment). With cluster analysis it is possible to cluster cases (individuals) or variables (Leonhart, Citation2004; Rousseeuw, Citation1987). If variables are clustered, then the cluster analysis is like a factor analysis. In this work, cluster analysis was used to cluster variables. The cluster analysis was preferred to a factor analysis because for a factor analysis, the sample size should be at least three times the number of variables; if this is not the case, then a cluster analysis must be used (Leonhart, Citation2004). This decision also leads to the use of a similarity/dissimilarity algorithm (with values e.g. between 0 and 1, see ) instead of correlation (with values between −1 and 1). A correlation or a similarity/dissimilarity does not necessarily require causality. For cluster analysis algorithm to calculate the value of similarity/dissimilarity are used algorithm. In the preparation step for each of the two cluster analyses, non-occurring student problems (zero vectors) were excluded from the matrix. In the yeast experiment matrix, the variable D7 as well as the variables H5, D3, D5, D7, and O1 in the cone scale experiment matrix were thus excluded. In the next step, outliers were indicated and excluded. As recommended by Backhaus et al. (Citation2011), outliers were identified with the single-linkage method (see ), then excluded, and in the third step the average-linkage method (see ) was used for the cluster analysis. The variables A1 and O1 were outliers in the yeast experiment, while in the cone scale experiment the variables A4, D4, and D10 were omitted. In the following step, the cluster analyses were performed with the average-linkage method and the appropriate number of clusters was determined using the elbow method (see ). The elbow method (position of a bend in the elbow diagram) is helpful for determining the number of clusters (Backhaus et al., Citation2011). Another method is the average-silhouette approach. With the average-silhouette method, the average silhouette of the dataset (silhouette coefficient of the dataset) for each number of clusters is computed. A silhouette of an object is calculated with respect to distances, with a high value showing a good grouping. The optimal number of clusters is indicated by the maximum silhouette coefficient (Kassambara, Citation2017).
After the identification of clusters, each cluster was analysed with the silhouette average (silhouette coefficient: sc). The silhouette average (sc) of a cluster is useful for interpretation (the strength of the relationship between elements of a cluster) and validation (Rousseeuw, Citation1987). If sc is near 1.0, a structure (relationship between elements) is strong. If it is near zero, there is no structure.
All statistic computing was done with statistics software R (Version 3.6.1).
5. Results
The student problems observed are listed in Figures 3 and 4 and in Appendices 3A and 3B. At this point, it must be mentioned that, in the analysis described, the variable-control strategy was not used as a general separate category. This was done because disregarding the variable-control strategy can sometimes be associated on the one hand with missing test (D1) or control (D2) trials. The trials were evaluated in the described analysis by the researchers according to the hypothesis formulated by the students. If the students also varied other variables in the trials that had not been formulated in the hypothesis, the trials were not evaluated by the researchers as correct test or control trials. On the other hand, disregarding the variable-control strategy can sometimes be associated with the use of different laboratory equipment between the individual experimental trials (D4), with unequal quantities of substances (D5), or with intentional (but illogical) variation of sets (D6). It was not possible to distinguish through observation whether the reason behind the occurrence of one of the above-mentioned student problems was disregard for the variable-control strategy or another reason.
The cluster analysis of the observed student problems and test with elbow criterion for the yeast experiment resulted in three, five, or nine clusters and in two but also possibly five clusters for the cone scale experiment (see A and C). The average-silhouette approach indicates two, three, or five clusters for the yeast experiment – with two clusters seeming best – and two, three, four, five, or ten clusters for the cone scale experiment – with two seeming best again – (see B and D). Considering both criteria (elbow and average silhouette), for the yeast experiment the three- or five- and for the cone scale experiment the two- or five-cluster solutions seem appropriate (see and ).
Figure 2. Diagrams of elbow method and average-silhouette method.
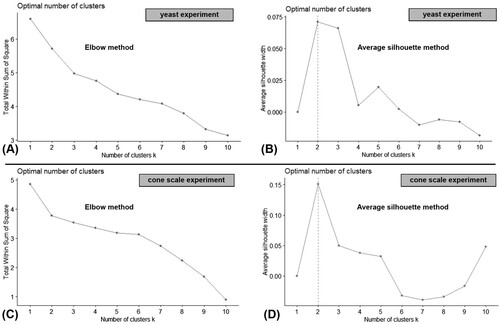
Figure 3. Dendrograms: The letter Z indicates the variables from the cone scale experiment dataset.
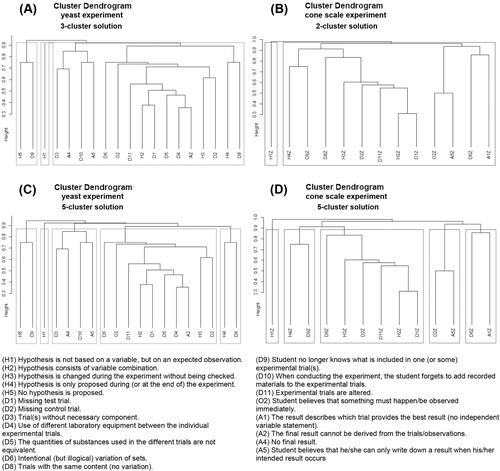
Table 1. Results of cluster number tests.
However, it must be considered that the determination of the optimal number of clusters is a subjective process, despite using determination methods (Kassambara, Citation2017). The number of clusters must also be interpretable for researchers (Mittelstädt & Winke, Citation2020). Homogeneity, on the one hand, and a simple interpretation of the clusters on the other, are crucial for this (Backhaus et al., Citation2011). Accordingly, the following content aspects were considered relevant and used as criteria for selecting the most suitable cluster number from the pool (see ) that the results of cluster number tests provide:
Overall, small clusters are useful because they (1) can provide concrete and not too ‘rough/general’ statements with regard to later analyses of the causes of the relationships and (2) are manageable for attention in the classroom, for instance when offering tailor-made training. In our case, the three-cluster solution for the yeast experiment and the two-cluster solution for the cone scale experiment would each have a cluster that contains almost all student problems remaining in the analysis and therefore did not allow a differentiated and detailed statement about relationships, as was the case with the five-cluster solutions.
Reality must also receive attention when selecting the cluster solution. In the case of the phase ‘state a hypothesis’, only very few students (yeast experiment: 8; cone scale experiment: 2) displayed more than one student problem in this phase (excluding: H3, ‘change of hypotheses’). So, in terms of real content, the grouped student problems fit best in the five-cluster model, in both the yeast experiment and the cone scale experiment.
The comparison between the results of both cluster analyses – meaning the comparisons of the results of the two tasks – is more appropriate if the clusters of the two analyses are similar in size and content. For this aspect, the five-cluster solution of both tasks seems to be best.
Considering the aspects explained here, the five-cluster solution was selected (see C, D and ) because it met all the criteria.
The comparison of the cluster analyses of the two datasets shows that one cluster is similar in both analyses. Cluster 1 is congruent when deleting the variables not included in the cone scale experiment dataset (labelled with a grey box in ) and variables D6 and O2 in the yeast experiment and D8 in the cone scale experiment.
Figure 4. Result of cluster analyses for the yeast experiment and cone scale experiment: grey boxes indicate that these variables were not included in the compared dataset.
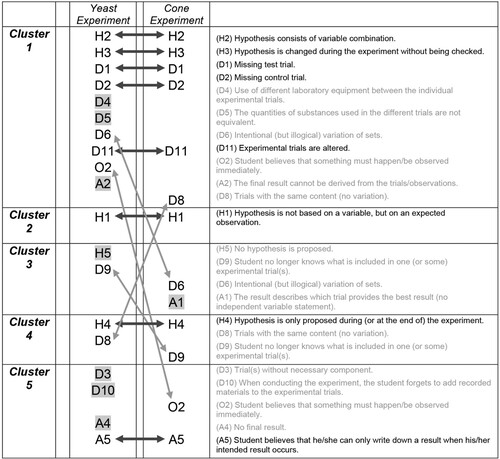
The variables of the congruent cluster are related. The calculation sc of the resulting cluster is sc = 0.25 for the yeast experiment and sc = 0.35 for the cone scale experiment. Both sc scores indicate a relationship (structure) but also show that the included elements of the cluster are not completely separated from other student problems.
6. Discussion
The analysis shows that, of all the problems identified, five student problems are related to each other:
(H2): Hypothesis consists of a combination of variables.
(H3): Hypothesis is changed during the experiment without being checked.
(D1): Missing test trial.
(D2): Missing control trial.
(D11): Experimental trials are altered.
In the results of the two cluster analyses (yeast experiment and cone scale experiment), an effect of the experimental context was observed. In each experimental content, some student problems are also related to the five problems in cluster 1. An influence of the content on the student problems that occur has previously been established (cf. Ruiz-Primo & Shavelson, Citation1996).
The five related student problems occurred frequently (see Appendix 3A and 3B), which should give them particular importance. However, the five student problems’ frequent occurrence is not necessarily the cause of their relatedness. Indeed, student problems that occurred infrequently might be also related to each other. Two examples illustrate this:
Example 1: Two student problems, each displayed only by the same student. When preparing the two student problems as variables (vectors) v1 and v2 for statistical computing: , the Jaccard coefficient of v1 and v2 is
and the distance is 1 - 1 = 0. Both student problems, therefore, are strongly related.
Example 2: Two student problems, where one is displayed by one student and both are displayed by another student: , the Jaccard coefficient is
and the distance is 1 - 0.5 = 0.5. These two student problems show a weak relationship.
It is worth noting that related student problems do not belong in one phase but are cross-phase. There are no phase-specific relationships.
Another important result from this study is that no other student problems were related to one another. For example, it might logically have been the case that student problems H1 (Hypothesis is not based on a variable, but on an expected observation) and A1 (The result describes which trial provides the best result) were related, or H5 (No hypothesis is proposed) and A4 (No final result). Indeed, if someone does not have a hypothesis (H5), they must investigate all combinations, which requires many attempts and a lot of time, and could be an overstrain, leading to no results (A4). However, according to this study’s results, the student problems H1 and A1 are not related, nor are H5 and A4. Here, again, further investigations are needed to check this inductive statement deductively.
In summary, three evident results were found inductively:
The five student problems H2, H3, D1, D2, and D11 are related. The reason for this is that planning and working with more than one independent variable (combination of variables) overwhelms students.
There are no phase-specific relationships.
None of the other student problems are related to one another.
When interpreting these results, the following limitations must be considered. The sc = 0.25 for the yeast experiment is near but not over the benchmark (sc > 0.25). In the cone scale experiment the sc is 0.35. Both values show that there is a (weak) cluster structure. Values between 0.25 and 0.50 demonstrate a little structure and, therefore, that elements included in the cluster are not completely separated from other student problems. When evaluating the results, possible effects of communication between student teacher assistants and students must also be considered as a limitation. Despite a control of communication, students can be prompted to think when student teacher assistants ask them questions about the students’ actions and thoughts. Also, the text of the experimental tasks may have influenced the work of some students. Furthermore, one must bear in mind that H2 was more frequently observed in the experimental work of older students in the cone scale experiment. But in both cluster analyses, H2 is related with the other four student problems and, therefore, age seems not to be a limitation in interpreting the five student problems as being related. Another limitation of this study is that it looks only at the perspective of ‘observable student problems (observable errors, preconceptions, and learner-specific approaches)’. Incorporating students’ perspectives on why they conduct their experiments in the observed way seems fruitful in analysing the reasons why a particular student problem occurs. This analysis would have to be carried out in the form of follow-up interviews. Simultaneously observing a student in the experimenting activity and taking breaks in the experimentation process for questioning a student is not possible because the student’s experimentation activity would be disrupted, and it cannot be ensured whether the activities are still authentic or whether the activities are manipulated by the (why-)questions of the interview. However, in this author’s opinion, knowledge of student problems – which student problems arise, and which are related – is necessary for the development of such an interview guide. Therefore, the student perspective can only be included in another study, in which students first plan and carry out experiments and are then – after the whole experimentation action – asked about the reasons for their observed approach.
The results of the study described here have consequences for formative assessment and teaching. Namely, if one of the five student problems is apparent in a student’s inquiry activity, it is likely that some of the other four are also present. Further, the five student problems identified as being related here could be used as indicators for assessment, for example, in on–the-fly assessment. If a teacher notices one of the five, they can offer support (a scaffold, an explanation, etc.) for all five. The occurrence of all other student problems must be assessed individually. Because of the frequent occurrence of the five student problems, more explanations and training addressing them could be helpful to foster students’ experimental competence. Another research question that is apparent and should be investigated in further research is whether it is sufficient to focus on only one or a selection of the five student problems in teaching to remedy all five problems simultaneously. This question targets the investigation of causalities between the five student problems. If there are causalities, these could be used for teaching and learning activities. Other, further implications for science education research could be seen in the development of differentiation and scaffolding materials and approaches to improve inquiry competence and in intervention studies. Interventions to foster inquiry competence may be more effective when the five student problems are targeted. For the development of differentiation and scaffolding materials and approaches (worksheets or training), it could be beneficial if the materials and approaches are addressed to the five and the other, individual student problems and combined with formative assessment of student problems.
As mentioned above, further research is also necessary to explain in more detail why the five student problems are related to each other while the others are not.
At this point it is important to point out that although the five related student problems are discussed here prominently, all other observed student problems are also of great relevance for teaching, assessment, and scaffolding.
Compliance with ethical standards
Conflict of interest: The author declares that there are no conflicts of interest.
Ethical and consent statements
All procedures performed with human participants were in accordance with the ethical standards of the German Society of Psychology (DGPs) and the rules for surveys at schools in Baden-Württemberg (rules of the Baden-Württemberg Ministry of Education).
Acknowledgements
The author would like to thank Kathrin Beißwenger, Anett Staffen, Sabine Schubert, Jan Fleisch, Alexandra Würtz, Linda Kuhl, Benjamin Raich, Andrea Kautz, and Gerlinde Stör for their help in organising and coordinating the study implementation in the schools; the school managements of the Realschule Heubach, Internationale Gesamtschule Heidelberg, Realschule in der Glemsaue Ditzingen, Sechta-Ries-Schule Unterschneidheim, and the Hochbergschule Plüderhausen; the student assistants Pia Lena Baier, Aileen-Monique Schmidt, Stephanie Barth, Juliane Purr, Saskia Nerpel, Jan Rehberger, Christopher Doster, Yvonne Hattendorf, Priska Strohauer, Larissa Korac, and Jonas Mockler, as well as Arne Bewersdorff and Benjamin Schmidt for their work as interraters and Alexander Brown for editing the English manuscript.
Many thanks are also due to the students who took part in the study.
Disclosure statement
No potential conflict of interest was reported by the author(s).
Additional information
Funding
Notes
1 This article focuses on school students (as opposed to e.g., university students), so the word ‘students’ refers to school students throughout.
2 If a student problem in the entire sample is assessed as having occurred or not occurred by both raters, κ cannot be calculated. Thus, a zero is generated under the fraction bar of the calculation.
3 If a student problem is assessed as having occurred or not occurred by only one of the interraters in the entire sample, κ automatically becomes zero, even though the consensus of both raters might be prominent.
References
- Aditomo, A., & Klieme, E. (2020). Forms of inquiry-based science instruction and their relations with learning outcomes: evidence from high and low-performing education systems. International Journal of Science Education, 42(4), 504–525. https://doi.org/10.1080/09500693.2020.1716093
- Backhaus, K., Erichson, B., Plinke, W., & Weiber, R. (2011). Multivariate Analysemethoden: Eine anwendungsorientierte Einführung [Multivariate analysis methods: An application-oriented introduction]. Springer.
- Baur, A. (2015). Inwieweit eignen sich bisherige Diagnoseverfahren des Bereichs Experimentieren für die Schulpraxis? [To what extent are present diagnosis procedures of the area of experimentation suitable for use in school?]. Biologie Lehren und Lernen – Zeitschrift für Didaktik der Biologie, 19(1), 25–36. https://doi.org/10.2390/zdb-v19-i1-316
- Baur, A. (2016). Problempunkte von Schülerinnen und Schülern bei der experimentellen Methode: Manuelle Fehler, methodische Fehler und Fehlkonzepte [Pupils‘ problems in the application of the experimental method: Manual and metodical mistakes, misconceptions, and pupils’ idiosyncratic approaches]. In U. Gebhard & M. Hammann (Eds.), Lehr- und Lernforschung in der Biologiedidaktik 7 [Research in biology educational science] (pp. 191–205). Innsbruck: Studien Verlag.
- Baur, A. (2018). Fehler, Fehlkonzepte und spezifische Vorgehensweisen von Schülerinnen und Schülern beim Experimentieren: Ergebnisse einer videogestützten Beobachtung [Mistakes, Misconceptions, and Pupils’ Idiosyncratic Approaches to Experimentation: Findings from an Observation]. Zeitschrift für Didaktik der Naturwissenschaften, 24(1), 115–129. https://doi.org/10.1007/s40573-018-0078-7
- Baur, A. (2021). Errors made by 5th-, 6th-, and 9th-graders when planning and performing experiments: Results of video based comparisons. Zeitschrift für Didaktik der Biologie (ZDB) Biologie Lehren und Lernen, 25, 45–63. https://doi.org/10.11576/zdb-3576
- Bell, R. L., Smetana, L., & Binns, I. (2005). Simplifying inquiry instruction. Science Teacher, 72(7), 30–33.
- Boaventura, D., Faria, C., Chagas, I., & Galvão, C. (2013). Promoting science outdoor activities for elementary school children: Contributions from a research laboratory. International Journal of Science Education, 35(5), 796–814. https://doi.org/10.1080/09500693.2011.583292
- Bybee, R. W. (1997). Achieving scientific literacy: From purposes to practices. Heinemann.
- Capps, D. K., Shemwell J. T., & Young A. M. (2016). Over reported and misunderstood? A study of teachers’ reported enactment and knowledge of inquiry-based science teaching. International Journal of Science Education, 38(6), 934–959, https://doi.org/10.1080/09500693.2016.1173261
- Carey, S., Evants, R., Honda, M., Jay, E., & Unger, C. (1989). ‘An experiment is when you try it and see if it works’: a study of grade 7 students’ understanding of the construction of scientific knowledge. International Journal of Science Education, 11(5)(special issue), 514–529. https://doi.org/10.1080/0950069890110504
- Chen, Z., & Klahr, D. (1999). All other things being equal: Acquisition and transfer of the Control of Variables Strategy. Child Development, 70(5), 1098–1120. https://doi.org/10.1111/1467-8624.00081
- Chinn, C. A., & Brewer, W. F. (1993). The role of anomalous data in knowledge acquisition: A theoretical framework and implications for science instruction. Review of Educational Research, 63(1), 1–49. https://doi.org/10.3102/00346543063001001
- Chinn, C. A., & Brewer, W. F. (1998). An empirical test of a taxonomy of responses to anomalous data in science. Journal of Research in Science Teaching, 35(6), 623–654. https://doi.org/10.1002/(SICI)1098-2736(199808)35:6<623::AID-TEA3>3.0.CO;2-O
- Duit, R., Treagust, D. F., & Widodo, A. (2013). Teaching science for conceptual change: Theory and practice. In S. Vosniadou (Ed.), International handbook of research on conceptual change (pp. 487–503). Taylor and Francis.
- Dunbar, K., & Klahr, D. (1989). Developmental differences in scientific discovery processes. In D. Klahr (Ed.), Complex information processing: The impact of Herbert A. Simon (pp. 109–143).
- ELAN (Version 5.2) [Computer software]. (2018). Nijmegen: Max Planck Institute for Psycholinguistics, The Language Archive. https://archive.mpi.nl/tla/elan
- Gauld, C. (1986). Models, meters and memory. Research In Science Education, 16(1), 49–54. https://doi.org/10.1007/BF02356817
- Germann, P. J., Aram, R., & Burke, G. (1996). Identifying patterns and relationships among the responses of seventh-grade students to the science process skill of designing experiments. Journal of Research in Science Teaching, 33(1), 79–99. https://doi.org/10.1002/(SICI)1098-2736(199601)33:1<79::AID-TEA5>3.0.CO;2-M
- Glaser, R., Schauble, L., Raghavan, K., & Zeitz, C. (1992). Scientific reasoning across different domains. In Corte, E. de, Linn, M.C., Mandl, H., & Verschaffel, L. (Ed.), Computer-based learning environments and problem solving (pp. 345–371). Springer.
- Greve, W., & Wentura, D. (1997). Wissenschaftliche beobachtung: Eine einführung [scientific observation: An introduction]. Beltz.
- Hammann, M., Phan, T. T. H., Ehmer, M., & Bayrhuber, H. (2006). Fehlerfrei experimentieren [experiment correctly]. Der Mathematische und Naturwissenschaftliche Unterricht, 59(5), 292–299.
- Hammann, M., Phan, T. T. H., Ehmer, M., & Grimm, T. (2008). Assessing pupils’ skills in experimentation. Journal of Biological Education, 42(2), 66–72. https://doi.org/10.1080/00219266.2008.9656113
- Hodson, D. (2014). Learning science, learning about science, doing science: Different goals demand different learning methods. International Journal of Science Education, 36(15), 2534–2553. https://doi.org/10.1080/09500693.2014.899722
- Jong, D., van Joolingen, T., & R, W. (1998). Scientific discovery learning with computer simulations of conceptual domains. Review of Educational Research, 68(2), 179–201. https://doi.org/10.3102/00346543068002179
- Kassambara, A. (2017). Practical guide to cluster analysis in R: Unsupervised machine learning. Amazon.
- Kirschner, P. A., Sweller, J., & Clark, R. E. (2006). Why minimal guidance during instruction does not work: An analysis of the failure of constructivist, discovery, problem-based, experiential, and inquiry-based teaching. Educational Psychologist, 41(2), 75–86. https://doi.org/10.1207/s15326985ep4102_1
- Klahr, D., & Nigam, M. (2004). The equivalence of learning paths in early science instruction. Psychological Science, 15(10), 661–667. https://doi.org/10.1111/j.0956-7976.2004.00737.x
- Krefting, L. (1991). Rigor in qualitative research: The assessment of trustworthiness. The American Journal of Occupational Therapy, 45(3), 214–222. https://doi.org/10.5014/ajot.45.3.214
- Kuhn, D. (1989). Children and adults as intuitive scientists. Psychological Review, 96(4), 674–689. https://doi.org/10.1037/0033-295X.96.4.674
- Kuhn, D., & Dean, D. (2005). Is developing scientific thinking all about learning to control variables? Psychological Science, 16(11), 866–870. https://doi.org/10.1111/j.1467-9280.2005.01628.x
- Lajoie, S. (2005). Extending the scaffolding metaphor. Instructional Science 33(5-6), 541–557 https://doi.org/10.1007/s11251-005-1279-2
- Leonhart, R. (2004). Lehrbuch statistik: Einstieg und vertiefung [textbook statistics: Entry and deepening]. Huber.
- Ludwig, T., Priemer, B., & Lewalter, D. (2021). Assessing secondary school students’ justifications for supporting or rejecting a scientific hypothesis in the physics lab. Research in Science Education, 51, 819–844. https://doi.org/10.1007/s11165-019-09862-4
- Mayer, J. (2007). Erkenntnisgewinnung als wissenschaftliches Problemlösen [Inquiry as scientific problem-solving]. In D. Krüger, & H. Vogt (Eds.), Theorien in der biologiedidaktischen Forschung (pp. 177–186). Springer.
- Mayring, P. (2008). Qualitative inhaltsanalyse. Grundlagen und Techniken [Qualitative content analysis: Basics and techniques]. Beltz.
- Meier, M., & Mayer, M. (2012). Experimentierkompetenz praktisch erfassen. Entwicklung und Validierung eines anwendungsbezogenen Aufgabendesigns [Diagnosing experimental competence: Development and validation of an application-oriented task design]. In Harms, U., & Bogner, F.X. (Ed.), Lehr- und Lernforschung in der Biologiedidaktik (p. 81-98) [Research in biology educational science]. Studien Verlag.
- Metcalfe, J. (2017). Learning from errors. Annual Review of Psychology, 68(1), 465–489. https://doi.org/10.1146/annurev-psych-010416-044022
- Millar, R., & Lubben, F. (1996). Investigative work in science: The role of prior expectations and evidence in shaping conclusions. Educational Research, 13(3), 28–34.
- Mittelstädt, M., & Winke, J. (2020). Clusteranalyse [Cluster analysis]. Independently.
- Nieminen, P., Hähkiöniemi, M. & Viiri, J. (2021). Forms and functions of on-the-fly formative assessment conversations in physics inquiry lessons. International Journal of Science Education, 43(3), 362–384. https://doi.org/10.1080/09500693.2020.1713417
- Oecd [organisation for econonomic Co-operation and development]. (2017). PISA 2015 assessment and analytical framework. Paris: OECD.
- Pedaste, M., Mäeots, M., Siiman, L. A., de Jong, T., van Riesen, S. A., Kamp, E. T., Manoli, C. C., Zacharia, Z. C., & Tsourlidaki, E. (2015). Phases of inquiry-based learning: Definitions and the inquiry cycle. Educational Research Review, 14, 47–61. https://doi.org/10.1016/j.edurev.2015.02.003
- Rousseeuw, P. J. (1987). Silhouettes: A graphical aid to the interpretation and validation of cluster analysis. Journal of Computational and Applied Mathematics, 20, 53–65. https://doi.org/10.1016/0377-0427(87)90125-7
- Ruiz-Primo, M. A., & Shavelson, R. J. (1996). Rhetoric and reality in science performance assessments: An update. Journal of Research in Science Teaching, 33(10), 1045–1063. https://doi.org/10.1002/(SICI)1098-2736(199612)33:10<1045::AID-TEA1>3.0.CO;2-S
- Schauble, L., Klopfer, L. E., & Raghavan, K. (1991). Students’ transition from an engineering model to a science model of experimentation. Journal of Research in Science Teaching, 28(9), 859–882. https://doi.org/10.1002/tea.3660280910
- Schumacher, R. (2008). Der produktive Umgang mit Fehlern. Fehler als Lerngelegenheit und Orientierungshilfe [The productive use of errors: Errors as learning opportunity and orientation aid]. In Caspary, R. (Ed.), Nur wer Fehler macht, kommt weiter: Wege zu einer neuen Lernkultur [Only those who make errors will get ahead: Ways to new learning culture] (pp. 49–72). Freiburg i. B.: Herder.
- Siler, S. A., & Klahr, D. (2012). Detecting, classifying, and remediating: Children’s explicit and implicit misconceptions about experimental design. In R. W. Proctor, & E. J. Capaldi (Eds.), Psychology of science (pp. 137–180). Oxford University Press.
- Sweller, J., Kirschner, P. A., & Clark, R. E. (2007). Why minimally guided teaching techniques do not work: A reply to commentaries. Educational Psychologist, 42(2), 115–121. https://doi.org/10.1080/00461520701263426
- Van Uum, M. S. J., Verhoeff, R. P., & Peeters, M. (2016). Inquiry-based science education: towards a pedagogical framework for primary school teachers. International Journal of Science Education, 38(3), 450–469. https://doi.org/10.1080/09500693.2016.1147660
- Wahser, I., & Sumfleth, E. (2008). Training experimenteller Arbeitsweisen zur Unterstützung kooperativer Kleingruppenarbeit im Fach Chemie [Training of experimental working to support cooperative small group work in chemistry]. Zeitschrift für Didaktik der Naturwissenschaften, 14, 219–241.
- Watson, B., & Konicek, R. (1990). Teaching for conceptual change: Confronting children's experience. Phi Delta Kappan, 71(9), 680–684.
- Zhai, J., Jocz, J. A., & Tan, A.-L. (2014). ‘Am I Like a Scientist?’: Primary children's images of doing science in school. International Journal of Science Education, 36(4), 553–576. https://doi.org/10.1080/09500693.2013.791958
- Zimmerman, C. (2007). The development of scientific thinking skills in elementary and middle school. Developmental Review, 27(2), 172–223. doi:10.1016/j.dr.2006.12.001
Appendices
1. Task 1 (yeast experiment)
2. Task 2 (cone scale experiment)