
ABSTRACT
In this study, we focused on students' intrinsic motivation towards practical work, more specifically the strength of predictors for intrinsic motivation. As a research tool, we used a modified Intrinsic Motivation Inventory supplemented by additional questions on attitudes towards physics. The respondents were more than 2000 Czech upper secondary students who had visited the Interactive Physics Laboratory (a lab offering hands-on experimenting for school groups). Using structural equation modelling, the data were examined with respect to the gender of the respondents, their intention to study STEM and their diligence in physics. For all three criteria mentioned, the perceived value and usefulness of activity emerge as the strongest predictor of intrinsic motivation, followed by effort invested into experimenting. The issue of effort is more strongly addressed by students who feel less diligent in physics and do not plan to study STEM. Both the students' perceived competence and felt pressure have a rather marginal influence on intrinsic motivation. Though the strength of predictors of intrinsic motivation is gender-similar, we found boys feel more competent and less stressed when experimenting. Further, diligent students and those who intend to study STEM feel more competent, perceive greater usefulness and feel less pressure during practical work.
Introduction
In recent decades, there has been a shift in education from a transmissive to a constructivist model that emphasises learners’ activity, including their own practical work. In this paper, we follow the definition given by Millar (Citation2010), who refers to practical work as ‘any science teaching and learning activity in which the students, working individually or in small groups, observe and/or manipulate the objects or materials they are studying’. Traditionally, practical work has been expected to have many functions – among others, enhancing conceptual learning, stimulating interest, understanding the nature of science or gaining insight into scientific methods and approaches. Further we limit ourselves to the affective aspects of practical work.
Practical work is often used by teachers to present science ‘in a better light’, as an engaging and enjoyable subject (Abrahams, Citation2007). Students really prefer practical work to other forms of instruction (Bennett, Citation2003; Owen et al., Citation2008), though the reasons for this are not crystal clear (Bennett, Citation2003). Some authors point out that practical work allows students to interact with their teacher and classmates in less serious atmosphere and to manage their work at their own pace (Gardner & Gauld, Citation1990). According to Bennett (Citation2003), practical work may serve as an escape from the boring routine of writing, reading, and listening to the teacher. Anyway, for students to enjoy and value practical work, its purpose must be clear (Bennett, Citation2003) and its assignment should provide them with an appropriate challenge as well as some control over what they have to do (Bennett, Citation2003; Hodson, Citation1990).
Studies also confirm the role of practical work as a means of stimulating a short-term interest – more specifically, a triggered situational interest (Hidi & Harackiewicz, Citation2000). Abrahams (Citation2009) proves that practical work produces such non-enduring engagement in students aged 11–16. Higher situational interest and intrinsic motivation generated by practical work were also reported in recent research by Itzek-Greulich and Vollmer (Citation2017) or Erickson et al. (Citation2020).
In this paper, we address situational interest as an important aspect of intrinsic motivation and within the framework of self-determination theory, we are looking for predictors of intrinsic motivation induced by practical work. Unlike most current studies, we attempt to answer the question of how the power of each predictor varies for different groups of students.
The paper is structured into standard main parts. The theoretical framework provides an introduction to key concepts such as intrinsic motivation and situational interest. In the Research context, we introduce four research questions which we return to in the Discussion, where the results are seen from the perspective of previous research and with possible implications for the practice of physics teaching and learning (with a focus on hands-on practical work).
Theoretical framework
Self-determination theory, intrinsic motivation and situational interest
Self-determination theory (SDT) developed by Deci and Ryan (Citation1985) represents a broad metatheory of human motivation and personality development. The theory focuses primarily on three basic psychological needs (Ryan & Deci, Citation2017): autonomy (being the source of one’s own behaviour), competence (feeling effective in one’s ongoing interactions) and relatedness (feeling connected to others). SDT started with a narrow focus on intrinsic motivation (IM) conceptualised as wanting to do an activity for the pure enjoyment of it, but it has quickly grown to include both intrinsic and extrinsic motivation (Ryan & Deci, Citation2019). Among other topics, it also includes a new perspective on well-being, life-goals, relationship quality, etc. (Ryan & Deci, Citation2019). SDT is currently made up of six ‘mini-theories’ of which the Cognitive Evaluation Theory is the one that describes the variations of IM and the factors affecting it.
Intrinsic motivation for an activity is closely related to interest, which is ‘well established as a motivational construct in education’ (Schiefele, Citation2009). One of the main concepts of interest is situational interest, which can be short-term and is characterised by an immediate (mostly positive) affective response to some activity (Renninger & Hidi, Citation2016). Situational interest can lead to IM, which in turn can lead to experiencing situational interest. If this cycle repeats, it is likely that an individual interest will develop, which is a relatively stable predisposition to certain activities that have a close relation to students’ career choices (Schiefele, Citation2009).
In addition to eliciting intrinsic motivation, it is crucial to create conditions for its maintenance. Early studies found that IM is enhanced by a non-controlled (even self-administered) feedback (Ryan, Citation1982), or by the possibility of choice, acknowledgement of feelings and opportunity for self-direction (Deci & Ryan, Citation1985). On the other hand, negative performance feedback, extrinsic rewards, threats, pressured evaluation, etc., lead to undermining IM (Deci & Ryan, Citation1985). Though there are many time-approved studies, the research is ongoing. We now focus on the latest findings.
The application of the principles of SDT in regard to education is considered a possibility of developing IM (Ryan & Deci, Citation2017). According to research (e.g. Baker & Goodboy, Citation2019), autonomy-supportive teachers arouse in their students higher-quality motivation. However, it is not just the need for supportive instruction, which stimulates students’ IM. Shin and Johnson (Citation2021) in their study showed that student-to-student confirmation appears to have a positive indirect effect on students’ IM to learn. Therefore, they suggest to teachers that they provide opportunities for students to interact with each other and confirm one another. It is also important to mention that students will be intrinsically motivated only by activities that have an intrinsic interest for them; that is, have the appeal of novelty, challenge, or aesthetic value. Activities that do not have such an appeal are not covered by the principles of the Cognitive Evaluation Theory (Ryan & Deci, Citation2000).
Intrinsic Motivation Inventory
The Intrinsic Motivation Inventory (IMI; Center of Self-Determination Theory, Citationn.d.) is a multidimensional questionnaire grounded on SDT and designed to measure the participants’ subjective perception of an activity. Although IMI is mainly used in medical and psychiatric research, it has also found application in, e.g. physics education research (Gustafsson, Citation2005; Kácovský & Snětinová, Citation2021).
The questionnaire consists of seven dimensions whose brief description adopted from Monteiro et al. (Citation2015) follows. Interest/enjoyment evaluates interest in and pleasure from an activity. Perceived choice assesses the extent to which individuals feel engaged in an activity because they have chosen it. Perceived competence measures how effective individuals feel in performing a given task. Pressure/tension assesses whether participants experience pressure to succeed in a given activity. Effort/importance reflects how people invest their abilities in what they do. Value/usefulness embodies the idea that people internalise and develop more self-regulatory activities if they perceive the experience as valuable and useful to them. Finally, relatedness concerns interpersonal interactions and refers to a person’s feelings associated with others.
Although the instrument is called Intrinsic Motivation Inventory, only the dimension interest/enjoyment directly measures the IM, while the others are considered its predictors (perceived competence, perceived choice, and pressure/tension) or provide supplemental information (effort/importance, value/usefulness, and relatedness). It is common that only some of the dimensions and some of their items are, according to researchers’ needs, selected when constructing a tool for a particular study.
Research context
Interactive Physics Laboratory
The research was conducted in the Interactive Physics Laboratory (IPL; Department of Physics Education, Citationn.d.) operated by the Faculty of Mathematics and Physics, Charles University. IPL offers upper secondary students a space for conducting experiments in the form of structured inquiry (Banchi & Bell, Citation2008) on a given physics topic (experimental set); the main goal is to allow students to ‘grasp physics with their own hands’. One event in the laboratory lasts 120 min and the students work in groups of three or four. Each of the nine offered experimental sets consists of four to six experimental units composed of a series of consecutive experiments. During their visit, the students typically go through three to four of these units.
Every experimental unit has its own worksheet that guides the students and provides them with space where they can write down their hypotheses, calculations, and results. Students perform the experiments independently, with a maximal autonomy, but have the possibility to consult on all the steps of their inquiry with lecturers, who provide them with support. At the end of the visit to IPL, each group of students briefly presents one of the experimental units (a description of the experiments, major findings and results) to their peers. After the meeting, students take their completed worksheets with them, giving their teachers the opportunity to follow up on the experiments conducted in IPL in their subsequent regular lessons. Due to the limited number of days when the IPL operates it is not possible to fully coordinate the IPL set with the topic currently being discussed in the class. Sometimes the students come to IPL before the topic has been discussed in their classes, sometimes long after the topic has been completed. More information about IPL can be found in Snětinová and Kácovský (Citation2019).
Research goals and questions
Starting from the self-determination theory, we assume students’ scores on the interest/enjoyment dimension as a straightforward measure of intrinsic motivation. The other IMI dimensions, some denoted in SDT as predictive and some as supplementary, we consider as potential intrinsic motivation predictors. The two exceptions are perceived choice and relatedness that we excluded from this study since students have effectively no choice if they want to participate in IPL sessions and their relationships with classmates are beyond our control. Based on this theoretical framework, we stated four research questions to concretise our aims. All of these questions refer to intrinsic motivation for practical work; to preserve clarity and brevity, this important feature is not repeated in each question.
RQ1: How powerful are IMI dimensions effort/importance, perceived competence, pressure/tension and value/usefulness as intrinsic motivation predictors?
RQ2: How do gender differences affect the power of these intrinsic motivation predictors?
RQ3: Is the power of intrinsic motivation predictors influenced by students’ intention to study STEM?
RQ4: Is the power of intrinsic motivation predictors influenced by students’ diligence in physics lessons?
Regarding RQ1, we are not currently aware of any study that directly addresses this. In contrast, gender differences concerning practical work (RQ2) are a common subject of research papers showing that girls are usually more critical towards their own experimenting than boys. The roots of this gap lay in perceiving science, or more precisely physics, as a masculine discipline, which has been proven to be a worldwide belief (Murphy, Citation1993). The children’s view of a typical scientist as a man (Farland-Smith et al., Citation2017) forms at an early age and can lead girls to the subliminal impression that science is not for them. With age, such belief may be reinforced by gender-specific out-of-school activities or family patterns, and its consequences translate into school contexts. Namely for practical work, research showed that girls prefer using household appliances while boys are more familiar with electronic and measurement instruments (Kokott et al., Citation2018; Murphy, Citation1993). Since the latter devices are widely used in physics education, girls may feel a lack of experience compared to boys and doubt their scientific ability.
In RQ3 we focus on students’ intention to study STEM at university, the strengthening of which is a common goal of most science educators today. Finally, students’ diligence addressed in the RQ4 is usually mentioned in the context of academic performance (Arthur et al., Citation2006) and has been identified by Wong et al. (Citation2021) as the most important characteristics of the ideal student. Specifically in physics education, Kácovský and Snětinová (Citation2021) reported that students’ self-reported diligence in physics lessons is a strong predictor of positive perception of lecture demonstrations; the question arises whether the same is true in the case of practical work.
We hope the answers to the research questions will help us as well as other educators to design and organise practical work with a deeper understanding of what predetermines students’ perception of practical work and how it is perceived by different groups of students.
Methodology
The study was conducted using a quantitative research approach, applying a Likert-scale paper-and-pencil questionnaire as a research tool.
Participants
Our research took place between 2017 and 2020. We questioned 178 student groups from 23 upper secondary schools and received 2024 questionnaires filled by 15–20 years old students. The majority of the students were from elective schools that prepare them for university studies (grammar schools). Among the IPL visitors, the proportion of students who attend extra physics seminars in their school is higher than in the random sample of the grammar school population. Similarly, teachers who took their classes to IPL are typically those who are more active within the teaching community.
Data collection: tool and procedure
Research data were collected through a questionnaire (Laboratory Intrinsic Motivation Inventory; LIMI) investigating how students perceive their work in IPL. LIMI has three parts (see Appendix). The first one (LIMI-A) collects basic information about the students – their gender, age, year of study, grade in physics, number of group members in IPL, and intention to study physics and STEM at university. The second part, LIMI-B, focuses on students’ perception of physics as a school subject. It consists of six statements (rated on a five-point scale) addressing on the one hand the popularity of school physics, its difficulty, importance and interestingness, and on the other hand students’ self-reported giftedness and diligence in physics (Pavelková et al., Citation2010).
The third part, LIMI-C, examines the students’ perception of their working in IPL. It is based on IMI from which we have selected five dimensions relevant to our research context – the inherent dimension interest/enjoyment and four dimensions which we assume to be predictive of it, namely effort/importance (4), perceived competence (4), pressure/tension (4) and value/usefulness (7); numbers in brackets indicate the number of items in each dimension. Each item takes the form of a statement and is rated on a seven-point Likert scale. The scale score indicates how true students believe a particular statement is – the score of ‘1’ means very true, the score of ‘4’ somewhat true and the score of ‘7’ not at all true. Dimension scores (i.e. the level of felt interest, felt pressure, etc.) are expressed by averaging the scores of all items in each dimension.
LIMI-A and LIMI-C were piloted on a sample of ca. 170 participants in the spring of 2017. Subsequently, the LIMI-B section was added, and the full questionnaire was piloted in early autumn 2017 with a sample of approximately 130 students. As a result, the Czech translation of LIMI-C items was improved and information on the number of workgroup members was added. The English translation of the administered questionnaire is freely available (Department of Physics Education, Citation2020).
The LIMI questionnaire was administered fully anonymously immediately after the event in IPL. Students did not provide their names and they were instructed that by completing and submitting the paper questionnaire they agreed to data processing. Although no time limit was set for the respondents, they usually completed the questionnaire within five minutes. The data were digitised with FormScanner software for optical mark recognition and then analysed using IBM SPSS Statistics 26, IBM SPSS Amos 26 Graphics and Mplus software.
Data analysis: structural equation modelling
To evaluate our data, we used structural equation modelling (SEM) taking a confirmatory approach to the analysis of a structural theory bearing on some phenomenon (Byrne, Citation2010). The theory is a priori known and the point of SEM is to model the relationships among observed and/or latent variables (Pituch & Stevens, Citation2016). A general model consists of the measurement part, which defines relations between observed and latent variables, and the structural part describing relations among the latent variables themselves (Byrne, Citation2010). At the output of SEM, there are values of free parameter estimates, calculated to provide minimum discrepancy between observed and predicted data.
Assumption of normality and its violation
In SEM, several estimation methods are used, of which the maximum likelihood (ML) is probably the most popular one. The ML method assumes data to be normal; as parameters of normality, in SEM, are usually considered univariate skewness and kurtosis of items and multivariate kurtosis of the whole item set (Cain et al., Citation2017; Gao et al., Citation2008; West et al., Citation1995). When assessing normality, in our study we consider the acceptable range from −2 to 2 for univariate skewness and the upper limit of 7 for normalised univariate kurtosis in accordance with West et al. (Citation1995). For multivariate kurtosis, we use the upper limit of 6 as reported by, e.g. Bentler (Citation2005).
The normality of real data is rarely found which has consequences for ML estimations. Increasingly nonnormal data could lead to the false rejection of even correctly specified models (Curran et al., Citation1996; Gao et al., Citation2008; Mindrilla, Citation2010) or underestimation of standard errors, making significant even those relationships that are not (Gao et al., Citation2008; Mindrilla, Citation2010; West et al., Citation1995). Relevant ways to deal with nonnormality effects include eliminating outliers, bootstrapping and using different estimation methods than ML (West et al., Citation1995).
Evaluation of SEM model
A crucial task is to recognise models that fit the given theory well and those that do not. Traditionally, chi-square statistics is a fundamental parameter used in SEM; however, some authors point to its excessive sensitivity to sample size and the practical inaccessibility of the null-hypothesis assuming that the model fits the observed data perfectly (Browne & Cudeck, Citation1992; Milfont & Fischer, Citation2010). That is why researchers have suggested a variety of fit indices to evaluate their models; the classification, meaning and use of frequently used indices are discussed in, e.g. Byrne (Citation2010), Hooper et al. (Citation2008), or Mueller and Hancock (Citation2008).
As our sample is quite large, we use chi-square statistics as a parameter to compare competing models rather than a criterion of their significance. Further, we considered recommendations provided by Hooper et al. (Citation2008), Hu and Bentler (Citation1999), Kline (Citation2016), and Niemand and Mai (Citation2018), and chose the following four indices to report our models: root mean square error of approximation (RMSEA) and its 90% confidence intervals, standardised root mean square residual (SRMR), comparative fit index (CFI) and Akaike information criterion (AIC). We require for an acceptable fit RMSEA < .08, SRMR < .08 and CFI > .90 and for a good fit RMSEA < .05, SRMR < .05 and CFI > .95 (Byrne, Citation2010; Hu & Bentler, Citation1999). AIC, which addresses the model parsimony, has no ‘optimal value’ since it is used for comparing competing models.
Multigroup comparison
Researchers are often interested in the comparison of SEM estimations obtained for different respondent groups (according to region, gender, ethnicity …). Such a comparison is meaningful only if the instrument measures the same concept on the same scale across these groups (Raudenská, Citation2020) – otherwise, we do not know whether the observed differences are due to different attitudes of the respondents or due to the different interpretation of the instrument itself. Therefore, initially, the measurement invariance should be inspected.
The well-established strategy suggested by Jöreskog (Citation1971) is based on testing a hierarchical sequence of three increasingly restrictive models. The first step is a configural model which assumes the same factorial structure across groups but lays no restrictions on the estimated parameters (so-called configural invariance). Secondly, the metric invariance is inspected. The metric model assumes that the relations between items and their underlying latent constructs are equally strong in the compared groups, which requires factor loadings to be equal across groups. If metric invariance is met, regression analyses could be done and their results could be compared. Finally, the scalar invariance is tested which assumes that respondents with the same score on a latent variable would have the same score on the associated observed variables. Therefore, the scalar model requires not only factor loadings, but also intercepts to be equal across groups; reaching scalar invariance is necessary to compare latent means. For a more detailed description of invariance and its testing, we refer to, e.g. Milfont and Fischer (Citation2010) or Putnick and Bornstein (Citation2016).
The increasing restrictions on nested models worsen their parameters, so the question arises when is this deterioration still acceptable and when must we admit that the invariance has failed. In line with Chen (Citation2007), we will accept a decrease in CFI (ΔCFI) of −.010 and an increase in RMSEA (ΔRMSEA) of .015 as borderlines when testing the metric and scalar invariance. For every pairwise comparison of estimated parameters, we refer to the p-value calculated from the critical ratio for the difference between compared parameters.
Preliminary considerations about raw data
Before addressing the results, let us describe the phase of preparing data for analysis and verifying assumptions on normality; the whole data analysis procedure is schematically shown in .
Figure 1. The scheme of data analysis procedure.
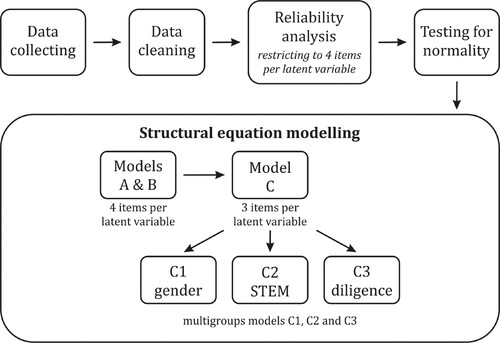
At the very beginning, we filtered out evidently invalid responses, using three pairs of direct- and reverse-worded items. To exclude a respondent, at least one of the following two criteria had to be met: (a) in one of the pairs, the difference in score is equal to 6 or (b) in at least two pairs, the difference in score is ≥5. This restriction led to the removal of 25 respondents (1.2%) from the analysis. Further, for the purposes of SEM, we excluded another 194 respondents (9.6%) whose responses contained missing data, leaving a final analysed sample size of 1805 students.
Within the preliminary analysis, the data showed Cronbach’s alpha of .867 and McDonald’s omega of .875 suggesting a satisfactory level of reliability; summarises the reliabilities of latent variables, each of which corresponds to one LIMI-C dimension. To easily compare the reliability, we decided to represent each latent variable by four observed variables, thus we had to exclude three items of value/usefulness. In doing so, we sought a trade-off between two aspects: (a) the decrease of latent variable reliability should be as low as possible and (b) the pairs of highly correlating items (with Pearson’s r > .60) should be eliminated. As a result, we excluded items 8, 14 and 18 which led to the decrease in alpha to the still acceptable value of .800 and to the decrease of inter-item correlation below .58. The remaining items (1, 7, 10 and 22) enter the initial model labelled A ().
Figure 2. The path diagram of the model A: observed variables in rectangles, latent variables in ovals.
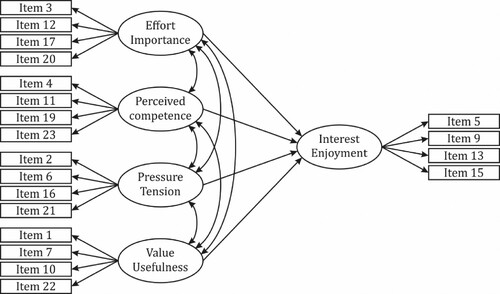
Table 1. Latent variables and their reliabilities.
Finally, we should look at the requirements of data normality. Our items show good values for both univariate skewness (from −1.68 to 1.69 depending on item) and univariate kurtosis (from −.84 to 3.23); however, the multivariate kurtosis of 73.71 is beyond the acceptable value. We must admit that our data are nonnormal; still, the question remains whether and how this fact influences the estimates. We, therefore, performed the pilot run of model A twice – first using the ML method and secondly using the robust maximum likelihood method (MLR) which does not require normality. Using the Mplus software (since Amos software does not offer MLR) we obtained very close results for ML and MLR for both the estimates themselves and the indicators of fit quality (change in chi-square = .4, ΔCFI = .003, no change in RMSEA). Based on this finding, we use only ML estimates in the following text; however, being aware of data nonnormality, we will exclusively refer to bootstrapped standard errors (based on 2000 bootstrap samples).
Results
As an initial model we used model A (see ) and we endeavoured to optimise it. Since the covariance between latent variables effort/importance and pressure/tension was estimated as only −.01 in model A, in model B we assumed it to be zero; the fit indices remained almost unchanged (see ). Lastly, in model C we decided to prefer its parsimony by saturating each latent variable with only three observed variables instead of four, resulting in excluding items 5, 6, 10, 12 and 23. The criterion for removal was a combination of lower factor loading and high modification indices associated with the removed items. As evident from , model C () showed improvement of all key fit indices and serves as a baseline for multigroup models C1−C3. In the multigroup models, we chose the criteria for dividing our sample so that the compared groups were similar in size.
Figure 3. The path diagram of both the model C and its multigroup equivalents C1–C3.
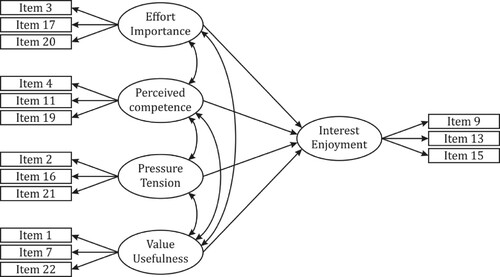
Table 2. Comparison within single-group models (A–C) and within multigroup models (C1–C3).
In model C1, the sample was divided into two groups according to gender. Model C2 also included two groups of respondents – the first group consisted of those who had chosen in the LIMI-B that they wanted to study STEM at university (answer 1 = definitely yes), the second group of those who were unlikely to do so (answers 4 = rather not and 5 = definitely not). Two other groups of respondents also entered model C3 – on one hand, those who feel themselves diligent in physics (answer 1 = very diligent), and, on the other hand, those who admit to a lack of diligence (answers 4 = a little diligent and 5 = lazy). Since our aim was to compare not only regression weights, but also latent means in all three models, we required their scalar invariance. The fit indices for models C1–C3 are listed in ; since |ΔCFI| ≤ .005 and |ΔRMSEA| ≤ .001, we can state that scalar invariance holds in all three models.
Before we proceed to a multigroup comparison, let us summarise the outputs from the baseline model C: fit indices of this model have been already provided in , standardised estimates of regression paths are summarised in . By far the strongest positive predictor of IM appears to be the dimension value/usefulness, followed by the effort/importance. The influence of the remaining two dimensions is rather minor, with pressure/tension being the only negative predictor dimension of IM. At p = .005, all the regression paths are significantly different from zero, although both pressure/tension and perceived competence are not far from the threshold for significance.
Table 3. Estimates of model C with bootstrapped standard errors in brackets.
Model C1: gender difference
The numerical outputs related to model C1 are summarised in . When comparing latent means, girls are a reference group with a value of .000 assigned, and the values for boys stand for the difference between groups. When this difference is negative, it shows a stronger feeling of the measured quality (e.g. perceived competence) and vice versa.Footnote1 We can see that boys believe themselves to be more competent and feel less tension when experimenting in IPL. On the other hand, effort/importance and value/usefulness do not show significant differences according to gender. Regarding the regression coefficients, intrinsic motivation (i.e. interest/enjoyment) is the most saturated by effort/importance and value/usefulness; the latter being more significant in girls.
Table 4. Estimates of the scalar model C1 with bootstrapped standard errors in brackets.
Model C2: intention to study STEM
A comparison of latent means gives the unsurprising result that students who intend to study STEM at university have significantly different attitudes towards practical work in IPL from those who do not have such an intention (see ). More specifically, they express higher perceived competence, stronger perceived usefulness and lower pressure associated with their practical work; their feeling of invested effort is also higher.
Table 5. Estimates of the scalar model C2 with bootstrapped standard errors in brackets.
In the group of probable future STEM students, the most important predictor of intrinsic motivation is the feeling of the value of the activity. On the other hand, students not intending to continue in future STEM studies focus more strongly on the issue of invested effort. Moreover, their IM is also more negatively affected by the pressure they perceive when experimenting (although the between-group difference is not significant at the .05 level, the p-value of .064 is close to it).
Model C3: diligence in physics
The respondent groups defined by self-reported diligence also show significant differences in the means of all latent variables (see ), with no exceptions larger than those listed in . The self-reported diligence strongly polarises students’ responses mainly in the dimension value/usefulness with a large gap of means of almost 1.4. This latent variable is also by far the strongest predictor of IM for both groups, followed by effort/importance. At .05 level, the strength of predictors significantly differs only in effort/importance; in students who tend to be less diligent in physics lessons, this latent variable intervenes more strongly in IM.
Table 6. Estimates of the scalar model C3 with bootstrapped standard errors in brackets.
Summary
Regardless of the criterion by which students were divided, the strongest predictor of IM appears to be the latent variable value/usefulness, followed by effort/importance. Both these predictors are positive, i.e. a stronger perception of them implies a stronger IM. In contrast, pressure/tension is a negative predictor for all the studied groups, but with a lower impact than the two previously mentioned dimensions. Perceived competence is a positive predictor of IM and its effect is close to the level of statistical significance in most of the groups compared.
Discussion and implications
Predictors of intrinsic motivation
When referring to the first research question (RQ1), our results show that among the latent variables effort/importance, pressure/tension, perceived competence and value/usefulness, the last one is the strongest predictor of intrinsic motivation as measured by LIMI-C. This is in line with, e.g. Gustafsson (Citation2005) who reported large correlations between value/usefulness and interest/enjoyment. Hence, convincing students of the meaningfulness and usefulness of practical work is essential for stimulating their situational interest. We suggest that such meaningfulness can be achieved in two ways – in terms of subject matter and in terms of experimental process.
In terms of subject matter, Harlen (Citation1999) mentioned ‘little relevance to everyday life’ as one of the common weaknesses of practical/laboratory work for many students. Similarly, Cerini et al. (Citation2003) see a considerable potential for improvement across science subjects in this area. While the mechanical oscillator, for example, is undoubtedly a useful model, teachers should think about lab work design from which students take more than just the memory of a weight hanging on a spring (which is far from anything that students consider practically useful). This does not mean avoiding the traditional themes of students’ measurements, but rather devoting serious attention to the connections between these lab situations and the real world. Although many teachers do this routinely in their lessons, we feel the need here to emphasise that in practical work, its perceived usefulness is crucial for emerging situational interest.
In terms of the experimental process, we believe the perceived usefulness of practical work can be enhanced by finding a suitable way of assigning it and considering an appropriate choice of tools. At IPL, we have had good experience with assignments given in the form of a structured inquiry which provides opportunities for hypotheses generation and testing. In contrast to still frequent recipe-like labs (Millar, Citation2010), the assignments we try to design should not seem single-purpose, but as a means for developing more general competences (formulating hypotheses, drawing and reading graphs, data analysing, presenting the results to classmates, etc.) using a specific experimental situation. When it comes to experimental tools and equipment, we see a great potential in the ‘bring your own device’ approach that has been shown to increase students’ engagement in school activities (González et al., Citation2015; González & González, Citation2016; Hochberg et al., Citation2018). Although we do not yet have enough experience with them in IPL, we especially consider apps that use integrated smartphone sensors (i.e. Phyphox, Physics Toolbox Sensor Suite) to be an excellent tool for physics education. Their use removes the difficulty for students in operating unfamiliar devices that are rare outside of school, while naturally raising questions like: How does my device measure? What principle does it use? What is the sensor range? How accurate are the measurements? How will a comparison of multiple different devices turn out? Can I rely on mine? As physics educators, these are the questions we want our students to ask. Although the number of situations for which smartphone sensors are appropriate is limited, we believe that even their occasional use can help students to appreciate the relevance of practical work to everyday contexts. We expect a similar effect from the in-class use of electronic tools that students may occasionally use out-of-school – ranging from, e.g. MS Excel, Audacity or digital camera to apps like magnifier, tuner or tone generator. After all, even in the case of material, tangible aids we prefer ordinary things to various sets designed specifically for educational purposes.
The latent variable effort/importance turned out to be the second strongest predictor of IM to practical work; since it is a positive predictor, a higher level of expressed effort leads to higher IM. For physics lecture demonstrations, a similar conclusion was reached by Kácovský and Snětinová (Citation2021) who reported that demonstrations are more positively perceived by students who find school physics more demanding. Perhaps this result is somewhat surprising, considering that many well-accepted models in cognitive psychology, neuroscience or economics, for example, argue that when given a choice, people tend to avoid effort (Inzlicht et al., Citation2018). On the other hand, Inzlicht et al. also claim that effort can be rewarding. While it is therefore logical to view effort as a consequence of intrinsic motivation (‘I enjoy the activity, therefore I put more effort into it’), the opposite implication can also be sought (‘the activity is appropriately challenging for me, therefore I enjoy it’).
The weakest predictors of IM turned out to be perceived competence and pressure/tension. In line with the theoretical background of SDT (Ryan, Citation1982), the first is a positive predictor, while the latter is negative. In the context of practical work, both these predictors are closely related to the work of the lecturers – the level of support provided by them to the students can largely influence students’ feeling of confidence and competence, but the lecturers’ attention and interventions may also be sources of external pressure. Therefore, we interpret our data to suggest that lecturers’ individualised interventions ensure that differences in students’ perceived competence and in coping with nervousness and external pressure do not translate more fundamentally into expressed intrinsic motivation. The question remains, however, to what extent this finding is transferable to school practice. The IPL lecturers know all the experimental tasks and their pitfalls in detail, treat visitors strictly in partnership and work with them more intensively than is possible for a single teacher. From our experience, we consider two lecturers to be the optimal number for a group of about 15 students carrying out practical work, although this is hardly achievable in school practice.
Gender issue
The second research question (RQ2) refers to gender comparison. The results showed the strength of predictor variables to be similar for boys and girls, apart from value/usefulness of practical activity, which appears to be more essential for girls. However, rather than comparing regression weights, the comparison of latent means is worthy of attention. Our finding that no gender gap exists in the latent variables effort/importance and value/usefulness is in line with the previous study of Kácovský and Snětinová (Citation2021) who reported the same results when exploring intrinsic motivation towards physics lecture demonstrations. However, we found that during practical work, girls experience a lower feeling of competence and higher pressure than boys do. This is consistent not only with previous studies (Kokott et al., Citation2018; Murphy, Citation1993) but also with our experience that girls are more likely to label themselves as ‘talentless at physics’, even when they perform excellently in IPL.
In our study, we have not investigated sources of girls’ lower perceived competence during science labs, but this issue has already been addressed by researchers in the past. As we have already mentioned in the Research context, one source of girls’ low perceived competence in science labs is considered their reluctance to work with electronic measuring instruments (Murphy, Citation1993). To reduce this, Kokott et al. (Citation2018) suggest mixed-sex pairs with clear division of responsibility in practical work. However, if boys in mixed groups are assigned to operate more sophisticated devices, we are afraid it can send a message to girls that they are preconceived as the less capable and thus deepen their feeling of incompetence. Additionally, in our experience upper secondary students prefer to form same-sex groups, which we allow them to do – thus, in all-girl groups, girls must deal even with tasks less popular for them, e.g. manipulating technological devices. Instead of managing the group composition, we want once again to turn attention to the use of the ‘bring your own device’ approach as a measurement tool. Unlike common laboratory devices, both girls and boys are usually equally familiar with their own smartphones, so it is to be expected that their use can help close the gender gap in competence during physics practical work; this issue could be a subject for further research.
Another aspect that can undermine girls’ perceived competence is the teacher’s way of communication. Murphy (Citation1993) has shown that in science practical work, all-girl groups spend more time in contact with the teacher and ask for more advice. We believe teacher interventions should encourage independent activity of each group, but no group should become strongly dependent on them. It is entirely up to the teacher to distinguish whether such communication is still factually based, or whether it is just a tendency to avoid thinking and make the work easier.
Finally, even the on-site, instant verbal assessment of practical work shouldn’t be gender-dependent. Despite how obvious it sounds, e.g. Walkerdine (Citation1998) reported that while girls’ success in maths is generally attributed to their diligence, boys are mentioned for their ‘natural competency’. We consider it essential that the teacher avoids even hints of gender stereotyping in both verbal and non-verbal communication; phrases like ‘ladies, even though AC circuits may not be your cup of tea, try to build this one’ simply have no business in the classroom.
Intention to study STEM, students’ diligence
In response to the remaining research questions, (RQ3 and RQ4), we found that students with greater intention to study STEM and with higher self-reported diligence in physics perceived practical work in IPL significantly more positively in all predictor dimensions; especially grouping respondents by their diligence defined two highly polarised cohorts. This supports previous findings reported by Kácovský and Snětinová (Citation2021), who evaluated students’ self-reported diligence in school physics to be a very strong predictor for the assessment of one-off activity.
The message of the previous paragraph is important because it implies that arousing higher intrinsic motivation towards practical work in students who label themselves as less diligent or lazy can be difficult. These students report a low feeling of value/usefulness, while at the same time, however, this dimension is for them the strongest predictor of intrinsic motivation – logically, this results in a lower level of intrinsic motivation expressed. Additionally, for these students, the latent variable effort/importance significantly shapes their intrinsic motivation, with a regression weight close to that of value/usefulness. In other words, just convincing them of the everyday usefulness and meaningfulness of practical work is not enough; it is equally important to convince them that it’s worth investing more effort into practical work. We interpret this finding to mean that these students do not find experimenting in IPL challenging and enjoyable enough to invest more energy in it. Thus, we confirm here recommendation that practical work should be appropriately challenging for students to value it (Bennett, Citation2003; Hodson, Citation1990).
Limitations
Although our sample covers all visitors of IPL, it is not representative of the population of upper secondary students. Students attending IPL are predominantly from the metropolitan area of Prague and their physics teachers could be considered more active and motivated. Some teachers bring their students to IPL repeatedly for different physics topics, so it is possible that a few students filled our questionnaire more than once. However, as the LIMI measures an instantaneous response to the given activity, this does not largely affect our research. According to our experience, students usually completed the questionnaire carefully, but we cannot exclude that some of them felt pressured if they were slower to respond.
Further, in this paper, we have not addressed how research results depend on the specific physics topics, the assignment of practical work (e.g. openness of investigation) or the tools used (‘bring your own device’ approach vs. traditional devices). We propose to use an experimental-based design to intentionally change these parameters and observe students’ response in a possible follow-up research.
Finally, as is common in quantitative research, our results generalise the findings for some groups of students. In a specific case, however, it always depends on the interaction of students with a particular teacher/lecturer, who is the fundamental actor in designing meaningful practical work and making it relevant to everyday reality.
Conclusions
In our research, we started from the self-determination theory and used the ‘laboratory version’ of Intrinsic Motivation Inventory to assess the intrinsic motivation of upper secondary students during their hands-on practical work in the laboratory at our faculty. Our primary goal was to assess how strong predictors of intrinsic motivation are the latent variables effort/importance, pressure/tension, perceived competence, and value/usefulness. Our results show that the strongest predictor of intrinsic motivation is the subjectively perceived value/usefulness of practical work. In students who label themselves as less diligent in physics and those who do not plan studying STEM at university, the level of effort invested is also a significant positive predictor (i.e. higher effort leads to higher IM). The strength of individual predictors is practically independent of gender, however, girls expressed a significantly lower feeling of competence during practical work and felt greater pressure when experimenting. Previous studies (Murphy, Citation1993; Walkerdine, Citation1998) indicate that to enable closing this gender gap, the teacher should beware expressions of gender prejudices in practical work as well as exaggerated attention devoted to all-girl groups requiring help.
To support the motivational aspects of practical work in both genders, we consider it necessary to choose relevant topics for experimenting that has clear connection to out-of-school practice. Similarly, tools and devices used in physics practical work should be relevant to and known from students’ everyday life, making manipulation with them useful and valuable not only for school purposes. As previous research suggests (González & González, Citation2016; Hochberg et al., Citation2018), these requirements are met, e.g. by using students’ smart devices that stimulates students’ interest and engagement in practical work. Our observations also show that in some laboratory situations students use their smartphones spontaneously (recording slow motion videos, using magnifier apps, inclinometers etc.); we think this natural behaviour should be encouraged and guided so that it can serve for scientific exploration.
Finally, our research points out that a suitable level of demands and challenge is needed when designing practical work; low-challenging assignments can decrease intrinsic motivation mainly in students with a weaker, less positive relation to physics.
Ethics statement
This research, including the way of obtaining informed consent, was approved by the Research Ethics Committee of the Faculty of Mathematics and Physics, Charles University, No. 2022/01.
Disclosure statement
No potential conflict of interest was reported by the author(s).
Additional information
Funding
Notes
1 The same approach and logic is used in and .
References
- Abrahams, I. (2007). An unrealistic image of science. School Science Review, 88(324), 119–122.
- Abrahams, I. (2009). Does practical work really motivate? A study of the affective value of practical work in secondary school science. International Journal of Science Education, 31(17), 2335–2353. https://doi.org/10.1080/09500690802342836
- Arthur, C., Shepherd, L., & Sumo, M. (2006). The role of students’ diligence in predicting academic performance. Research in the Schools, 13(2), 72–80.
- Baker, J. P., & Goodboy, A. K. (2019). The choice is yours: The effects of autonomy-supportive instruction on students’ learning and communication. Communication Education, 68(1), 80–102. https://doi.org/10.1080/03634523.2018.1536793
- Banchi, H., & Bell, R. (2008). The many levels of inquiry. Science and Children, 46(2), 26–29.
- Bennett, J. (2003). Teaching and learning science: A guide to recent research and its applications. Continuum.
- Bentler, P. M. (2005). Eqs 6 structural equations program manual. Multivariate Software, Encino.
- Browne, M. W., & Cudeck, R. (1992). Alternative ways of assessing model Fit. Sociological Methods & Research, 21(2), 230–258. https://doi.org/10.1177/0049124192021002005
- Byrne, B. M. (2010). Multivariate applications series. Structural equation modeling with AMOS: Basic concepts, applications, and programming (2nd ed.). Routledge/Taylor & Francis Group.
- Cain, M. K., Zhang, Z., & Yuan, K.-H. (2017). Univariate and multivariate skewness and kurtosis for measuring nonnormality: Prevalence, influence and estimation. Behavior Research Methods, 49(5), 1716–1735. https://doi.org/10.3758/s13428-016-0814-1
- Center of Self-Determination Theory. (n.d.). Intrinsic motivation inventory (IMI). Retrieved January 17, 2022, from, https://selfdeterminationtheory.org/intrinsic-motivation-inventory/
- Cerini, B., Murray, I., & Reiss, M. (2003). Student review of the science curriculum: Major findings. (tech. Rep.). planet science, Institute of Education, Science Museum, University of London. https://doi.org/10.13140/RG.2.2.18429.31206
- Chen, F. F. (2007). Sensitivity of goodness of Fit indexes to lack of measurement invariance. Structural Equation Modeling: A Multidisciplinary Journal, 14(3), 464–504. https://doi.org/10.1080/10705510701301834
- Curran, P., West, S., & Finch, J. (1996). The robustness of test statistics to nonnormality and specification error in confirmatory factor analysis. Psychological Methods, 1(1), 16–29. https://doi.org/10.1037/1082-989X.1.1.16
- Deci, E. L., & Ryan, R. M. (1985). Intrinsic motivation and self-determination in human behavior. Springer.
- Department of Physics Education. (2020). Research on intrinsic motivation in experimental activities. https://www.mff.cuni.cz/en/kdf/research-and-cooperation/research-on-intrinsic-motivation-in-experimental-activities
- Department of Physics Education. (n.d.). Interactive physics laboratory. Retrieved October 10, 2022, from https://www.mff.cuni.cz/en/kdf/events-for-schools/interactive-physics-laboratory
- Erickson, M., Marks, D., & Karcher, E. (2020). Characterizing student engagement with hands-on, problem-based, and lecture activities in an introductory college course. Teaching & Learning Inquiry, 8(1), 138–153. https://doi.org/10.20343/teachlearninqu.8.1.10
- Farland-Smith, D., Finson, K. D., & Arquette, C. M. (2017). How picture books on the national science teacher's association recommend list portray scientists. School Science and Mathematics, 117(6), 250–258. https://doi.org/10.1111/ssm.12231
- Gao, S., Mokhtarian, P., & Johnston, R. (2008). Nonnormality of data in structural equation models. Transportation Research Record: Journal of the Transportation Research Board, 2082(1), 116–124. https://doi.org/10.3141/2082-14
- Gardner, P., & Gauld, C. (1990). Labwork and students’ attitudes. In E. Hegarty-Hazel (Ed.), The student laboratory and the science curriculum (pp. 132–156). Routledge.
- González, MÁ, & González, MÁ. (2016). Physics in your pocket: Doing experiments and learning With your smartphone. In L.-J. Thoms, & R. Girwidz (Eds.), Selected papers from the 20th international conference on multimedia in physics teaching and learning (pp. 179–185). European Physical Society.
- González, MÁ, González, MÁ, Martín, M. E., Llamas, C., Martínez, Ó, Vegas, J., Herguedas, M., & Hernández, C. (2015). Teaching and learning physics with smartphones. Journal of Cases on Information Technology, 17(1), 31–50. https://doi.org/10.4018/JCIT.2015010103
- Gustafsson, P. (2005). Gender inclusive physics education—a distance case. European Journal of Physics, 26(5), 843–849. https://doi.org/10.1088/0143-0807/26/5/017
- Harlen, W. (1999). Purposes and procedures for assessing science process skills. Assessment in Education: Principles, Policy & Practice, 6(1), 129–144. https://doi.org/10.1080/09695949993044
- Hidi, S., & Harackiewicz, J. M. (2000). Motivating the academically unmotivated: A critical issue for the 21st century. Review of Educational Research, 70(2), 151–179. https://doi.org/10.3102/00346543070002151
- Hochberg, K., Kuhn, J., & Müller, A. (2018). Using smartphones as experimental tools—effects on interest, curiosity, and learning in physics education. Journal of Science Education and Technology, 27(5), 385–403. https://doi.org/10.1007/s10956-018-9731-7
- Hodson, D. (1990). A critical look at practical work in school science. School Science Review, 71(256), 33–40.
- Hooper, D., Coughlan, J., & Mullen, M. (2008). Structural equation modelling: Guidelines for determining model Fit. Electronic Journal of Business Research Methods, 6(1), 53–60.
- Hu, L., & Bentler, P. M. (1999). Cutoff criteria for fit indexes in covariance structure analysis: Conventional criteria versus new alternatives. Structural Equation Modeling: A Multidisciplinary Journal, 6(1), 1–55. https://doi.org/10.1080/10705519909540118
- Inzlicht, M., Shenhav, A., & Olivola, C. Y. (2018). The effort paradox: Effort is both costly and valued. Trends in Cognitive Sciences, 22(4), 337–349. https://doi.org/10.1016/j.tics.2018.01.007
- Itzek-Greulich, H., & Vollmer, C. (2017). Emotional and motivational outcomes of lab work in the secondary intermediate track: The contribution of a science center outreach lab. Journal of Research in Science Teaching, 54(1), 3–28. https://doi.org/10.1002/tea.21334
- Jöreskog, K. G. (1971). Simultaneous factor analysis in several populations. Psychometrika, 36(4), 409–426. https://doi.org/10.1007/BF02291366
- Kácovský, P., & Snětinová, M. (2021). Physics demonstrations: Who Are the students appreciating them? International Journal of Science Education, 43(4), 529–551. https://doi.org/10.1080/09500693.2020.1871526
- Kline, R. B. (2016). Principles and practice of structural equation modeling (4th ed.). The Guilford Press.
- Kokott, K., Lengersdorf, D., & Schlüter, K. (2018). Gender construction in experiment-based biology lessons. Education Sciences, 8(3), 115. https://doi.org/10.3390/educsci8030115
- Milfont, T., & Fischer, R. (2010). Testing measurement invariance across groups: Applications in cross-cultural research. International Journal of Psychological Research, 3(1), 111–130. https://doi.org/10.21500/20112084.857
- Millar, R. (2010). Practical work. In J. Osborne, & J. Dillon (Eds.), Good practice in science teaching: What research has to say (2nd ed, pp. 108–134). Open University Press.
- Mindrilla, D. (2010). Maximum likelihood (ML) and diagonally weighted least squares (DWLS) estimation procedures: A comparison of estimation bias with ordinal and multivariate Non-normal data. International Journal for Digital Society, 1(1), 60–66. https://doi.org/10.20533/ijds.2040.2570.2010.0010
- Monteiro, V., Mata, L., & Peixoto, F. (2015). Intrinsic motivation inventory: Psychometric properties in the context of first language and mathematics learning. Psicologia: Reflexão E Crítica, 28(3), 434–443. https://doi.org/10.1590/1678-7153.201528302
- Mueller, R., & Hancock, G. (2008). Best practices in structural equation modeling. In J. Osborne (Ed.), Best practices in quantitative methods (pp. 488–508). SAGE Publications, Inc.
- Murphy, P. (1993). Gender differences in pupils’ reactions to practical work. In R. Levinson (Ed.), Teaching science (pp. 138–150). Routledge.
- Niemand, T., & Mai, R. (2018). Flexible cutoff values for fit indices in the evaluation of structural equation models. Journal of the Academy of Marketing Science, 46(6), 1148–1172. https://doi.org/10.1007/s11747-018-0602-9
- Owen, S., Dickson, D., Stanisstreet, M., & Boyes, E. (2008). Teaching physics: Students’ attitudes towards different learning activities. Research in Science & Technological Education, 26(2), 113–128. https://doi.org/10.1080/02635140802036734
- Pavelková, I., Škaloudová, A., & Hrabal, V. (2010). Analýza vyučovacích předmětů na základě výpovědí žáků. [Analysis of school subjects on the basis of the testimony of pupils]. Pedagogika, 60(1), 38–61.
- Pituch, K. A., & Stevens, J. P. (2016). Applied multivariate statistics for social sciences (6th ed.). Routledge.
- Putnick, D. L., & Bornstein, M. H. (2016). Measurement invariance conventions and reporting: The state of the Art and future directions for psychological research. Developmental Review, 41, 71–90. https://doi.org/10.1016/j.dr.2016.06.004
- Raudenská, P. (2020). The cross-country and cross-time measurement invariance of positive and negative affect scales: Evidence from European social survey. Social Science Research, 86, 102369–12. https://doi.org/10.1016/j.ssresearch.2019.102369
- Renninger, K. A., & Hidi, S. E. (2016). The power of interest for motivation and engagement (1st ed.). Routledge.
- Ryan, R. M. (1982). Control and information in the intrapersonal sphere: An extension of cognitive evaluation theory. Journal of Personality and Social Psychology, 43(3), 450–461. https://doi.org/10.1037/0022-3514.43.3.450
- Ryan, R. M., & Deci, E. L. (2000). Self-Determination theory and the facilitation of intrinsic motivation, social development, and well-being. American Psychologist, 55(1), 68–78. https://doi.org/10.1037/0003-066X.55.1.68
- Ryan, R. M., & Deci, E. L. (2017). Self-Determination theory: Basic psychological needs in motivation, development, and wellness. The Guilford Press.
- Ryan, R. M., & Deci, E. L. (2019). Advances in motivation science. Advances in Motivation Science, 6, 111–156. https://doi.org/10.1016/bs.adms.2019.01.001
- Schiefele, U. (2009). Situational and individual interest. In K. R. Wentzel, & A. Wigfield (Eds.), Handbook of motivation at school (pp. 197–222). Routledge.
- Shin, M., & Johnson, Z. D. (2021). From student-to-student confirmation to students’ self-determination: An integrated peer-centered model of self-determination theory in the classroom. Communication Education, 70(4), 365–383. https://doi.org/10.1080/03634523.2021.1912372
- Snětinová, M., & Kácovský, P. (2019). Interactive physics laboratory: A place for hands-on experimenting. AIP Conference Proceedings 2152 (Proceedings of the 21st DIDFYZ Conference 2019), 030031.
- Walkerdine, V. (1998). Counting girls Out (1st ed.). Routledge.
- West, S. G., Finch, J. F., & Curran, P. J. (1995). Structural equation models with Non normal variables: Problems and remedies. In R. H. Hoyle (Ed.), Structural equation modeling: Concepts, issues, and applications (pp. 56–75). Sage.
- Wong, B., DeWitt, J., & Chiu, Y.-L. T. (2021). Mapping the eight dimensions of the ideal student in higher education. Educational Review, 1–19. https://doi.org/10.1080/00131911.2021.1909538