
ABSTRACT
Concern that stereotypical perceptions of scientists may influence attitudes towards science and willingness to pursue STEM-related careers has motivated interest in children’s perceptions of scientists. This study investigated primary children’s drawings of scientists at work based on Chambers’ ‘Draw-A-Scientist Test’ (DAST) and explored the influence of living during the COVID-19 pandemic on perceptions of scientists. One hundred and ninety-four children participated in the study; school closures interrupted the study resulting in fifty-one participating during the COVID-19 pandemic. Stereotypic views of scientists that increased with age were revealed; differences between age groups were statistically significant. Drawings frequently depicted smiling lab-coated males working indoors using chemistry equipment. Boys incorporated significantly more stereotypic views in their drawings than girls. Same-sex preference for drawings of scientists was evident with female scientists drawn only by girls; however, this same sex preference weakened for girls, and they drew more male scientists as they got older. The absence of many traditional stereotypical indicators and presence of positive dispositions towards scientists and their work were welcome findings. There was greater awareness of the work of scientists amongst younger participants and a shift to broader conceptions of this work, both associated with living during the COVID-19 pandemic.
Introduction
The last decade has seen large-scale commitment in many countries to advancing STEM education. This has led to policy development aimed at providing high quality STEM experiences in schools and, in turn, developing a pipeline of young people interested in STEM careers. Much of this momentum is motivated by the economic prosperity that comes from having a highly skilled STEM workforce (Cannady et al., Citation2014; Philip et al., Citation2018), although this motivation is strongly contested by many (De Roock & Baildon, Citation2019; Vakil, Citation2018). Other motivations especially prevalent in educational policy documents include the desire to provide high-quality STEM experiences for all students, most notably, a growing awareness of the importance of attracting a more diverse workforce into STEM (Government of Ireland, Citation2015, Citation2017a, Citation2017b). In many countries, the STEM workforce is predominantly male. These gender disparities occur as early as highschool subject choices with males more likely to study technology and the physical sciences (Goos et al., Citation2020). These gender differences persist into college and into the workforce. For example, in 2019, the EU had 20.8 STEM graduates per 1000 (age 20–29). However, the gender differential was 13.8, with 27.5 males compared to a mere 13.7 females per 1000 qualified in a STEM area (Central Statistics Office [CSO], Citation2020).
This gender inequity in engagement in STEM has ramifications, we argue, not only at the individual but also at the societal level. Societal implications are communicated very succinctly by Sadker and Sadker (Citation1996, p. 14) in their statement ‘If the cure for cancer is forming in the mind of one of our daughters, it is less likely to become a reality than if it is forming in the mind of one of our sons. Until this changes, everyone loses’. While the quote is framed in terms of girls, it might as easily apply to some boys and members of racial and ethnic communities in our classrooms. If we are not all represented in the vital work of society, be it females, the poor, or people from ethnic or racial minority groups, then we are all disadvantaged – both men and women and society as a whole.
From as early as primary school, young learners’ perceptions about science inform their subject decisions (Goos et al., Citation2020) and their subsequent career decisions. It is imperative, then, that efforts are made to gain insights into their perceptions of scientists. This study explores the perceptions of these young learners about scientists and the work they do. The study takes place at an important juncture in Irish education with the recent publication of a new Primary Curriculum Framework (NCCA, Citation2023a, Citation2023b). This curriculum framework presents a decoupling of science from history and geography within the previous alignment ‘Social, Environmental and Scientific Education’ and a repositioning to the curricular area termed ‘Mathematics, Science and Technology Education’. Gathering information on children’s perceptions of science will not only provide valuable insights into STEM understandings and misconceptions, it will inform the design of curricular experiences that challenge pervasive stereotypes and further inform efforts to support the design of STEM professional development for teachers in Ireland (Hourigan, O’ Dwyer, Leavy, & Corry, Citation2022; O'Dwyer, Hourigan, Leavy, & Corry, Citation2023).
Review of the literature
International surveys of public attitudes towards science find disparate views of science amongst the public. Some national surveys reveal a well-informed public who report finding science vibrant and invigorating and perceive scientists and medical health professionals as the most trustworthy professionals (DBEIS, Citation2019; SFI, Citation2020). However, over half the world’s population don’t believe they know much – if anything – about science (Wellcome Global Monitor, Citation2018) and many find science intimidating and hold inaccurate, and at times negative stereotypes, of science and scientists. These latter views of science may negatively influence attitudes towards science and impact interest, participation and uptake of science subjects. Nonetheless, international science surveys reveal increasingly positive attitudes towards science over time, higher levels of trust in scientists, and public belief that they are well-informed and that scientific information is more accessible (De Jong et al., Citation2020; Miller, Citation2001; Millstone & van Zwanenberg, Citation2000). Consequently, both research and policy initiatives have invested effort in examining attitudes towards science in the school years with a view to building positive and productive STEM identities. In this study, we look at the perception of science among our youngest learners – those in primary schools. Specifically, we focus on children’s perceptions of scientists and their work and examine the influence of the recent COVID-19 pandemic on perceptions of scientists.
Measuring children’s perceptions of science and scientists
A variety of written instruments have been utilised to gain access to perceptions of scientists. In 1975, Mead and Métraux (Citation1957) asked 35,000 American high school students to respond to written statements about scientists. This provides one of the first efforts to garner insights into school students views of scientists. The synthesised findings presented the description of a scientist as:
a man who wears a white coat and works in a laboratory. He is elderly or middle aged and wears glasses … he may wear a beard … he is surrounded by equipment: test tubes, bunsen burners, flasks and bottles, a jungle gym of blown glass tubes and weird machines with dials, … his work may be dangerous. (p. 386)
The 1980s witnessed a shift to the use of drawings to access perceptions of science, particularly with younger students who could not respond to written instruments. The Draw A Scientist Test (DAST) task was developed by Chambers (Citation1983) based on data collected over 11 years with primary aged children. Analysis of the drawings focused on the scientist and on objects in the environment labelling them as stereotypical or alternative. This original version of the DAST used seven indicators to analyse drawings – lab coats, eyeglasses, facial growth of hair, symbols of research (e.g. lab equipment), symbols of knowledge (e.g. books), technology (i.e. the products of science) and relevant captions (e.g. formulae). Drawings were scored from 1 to 7 based on the presence or absence of the 7 indicators, with a score of 1 being assigned to the presence of each indicator. Other characteristics were noted when deemed relevant (such as references to danger and lightbulbs) but were not incorporated into the scoring scheme.
Later efforts to improve the validity and reliability of DAST data have focused on refining the instructions or the coding schemes associated with the DAST. Development of the Draw-A-Scientist Checklist (DAST-C) (Finson et al., Citation1995) was an effort to improve the objectivity and interrater reliability of the DAST. The DAST-C incorporates the original 7 DAST indicators and includes additional indicator characteristics (such as the size of scientific instruments) as subcategories of the indicators. In addition, the DAST-C adds an eighth indicator to account for alternative images or other stereotypes that were either referenced by Chambers (Citation1983) and Mead and Métraux (Citation1957) or gained prominence since their studies, however, were not incorporated into their checklists. This eighth indicator consists of the subcategories of alternative images: male, Caucasian, signs of danger, lightbulbs, under-ground labs, mythic Frankenstein-like characters, references to secrecy, scientists working indoors and middle aged or elderly scientists. The presence of each major indicator in a drawing receives a score of 1; the larger the score, the more stereotypical the image.
Other studies have revealed insights into the challenges of using the DAST and DAST-C and provide a series of recommendations to improve the quality of information and inferences gleaned from the tests. Suggestions include eliciting verbal explanations from children about their drawings (Barman, Citation1996, Citation1997; Buldu, Citation2006; Chambers, Citation1983; Farland-Smith, Citation2012), collecting supplementary interview and survey data (Hillman et al., Citation2014; Samaras et al., Citation2012) and requesting that, for comparison purposes, additional drawings be produced of either a scientist (Barman, Citation1997; Matthews, Citation1996) or other professionals (Losh et al., Citation2008). Recently, Farland-Smith (Citation2012) developed a modified DAST (mDAST) test and rubric to capture the additional details included in drawings. It explicitly included reference to the appearance, location, and activity of scientists. Whereas DAST-C scoring focuses only on the presence or absence of specific indicators, the mDAST factors in additional detail in drawings by coding each of the three aspects (appearance, location, activity) on a continuum of ‘uncategorised’, ‘sensationalized’, ‘traditional’, and ‘broader than traditional’.
Insights into perceptions of scientists from the Draw A Scientist Test
Analysis of the drawings of scientists has uncovered stereotypes across a range of diverse groups, including preschool and school students in the United States (Chambers, Citation1983; Hillman et al., Citation2014), Serbia (Blagdanic et al., Citation2019), Turkey (Özel, Citation2012), Hong Kong (Fung, Citation2002) and South Korea (Jones & Hite, Citation2020); preservice teachers in Canada, Germany, and Israel (Milford & Tippett, Citation2013; Reinisch et al., Citation2017; Rubin et al., Citation2003) and college level students in South Africa (Meyer et al., Citation2019); and across diverse ethnic, minority and cultural contexts such as Native Americans (Laubach et al., Citation2012) and Hebrew and Arabic groups living in Israel (Koren & Bar, Citation2009).
Research in the last century examining primary students’ perceptions of scientists revealed parodies of lone bearded, bespectacled and messy-haired scientists engaging in experiments in indoor laboratories (Barman, Citation1996, Citation1997; Chambers, Citation1983). The seminal DAST study (Chambers, Citation1983) noted that children in Kindergarten-1st grade generally displayed none of the seven indicators, leading many to believe that stereotypes do not develop until later. However, collecting supplementary data alongside the DAST, particularly with younger children, suggest that perceptions of scientists may develop as early as preschool. Blagdanic et al. (Citation2019) combined the DAST with interviews of 209 6-7-year-olds and revealed a greater number of male than female scientists in drawings (43.5% compared to 20%). However, the interview data that asked whether a female can/cannot be a scientist did not suggest a distinctive gender stereotype for most children. Such studies with younger children also suggest positive perceptions of science as communicated in images of smiling scientists (Blagdanic et al., Citation2019; Özel, Citation2012) alongside traditional stereotypical images of them wearing lab coats, glasses, with messy hair and working predominantly indoors (Blagdanic et al., Citation2019). Other research has shown that these early perceptions of scientists become more stereotypical and limited as students advance through primary school (Barman, Citation1997; Chambers, Citation1983; Fung, Citation2002), particularly concerning science being a male domain of study. Indeed, the tendency for males to express gender stereotypes more often than females was revealed in a metanalysis of 5 decades of DAST studies carried out in the United States by Miller et al. (Citation2018); however, this same study revealed an overall decrease in this tendency to draw male scientists over historical time.
Chambers (Citation1983) reported that stereotypes of scientists become more prevalent as children get older, with reports of two stereotypic indicators displayed by those in grades 2–3 and three or more indicators by grades 4–5. Other studies support these findings and report an increase in the number of stereotypical views of scientists, including an increase in male scientists wearing eyeglasses, facial hair, and bow ties (Finson et al., Citation1995; Fung, Citation2002; Özel, Citation2012). Despite the tendency of children to draw same-sex images when simply asked to draw a person (Dickson et al., Citation1990), this appears not to apply when asked to draw a scientist. Studies show the tendency of both males and females to draw male scientists with images of females drawn almost exclusively by females (Fort & Varney, Citation1989). Moreover, compared to drawings of other professionals, there is some evidence from Losh et al.’s (Citation2008) study to suggest that elementary students’ drawings of scientists were less attractive and smiled less than drawings of veterinarians and teachers, thus leading the authors to conclude that scientists have ‘an image problem’ (p. 773) among children.
There has been a decrease in representations of scientists as mythical characters engaging in dangerous or secretive work and a move towards more realistic images of scientists as everyday people (Barman, Citation1997; Bodzin & Gehringer, Citation2001; Finson, Citation2002). Several studies attest to an increase in drawings of female scientists, especially by female students (Blagdanic et al., Citation2019; Farland-Smith, Citation2012) over the past two decades. However, the essential characteristics of a scientist as a ‘man of knowledge’ (Chambers, p. 256) has remained persistent and pervasive across the twentieth century (Barman, Citation1997; Chambers, Citation1983; Finson, Citation2002; Finson et al., Citation1995), across all age groups, grade levels (Finson, Citation2002) and countries (Chambers, Citation1983; Schibeci & Sorenson, Citation1983).
An important outcome of this large body of research is the finding that educational interventions that increase children’s exposure to science and scientists have been beneficial in challenging stereotypes. Following interventions, even the more stable characteristics are shown to be open to change with a shift towards more realistic and less stereotypical images of scientists, an increase in representations of females as scientists with more marked improvements for male participants (Finson, Citation2002; Finson et al., Citation1995; Flick, Citation1990; Mason et al., Citation1991).
Why do perceptions matter and what factors influence them?
Many factors influence student perceptions of science, including a combination of social and cultural factors existing at the levels of the individual, home and school. Cultural factors and the representation of scientists in popular media communicate messages about science and scientists (Flick, Citation1990; Schibeci & Sorenson, Citation1983) that may shape children’s perceptions about the characteristics of scientists and the work they do (Gardner, Citation1980; Long et al., Citation2010; Steinke et al., Citation2007). Little is known about the impact of widescale societal change, as in the case of global health pandemics, and the consequential influence of media representations of scientists on children’s perceptions of scientists and the work they do. Those few studies that are emerging suggest that the impact of the COVID-19 pandemic is evidenced in students’ representations of scientists and their work (Quílez-Cervero et al., Citation2021). Students’ perceptions of scientists have also been shown to relate to students’ attitudes toward science and self-efficacy (Schibeci, Citation1989). Consequently, it is concerning when these perceptions are stereotypical and not inclusive of the range of diverse applications of science that exist in everyday society. This impact of stereotypical and negative perceptions of science raises concerns particularly for the career aspirations of minorities and females. It is not unreasonable to assume that students are less likely to pursue a career in science if their perceptions of scientists, as communicated in their drawings, do not align with their beliefs about themselves. Also, a consequence of the stereotype of a scientist being a middle-aged white male may be that girls and minority students may think ‘that can’t be me’ and not associate themselves with this career.
Impetus for this study
Research reveals that as children get older, relatively stable stereotypes of scientists emerge as a middle-aged Caucasian spectacled male clad in a white coat with a wild hairstyle working indoors in a laboratory. This study examines the perceptions of Irish primary-age children about science. Moreover, the timing of this study provides the opportunity to explore the effect of large-scale world events, in this case, a global pandemic, on the perceptions of scientists. The following research questions guide the study:
How do science and gender-science stereotypes vary across ages?
How do science and gender-science stereotypes vary across gender?
What effect, if any, did COVID-19 have on perceptions of scientists and the work they do?
Method
Participants
Study participants were 194 primary school children. All children studied science as part of a national primary science curriculum. The curriculum explores a broad range of scientific concepts and ideas through the study of four strands: living things (myself, plants, and animals), energy and forces (light, sound, heat, magnetism and electricity, forces), materials (properties and characteristics of materials, materials and change), environmental awareness and care (caring for my locality). The science curriculum advocates an inquiry-based approach where children work scientifically by questioning, observing, predicting, investigating and experimenting, estimating and measuring, analysing and recording and communicating. It also recommends that opportunities be provided to engage in designing and making skills by exploring, planning, making, and evaluating (DES, Citation1999). There is some evidence of a lack of fidelity of curriculum implementation in primary science as reported by research revealing the overuse of teacher demonstration and explanation and inadequate use of child-led investigations, all of which provides obstacles for a rich and robust development of scientific knowledge and understandings (Murphy & Mancini-Samuelson, Citation2012; Roycroft, Citation2018).
Participants were from two co-educational primary schools, one rural and one urban, in south-western Ireland (see ). Both schools were convenience samples invited to participate as they had indicated their intent to carry out work in STEM education in the upcoming academic year. Parents and guardians of children in classes, representing the range of grade levels in each school, were provided with information and consent forms outlining the purpose of the study. Families in the rural school were predominantly white and native English speakers, whereas families in the urban school represented wide ethnic and cultural diversity and many of these children were English as an Additional Language (EAL) learners. We did not record, or analyse, the background characteristics of children. The appearance of the COVID-19 pandemic and the closure of schools in March 2020 interrupted data collection resulting in only 73% of the planned data collection being completed. Following the closure of schools, there was a noticeable increase in public tv programming for children, in addition to abundant science-related media coverage, that focused specifically on the work of scientists in the development of treatments and vaccines for COVID-19. Once schools returned to on-site education, under public health restrictions in Autumn 2020, we took the opportunity to reconnect with teachers and continue the remainder of the data collection to explore the possible impact of the pandemic on children’s perceptions of scientists and the work they do.
Table 1. Grade and age distribution of participants.
Procedure
All children completed the drawings at the same time in their own classrooms and were given approximately 15–20 min. They were asked to ‘draw a scientist doing their job’. This focus on their job facilitated attention to the scientist’s appearance, activity and working space. Several studies have indicated the benefit of requesting explanatory verbal information to accompany drawings (Barman, Citation1996, Citation1997; Chambers, Citation1983; Farland-Smith, Citation2012). Consequently, while the 4–6-year-olds in the junior classes were drawing, the teacher circulated amongst the children, asking them to describe their drawing and transcribed their responses. Teachers were aware of the importance of not influencing the drawings or descriptions and, when necessary, limited their questioning to the use of probes such as ‘tell me about your drawing’ or pointed to features of drawings and asked ‘tell me about this’. Older children were requested to provide a written description and/or label their drawing.
Instruments and coding
Two coding schemes were used to analyse the drawings. When analysing the drawings, the simplicity of many drawings led to challenges applying the DAST-C coding scheme. For example, due to the binary nature of the DAST-C coding scheme, when coding these drawings, the absence of stereotypical features and associated lower mean subscale score may inadvertently suggest less stereotyped views of scientists, when in fact, it was unclear from drawings and explanations if the children understood the concept of scientist at all. Consequently, it was decided to use an additional coding scheme, the modified DAST (mDAST), developed by Farland-Smith (Citation2012) to code the drawings of all age groups and thus identify those instances where aspects of the drawings did not facilitate DAST-C categorisation.
The DAST-C framework
This framework was used to determine the presence of the DAST-C indicators (Finson et al., Citation1995). A value of 0 or 1 was assigned to demonstrate the presence or absence of the specific indicator. In situations where the presence or absence of the indicator could not be established (for example, the gender of the scientist), a code of U (uncategorised) was applied. The first seven indicators matched those in the original version of the DAST – lab coats, eyeglasses, facial growth of hair, symbols of research (e.g. lab equipment), symbols of knowledge (e.g. books), technology (i.e. the products of science) and relevant captions (e.g. formulae). The final item in the DAST-C supports recording open comments and additional details about aspects of the drawings. Coding for this item focused on three areas: the scientist’s facial expressions, objects worn on the face (medical masks, safety goggles), and references to COVID19. Three scores were then generated from the DAST-C indicators: (1) the upper subscale score, ranging from 0 to 7, representing the sum of the traditional seven DAST-C indicators, (2) the lower subscale score, ranging from 0 to 7, determined from identifying the appearance of alternative DAST-C indicators, and (3) the total score DAST-C, which is the sum of the previous two categories and ranges from 0 to 14.
The refined mDAST rubric
The refined mDAST rubric (Farland-Smith, Citation2012) was also applied to the drawings. This instrument was chosen following an initial coding that revealed many drawings, particularly those of younger children, presented few stereotypical indicators. Rather than suggesting that the absence of indicators revealed non-stereotypical views of scientists, analysis of the drawings indicated a lack of understandings of a scientist or the work they do; this issue was also highlighted by Monhardt (Citation2003). The mDAST rubric supports accurate categorisation of these drawings focusing analysis on three aspects of drawings – appearance of the scientist (physical characteristics of the scientist), location (where the scientist works) and activity (the work the scientist is doing). Each aspect of the drawing was coded based on a continuum of ‘uncategorised’, ‘sensationalized’, ‘naïve or traditional’ and ‘broader than traditional’. It is the inclusion of ‘uncategorised’ in the coding scheme that supported the categorisation of drawings that had no stereotypic indicators and at the same time did not reveal any understanding of a scientist, thus ensuring accurate categorisation of these response types.
Analysis
Drawings were coded by one of the researchers, supported by five research assistants. A 90-minute training event was carried out where both coding schemes were explained, and sample drawings were coded and discussed. All drawings were labelled using a unique number; all identifiers were then removed from the drawing prior to coding. Consequently, coders were unaware of the name or gender of children and school being attended. One of the researchers then coded all drawings following the DAST-C protocol (as described by Finson et al., Citation1995) and the mDAST protocol (as described by Farland-Smith, Citation2012) and scores were input to a spreadsheet. The five research assistants were each given 20% of the drawings to code independently. Ten drawings from each research assistant (n = 50 altogether) were compared against the coding scheme of the primary researcher; coding and inter-rater reliabilities were determined to be between 0.93 and 0.98. All coders agreed that the indicator ‘Caucasian’ was difficult to discern due to variations in drawing and colouring techniques. Consequently, this indicator was removed from the analysis.
Descriptive statistics and a series of nonparametric tests (chi-square, Kruskal–Wallis and Mann Whitney) were used to analyse the data. Nonparametric tests were also used to examine differences in the three DAST-C sub-scores (upper, lower, combined) in relation to age and gender. The relationship between gender of the child and gender of the scientist drawn were also examined using nonparametric tests. Examination of the effect of COVID-19 was facilitated through the use of statistical analyses of comparable age/grade level groups based on time of administration of the DAST.
Findings
Research question 1: how do science and gender-science stereotypes vary across ages?
Insights from analysis of the DAST-C indicators
Firstly, drawings were analysed to identify the appearance of upper and lower subscale DAST-C indicators. summarises findings for the traditional stereotypes of scientists (upper subscale items), whereas displays findings for the alternative stereotypes of scientists (lower subscale items).
Table 2. Distribution of traditional (upper scale) DAST-C indicators by class level.
Table 3. Distribution of alternative (lower scale) DAST-C indicators by class level.
Junior–senior infants (4–6-year-olds). The most common stereotypical features present in drawings of the youngest children were scientists wearing eyeglasses (33%), working indoors (46%) using symbols of scientific research (46%), with some of them engaging in dangerous work involving smoke, fire, or explosions (17%) (see and ). No drawings had facial hair, and a small proportion had white coats (9%) and associated symbols of knowledge (8%), technology (6%) and lightbulbs (7%). That said, the drawings of glasses were often safety glasses rather than those associated with the bespectacled male white scientist. These safety glasses were larger than eyeglasses, had wider sides/temples, frequently had two temples on each side and had a wider section above the bridge of the nose. The notion of the mythic scientist was present in 10% of drawings; however, rather than being scary monstrous scientists as in studies from the last century, these characters were superheroes or crowned beings using magic wands to make bottles of colourful magic potions. In general, these 4–6-year-olds showed very positive dispositions towards scientists, evident in the number of smiling scientists (20%). In relation to the activity of scientists, many verbs were used to describe the work of scientists. Almost one-third of drawings referred to scientists ‘making’ and ‘mixing’ substances such as potions. Also common was the description of scientists exploding chemicals and potions. There were references, from 15% of 4–6-year-olds, to more scientific verbs describing scientists ‘testing’, ‘experimenting’, ‘writing’, ‘photographing’, ‘inventing’ and ‘using an activator’.
1st–3rd class (7–9-year-olds). The most common stereotypical features in this age group were males (50%) using symbols of scientific research (69%), working indoors (62%), wearing eyeglasses (41%) and lab coats (29%) with almost one quarter engaged in dangerous work (24%) (see and ). Similar to the younger children, many of the eyeglasses were safety goggles. Few had facial hair (5%), associated symbols of knowledge (5%) and technology (2%) and none had lightbulbs in their workspaces. Similar to the younger students, 10% were mythic scientists. Regarding the activity of scientists, 45% were ‘making’, ‘mixing’ or ‘pouring’ either potions (n = 8, 19%), chemicals (n = 8, 19%) or medicine (n = 2, 5%). References to potions remain, however, these older children made more references to ‘chemicals’ than younger participants. Similarly, mentions of exploding and explosions (n = 4; 10%) were common with reference to more scientific practices describing scientists experimenting (n = 3) and writing (n = 1) also evident. Whereas younger children drew magical and fairy-tale scientists, these slightly older children were more inclined to have smiling scientists with weird and spikey hair (n = 5; 12%) who tended to be more monstrous and engaged in dangerous work involving chemicals and fire.
5th and 6th class (10–12-year-olds). Older children demonstrated a greater proportion of stereotypical features in their drawings compared to their younger peers (see and ). Two-thirds of their drawings were of males (67%) wearing eye/safety glasses (56%) and lab coats (59%) and working indoors (73%) using a variety of research tools (74%) such as conical flasks, bunsen burners and beakers. There was a significant increase in symbols of knowledge (24%) that were predominantly books on bookshelves and pens peeking out of the pockets of lab coats. Similarly, symbols of technology (26%) featured more predominantly with mainly microscopes and some computers featured in drawings. There were similarities between these older students and their younger peers. Approximately 10% of drawings across all groups incorporated mythic stereotypes and these were mainly eccentric inventors in this oldest group. Similarly, symbols of danger were prevalent in almost one-quarter of drawings (23%) of these older students and were usually references to explosives, explosions, and electrocution.
Analysis of DAST-C subscale scores
The number of indicators per child increased with class level for both upper and lower subscales. For the upper subscale (), which measures traditional views of scientists, the number of indicators increased from a mean score of 1.05 for the 4–6-year-olds to 1.5 for 7–9-year-olds, culminating in a mean of 2.52 for 10–12-year-olds. No child included either 6 or 7 indicators, and only the 10–12-year-olds had drawings with five indicators. Over half of children aged 4–6 included none or only one of the upper scale indicators in their drawings.
Examination of the lower subscale (), which measures alternative views of scientists, reveals that the mean number of indicators also increased as children got older (1.03, 1.59, 1.86 respectively), with all age groups averaging less than two indicators per drawing. The indicator referring to ‘Caucasian’ was not included in the analysis due to concerns about the ability to discriminate, with accuracy, the presence of this indicator in drawings. Similar to the upper scale score, no one included all indicators and within the oldest group, only two drawings included five indicators, and four drawings included four indicators.
To determine potential differences between the three groups of children according to their age/grade level, Kruskal–Wallis tests were conducted on subscales. The results revealed a significant difference between the three groups of students’ upper subscale scores, H (2) = 37.61, p = .000 and lower subscale scores, H (2) = 18.67, p = .000.
Insights from analysis using the mDAST approach
As mentioned earlier, many of the drawings lacked detail. Whereas drawings with an associated description recorded by the teacher greatly supported coding; this contrasted to other drawings with fewer descriptions and explanations sometimes being limited to phrases such as ‘this is a scientist’. As a result, the modified DAST (mDAST) (Farland-Smith, Citation2012) was used to code all drawings. presents the outcomes of coding participants’ drawings based on the scientist’s appearance, location, and activity into one of four categories (uncategorised, sensationalised, naïve or traditional, broader than traditional).
Table 4. Analysis of drawings using the mDAST criteria (Farland-Smith, Citation2012).
Some of the drawings from children who had data collected during the COVID-19 pandemic revealed references to COVID-19 and the broader context of the pandemic. This was particularly evident when categorising the activity of scientists, predominantly in the 10–12-year-olds. After consultation between coders, we categorised practices that were correct scientific practices (as opposed to practices such as those involving magic) but that extended beyond lab-based chemistry as ‘broader than traditional’.
Junior-senior infants (4–6-year-olds). Regarding the appearance of scientists, 51% of drawings were not categorised predominantly due to the lack of clarity of features. 10% were sensationalised and consisted of mad scientists with spikey hair, superheroes, and princesses mixing potions. Drawings of men in lab coats accounted for the 15% categorised as naïve or traditional and the remaining 24% were categorised as beyond traditional. This latter group, constituting almost a quarter of the drawings, drew female scientists (). The location of scientists had a somewhat similar pattern with 54% uncategorised. The 5% of drawings that were sensationalised were superhero worlds and one underground danger-themed laboratory. One-third (33%) were traditional indoor laboratory settings with conical flasks, colourful chemicals and laboratory style worktables. Scientists working outdoors accounted for the remaining 8% of drawings that were coded as beyond traditional. Categorisation of the activity of scientists benefited greatly from the associated narratives describing the work of the scientists. The relatively high proportion of sensationalised drawings (32%) were due to references to explosions and potions. However, not all references to ‘potions’ were categorised as sensationalised – only those that were drawn with combinations of sensationalised-in-appearance scientists and with references to magic. Naïve and traditional conceptions of the work of scientists accounted for 14% of responses and the remaining 10% categorised as broader than traditional referred to scientists engaged in outdoor work (using telescopes and cameras) and engaged in research on vaccines for COVID-19.
1st–3rd class (7–9-year-olds). More detailed drawings and descriptions resulted in a reduction of the uncategorised drawings across all three categories for this age group, although this category still accounted for between a quarter and third of all drawings (). Traditional or naïve perspectives were the most frequent conceptualisation across all three categories (appearance, location, activity). With relation to appearance, it was interesting to note that the traditional/naïve (36%) and the ‘broader than traditional’ (33%) were most prominent and 7% were sensationalised. The benefit of the mDAST coding means that merely drawing a female figure wasn’t sufficient to indicate a challenge to stereotypes as some of the drawings of females were coded as ‘uncategorised’ as they appeared to be drawings of the children themselves rather than of scientists. The location of the scientist saw 55% in naïve or traditional locations, 5% were broader than traditional and 2% were sensationalised. The prominence of the naïve or traditional view was also evident in the activity of the scientist (41%), with sensationalised pictures accounting for 21% and the remaining 2% were broader than traditional.
5th and 6th class (10–12-year-olds). The drawings of older children were more detailed as were their written descriptions. Consequently, fewer drawing were classed as uncategorised (). Similar to their younger peers was the proportion of sensationalised drawings (12%, 4%, 27% across appearance, location, and activity). These usually depicted scientists as crazy inventors or evil scientists with wild hair, working in labs utilising colourful potions, metres of rubber tubing and intriguing machinery. The greatest change was the increase in categorisations of scientists as traditional or naïve especially in terms of their appearance and location. The proportion of female scientists informed the categorisation of appearance of scientists as ‘broader than traditional’ this remained steady across the three age groups (24%, 33%, 25%). The ‘broader than traditional’ category for location showed a small decrease across the age group (8%, 5%, 2%) reflecting the mirrored increased in traditional or naïve perceptions of location across age groups. The drawings that referred to scientists working in pharmaceutical and biomedical industry who were ‘researching vaccines’ ‘fighting covid’ and ‘making medicine’ contributed to drawings categorised as ‘broader than traditional’. These drawings featured predominantly with those children surveyed during the COVID-19 pandemic and are discussed further in this paper.
Research question 2: how do science and gender-science stereotypes vary across gender?
In order to answer this research question, we compared the frequency of stereotypic DAST-C indicators incorporated into the drawings made by boys and girls (). This revealed an increase in the mean number of indicators for both males (1.03, 1.9, and 2.16) and females (0.86, 1.13, 2.34) across respective age groups on the upper scale indicators. Review of the lower subscale score reveals a similar increase for females as they get older (0.72, 1.23, 1.56); however, 7–9-year-old males displayed more indicators than their 10–12-year-old peers (1.48, 2.0, 1.96). Also of note is that except for the upper scale indicators for the 10–12-year-olds, boys had a higher mean number of indicators than girls within all age groups.
Table 5. Distribution of traditional (upper scale), alternative (lower scale) and total DAST-C indicators by class level and gender.
In order to examine possible differences according to the gender of the children’s drawings, Mann–Whitney tests were conducted. The results of the analyses revealed no significant differences between boys and girls of all age groups for the upper subscale, U(NFEMALE = 87, NMALE = 72) = 3619.5.0, z = −1.69, p = .392, p = .09. However, boys drew significantly more alternative stereotypical images of scientists (lower subscale) (M Rank = 95.1) than girls (M Rank = 67.5), U = 4222.5, z = −3.77, p < .001. When comparing the total DAST-C scores, boys also created significantly more stereotypical images of scientists (M Rank = 92.9) than girls (M Rank = 69.3), U = 4062.0, z = −3.22, p < .001.
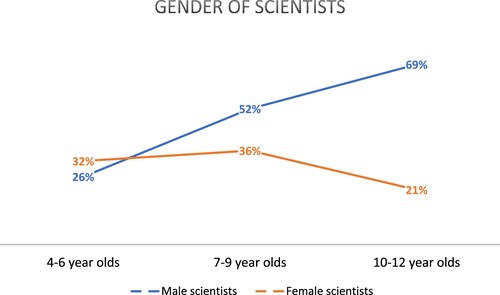
We were also interested in whether boys and girls differed in the gender of the scientist in their drawings. Our data revealed a steady increase in the drawings of male scientists and a subsequent decline in the proportion of female scientists drawn as children get older (see ). The 4–6-year-olds were the only group where the proportion of drawings of female scientists (32%) outnumbered male scientists (26%). By ages 7–9, the proportion of male scientists had doubled to 52%, and the drawings of female scientists stayed relatively steady at 36%. The drawings of the 10–12-year-olds suggest a further increase in the dominance of the male scientist stereotype with 69% of drawings representing male scientists and a decrease in the proportion of female scientists to 21% (the lowest of all age groups). However, this pattern should be treated with caution as, compared to their older counterparts, a larger proportion of 4–6-year-olds did not define the gender of scientists at all (see ). Consequently, we observed that older children not only identified more male scientists, they were also more likely to define the gender of the scientist.
Figure 1. Proportion of male and female scientists drawn across the age groups.
A chi-square test of independence was performed with regard to children’s age/class level and the gender of the scientist drawn. The result was statistically significant, X2 (2, (N = 120) = 8.81, p = .01), and Cramer’s coefficient (V = .27), suggesting a weak to moderate connection between the class level and the scientist’s gender in the drawing.
further disaggregates the data and sheds light on the relationship between the gender of those drawing the scientists and any gender stereotypes that may exist. Although examination of the relationship between the gender of the child creating the drawing and the gender of the scientist drawn reveals that the relationship between the variables was significant (P = .0001, Fisher’s exact test), further analysis reveals interesting trends when comparing class levels.
Figure 2. Proportion of male and female scientists drawn by boys and girls.
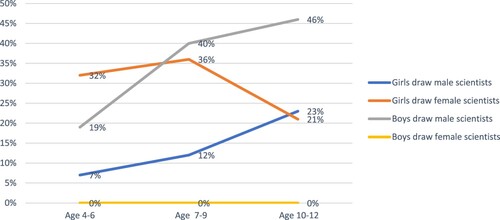
These data show the tendency for boys to draw same-gender scientists at all ages. In the 4-6-year-old group, where the proportion of female scientists outnumbered male scientists, boys drew only male scientists and girls were far more likely to draw female scientists (approximately 4 of 5 drawings) than male scientists (approximately 1 in 5 drawings). At age 7-9, again, boys exclusively drew male scientists and girls drew more female than male scientists. Of note, however, is that the proportion of females drawing male scientists had increased compared to their younger peers (from approximately 1 in 5 drawings to 1 in 4 drawings). It appears that the stereotype of the male scientist is beginning to gain greater traction for girls in the middle grades. By ages 10–12, the tendency of boys not to draw female scientists is firmly established. Notably, this group of 10–12-year-olds are the only female students in the data set that drew more male than female scientists, thus debunking the trend of drawing same-gender scientists for this age group.
Insights from analysis using the mDAST approach
The categorisations of the appearance, location and activity of scientists according to gender were then examined (see ). As expected, due to the tendency of females to draw female scientists, the appearance of scientists was categorised as ‘broader than traditional’ in a greater proportion of girls’ drawings (40%) compared to boys’ drawings (6%). The drawings of boys and girls were broadly similar in terms of the location of the scientist although a greater proportion of girls’ drawings were classified ‘broader than traditional’ (8%) than boys’ drawings (1.5%). The activity of scientists demonstrated different patterns of responses with more boys’ drawings classified as ‘sensationalised’, ‘traditional or naïve’ and ‘broader than traditional’; this may be due to the large proportion of girls’ drawings falling in to the ‘cannot be categorised’ category.
Table 6. Analysis of the drawings by boys and girls using the mDAST criteria.
Research question 3: what effect, if any, did COVID-19 have on perceptions of scientists and the work they do?
An unintended consequence of the COVID-19 pandemic was the interruption to our data collection due to school closures. Examination of data collected from one class of Senior Infants and one 4th class, collected during Ireland’s second wave when schools reopened, facilitates comparison with drawings from the same class levels in the same school collected before the pandemic (see ). It should be noted that this is a smaller subsample constituting 53 children (27%) of the total sample of 194.
Table 7. Comparison groups by study timing (before and during COVID19).
DAST-C analysis
Except for the lower scale indicators for the 4th class, drawings made during the COVID-19 pandemic were more stereotypical. Compared to drawings made before the pandemic, there was an increase in the mean number of (upper, lower and total) indicators for senior infants (+0.61, +0.52, +1.13) and 4th class (+0.81, −0.04, +0.85) made during the pandemic (see ). Mann–Whitney tests revealed a significant difference between total scale scores for senior infants pre-covid (M Rank = 19.7) and during-covid (M Rank = 28.9), U(NPRE = 28, NDURING = 21) = 183.5, z = 2.22, p < .001. This suggests a significant increase in the stereotypes of 4-6-year-old children during the pandemic. In contrast, while differences were evident between 4th class children pre-covid (M Rank = 24.9) and during-covid (M Rank = 31.8), U(NPRE = 30, NDURING = 25) = 469.5, z = −1.59, p = 0.055 these differences were not statistically significant.
Table 8. Distribution of DAST-C indicators prior to and post-COVID.
mDAST analysis
Categorisations of the appearance, location and activity (Farland-Smith, Citation2012) of the scientists at work that were drawn pre-covid (n = 51) and during covid (n = 53) were compared. Examination of reveals a decrease in the proportion of ‘uncategorised’ drawings depicting the appearance and location of scientists made during the pandemic. The smallest decrease in ‘uncategorised’ drawings was observed for the activity classification; however, this also revealed the largest increase in ‘broader than traditional’ conceptualisations. This suggests greater understanding of a scientist and the work they do due to the pandemic, albeit that some drawings depicted sensationalised and traditional images.
Table 9. Analysis of drawings using the mDAST criteria (before and during COVID19) on children from Senior Infants (age 4–6) and Fourth class (age 9–10).
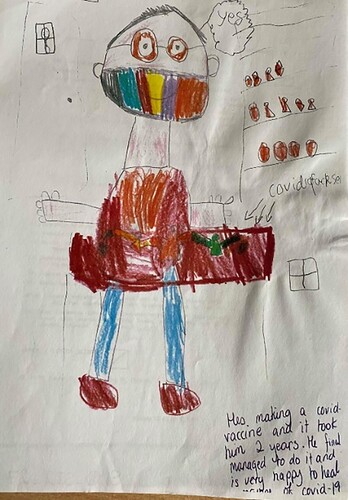
The influence of the pandemic on younger children's images of scientists was very evident in some drawings. Most discernable was the appearance of facemasks in almost one-third of drawings of senior infants (n = 9) during the pandemic (compared to zero facemasks before the pandemic). In relation to the activity of scientists, almost one-quarter of senior infants (n = 7) who completed their drawing during the pandemic mentioned vaccines, viruses, and covid-19. Trust in the benevolence of scientists was evident in the use of the term ‘good’ (n = 5) to refer to scientists and their work. Pandemic-related practices and behaviours were evident in descriptions of scientists in the drawings as ‘sneezing and having to wash his hands’ (child #115) and ‘she is writing because she is sick. She has to wear a mask’ (child #119). is an example of a drawing made by a 6-year-old during the pandemic, and it contains many of the features associated with during-pandemic images.
Figure 3. Drawing of a scientist made by a 6-year-old child (senior Infants) during the pandemic (with handwritten transciption made by the teacher of the child’s description).
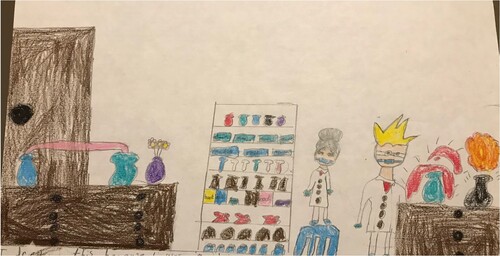
The influence of the pandemic was also evident in the drawings and descriptions provided by older children, particularly in relation to the activity of scientists. Ten drawings, similar to that presented in , depicted scientists at work ‘looking for cures for diseases’, ‘researching vaccines’, ‘fighting covid’ and ‘making medicine’. The drawing of the 4th class student in depicts masked male and female scientists and came accompanied by the following description:
These scientists are doing experiments in the science lab. They are working on a cure for diseases and for defeating covid-19. They haven’t found it yet.
Figure 4. Drawing of a scientist made by a ten-year-old (4th class) child during the pandemic.
Discussions and conclusion
The findings of this study provide insights into children’s perceptions of a scientist, facilitating the researchers to draw parallels and highlight differences between the study findings and previous studies and explore the impact of the COVID-19 pandemic on perceptions of scientists and their work.
When we explore general trends in responses to the DAST and use the Farland-Smith (Citation2012) mDAST rubric as an interpretive lens (), we see that it was not possible to categorise approximately half of the drawings of 4–6-year-olds, a quarter of 7–9-year-olds, and over one-tenth of 10–12-year-olds. For the younger children, this was predominantly due to poorer graphic skills and motor abilities. Similar to Losh et al. (Citation2008), we found that the drawings of some older children were no more detailed than their younger counterparts (determined based on the proportion of uncategorised drawings of the 10–12-year-olds). Whereas the proportion of drawings depicting ‘traditional or naïve’ perceptions of scientists was notable and increased with age, thus affirming many previous studies (Chambers, Citation1983; Finson et al., Citation1995; Fung, Citation2002; Özel, Citation2012); the smaller yet pronounced number of drawings categorised as ‘broader than traditional’ suggests greater diversity in children’s depictions of scientists than previous literature would suggest. Similar to the findings of Quílez-Cervero et al. (Citation2021), the categories ‘broader than traditional’ and ‘sensationalised’ provided greater granularity when coding the drawings and facilitated the observation and subsequent categorisations of new and emerging notions of scientists, i.e. scientists as responders in a pandemic.
Coding the drawings using the DAST-C (Finson et al., Citation1995) shed light on the development of perceptions of scientists as children advance through primary school. Again, taking a larger grain size in our analysis, and remaining mindful that there was a total of 14 indicators (a maximum total score of 14), suggested by Chambers (Citation1983) and Finson et al. (Citation1995); examination of the mean number of stereotypic indicators represented in the drawings of all three age groups reveals that the occurrence of specific stereotypes was relatively low (2.08 at 4–6 years, 3.09 at 7–9 years and 4.38 at 10–12 years). These findings are similar to those reported in the original study by Chambers (Citation1983), except for the youngest group in our study, which recorded more indicators. This pattern may be attributable to the influence of living during the COVID-19 pandemic. Given these low mean scores, it is important to note that many drawings presented scientists as younger adults wearing everyday clothes and with no facial hair or glasses, thus supporting recent studies by Emvalotis and Koutsianou (Citation2018) and Hillman et al. (Citation2014).
More specific patterns and trends are revealed when we examine, in greater depth, the pattern of distribution of stereotypical indicators across gender and age groups. The increase in the mean number of indicators displayed in drawings as children progressed through class levels suggests that stereotypical indicators associated with scientists increase with age. Specifically, the most pervasive stereotypes, which are evident as early as ages 4–6 and remain omnipresent across all age groups, were of bespectacled scientists working indoors, using various symbols of research to do work that involves some element of danger. Of note, however, is that the danger appeared to be associated with excitement rather than perceptions of fear or threat, as indicated by the prevalence of smiling scientists; these positive dispositions towards scientists support the findings of Özel (Citation2012) and Blagdanic et al. (Citation2019). Emerging at ages 7–9 was the added perception of the scientist being male and wearing a lab coat. By ages 10–12, these coated males came equipped with scientific symbols of knowledge and technology, perhaps reflecting more formal experiences of the science curriculum in the later school years and greater exposure to media portrayal of scientists.
Our findings also reinforce the outcomes of previous studies in relation to specific stereotypical indicators. Same gender preference evidenced in the tendency of girls to draw female scientists, and boys to draw male scientists, was a finding common to many other studies (Chambers, Citation1983; Farland-Smith, Citation2012; Fort & Varney, Citation1989; Laubach et al., Citation2012; Losh et al., Citation2008; Quílez-Cervero et al., Citation2021). The decrease in the tendency of older girls to draw female scientists was evident in studies reporting findings of greater representation of images of female scientists by younger children (Barman, Citation1997) with an increase in appearance of more male scientists in the drawings after the age of eight years (Miller et al., Citation2018). Similar to other studies, boys in our study were more likely to depict gender stereotypes (Blagdanic et al., Citation2019) and stereotypical images (Emvalotis & Koutsianou, Citation2018) about scientists than girls. The fact that in our study, no boy drew a female scientist could lead one to surmise that boys hold more entrenched gender stereotypes. However, there is a small and somewhat encouraging caveat, and that relates to the small number of drawings made by boys that represented two scientists, one male and one female (only 4 in our study); this same low incidence was evident in Fung’s (Citation2002) study where 1.9% of drawings represented two scientists – one male and one female – and in studies reported by Losh et al. (Citation2008) revealing that more female scientists are drawn when participants are asked to draw several pictures. This may reaffirm the finding that children draw the same gender drawing first (boys draw males) and there is openness to drawing female scientists in subsequent drawings. Their drawings may well reflect aspects of their own personal and gender identity. Thus, they draw ‘someone like me’, in this case, a boy doing science. However, it does not explain why as girls get older, they do not continue to draw ‘someone like me’. One suggestion is that, as boys get older, they are more likely to continue to project themselves into whatever they are asked to represent. Consequently, we caution against the interpretation of boys drawing male scientists as a stereotyped perspective. Moreover, studies that asked children explicitly whether females can be scientists (Blagdanic et al., Citation2019; Hillman et al., Citation2014) do not report any statistical differences in the views of males and females. More concerning in our study and others, however, is the reduction in drawings that girls make of female scientists as they get older. This trend is not contiguous with the increased representation of female scientists in the media, school texts, and in Irish society in general.
Similar to other studies (Emvalotis & Koutsianou, Citation2018; Milford & Tippett, Citation2013), drawings did not provide sufficient information on the ethnicity of the scientist; consequently, this indicator was excluded from our analysis. Another commonality, defined by their absence, was the low number of drawings depicting scientists as middle-aged or old (Emvalotis & Koutsianou, Citation2018; Hillman et al., Citation2014; McCarthy, Citation2015) or as fictional characters (Barman, Citation1997). Our findings support other studies demonstrating low incidences of lightbulbs (Barman, Citation1997), indications of secrecy (Barman 1997; Finson, Citation2002; Hillman et al., Citation2014; Laubach et al., Citation2012; McCarthy, Citation2015), and containing captions (Fung, Citation2002). Whereas our study had fewer drawings depicting scientists with facial hair, contrasting to older studies (Fung, Citation2002), but similar to more recent studies (Emvalotis & Koutsianou, Citation2018; Hillman et al., Citation2014; McCarthy, Citation2015), there were frequent references to scientists having fuzzy, curly, spikey and weird hair. This finding supports the thesis proposed by Rubin et al. (Citation2003) that the inclusion of facial hair may be a culturally based phenomenon.
Analysis of the work of scientists depicted in drawings supported other research findings that indicated a focus on scientists ‘doing’ science rather than taking notes or reading books (Barman, Citation1997), thus suggesting that children have an empiricist view of scientists (Matthews, Citation1996). Similar to studies by Fung (Citation2002) and Barman (Citation1997), most drawings depicted scientists as realistic rather than fictional people. Nonetheless, similar to other studies, approximately 10% of drawings across all our groups incorporated mythical stereotypes. However, the nature of these mythical stereotypes changed from magical entities in the early years (incorporating female scientists wearing crowns, scientist superheroes, and references to magic) to monster types (Frankenstein and mummies) in the 7–9-year-olds and then on to eccentric inventors by ages 10–12. This was mirrored somewhat by the details associated with the symbols of research, glassware such as beakers and conical flasks, which tended as children got younger to be filled with colourful potions. This leads us to agree with a conclusion posited by Losh et al. (Citation2008) that the appearance of mythic stereotypes suggests that these children hold positive rather than negative images of scientists.
Another contribution of our study was exchanging traditional stereotypical spectacles in drawings for safety glasses; this was most likely influenced by school safety protocols and the requirement to wear safety goggles when doing science. Examination of the descriptions and narratives provided with drawings suggest the strong influence of the media (cartoons, books, tv shows, and movies) in shaping stereotypical perceptions of the appearance and work of scientists, thus supporting the findings of Long et al. (Citation2010) and Steinke et al. (Citation2007). This media influence may play a role in the relatively large proportion of scientists in our studies and some others (Hillman et al., Citation2014) who engaged in dangerous work.
A unique contribution of our study is the influence of the broader societal context, specifically references to the COVID-19 pandemic in drawings depicting the type of work that scientists do. A superficial reading of our findings reporting noticeable increases in the appearance of stereotypical indicators during COVID-19 might imply that the pandemic further embedded stereotypical notions of scientists. However, when considered in light of analysis of the modified mDAST rubric (Farland-Smith, Citation2012), a different picture emerges. There is a reduction in the proportion of children who demonstrate an absence of understanding of scientists and the work they do. Instead, images depict more relevant and somewhat stereotypical, views especially of the appearance and location of scientists. Similar to the finding of Quílez-Cervero et al. (Citation2021) was the increased awareness and appreciation of the activity of scientists, work categorised as ‘broader than traditional’, in particular research activity concerning pandemic-related vaccine research. It may be surmised that the increased focus on the role of scientists in both educational and home contexts alongside increased media representation of scientists, especially in relation to vaccine development, may have attuned children to this particular role of scientists.
In conclusion, this study provides valuable insights into children’s changing understanding of scientists and the work they do. The drawings suggest a better-informed youth who at an earlier age have more realistic, if somewhat traditional understandings, who perceive scientists as engaging in ‘good’ work that addresses societal challenges such as global pandemics. These data, collected from a diverse group of young children, which show smiling and benevolent scientists show positive signs of potentially productive STEM identities. However, the falloff in drawings of female scientists, in particular by females as they get older, poses concerns for the science-career aspirations of females and their ability to associate themselves with these careers.
There are limitations associated with our study. We were very conservative when analysing the drawings, and when unsure of the presence of an indicator, we always coded it as uncategorised. Consequently, in situations such as gender where many figures were stick figures or looked androgynous, we coded them as uncategorised. Thus, there may have been the propensity to underestimate the presence of some indicators. We agree with Losh et al. (Citation2008) that the simple prompt ‘Draw a scientist’ – may elicit a perceived public caricature and not a personal belief or perception. This is especially true of older children who drew highly stylised drawings that, on further analysis, implied rich understandings of scientific phenomenon as opposed to simple and stereotypical understandings of the work that scientists do. We cannot dismiss the possibility that the DAST task may encourage children to incorporate prevailing stereotypes and prejudices about scientists into the drawing, perceptions that they may not hold themselves. We also acknowledge the threat to the validity of interpretations arising from only single drawings of scientists (Losh et al., Citation2008; Reinisch et al., Citation2017). Consequently, rather than ask children to draw ‘a scientist’, thus emphasising that there is one predominant type of scientist and perhaps encouraging a focus on the ‘typical’ stereotype, we suggest that future studies ask children to ‘draw some scientists’ and examine whether non-stereotypical images emerge. Also, we had a small sample of drawings made following the pandemic (27% of all drawings) on which to base our comparisons of the effect of COVID-19 on children’s perceptions of scientists and the work they do. Finally, there are limitations relating to child characteristics and how they may have impacted the drawings (for example, motor skills) and descriptions (for example, verbal skills and English language proficiency) of those drawings. We recognise the added benefit derived from the use of descriptions and associated narratives during our analysis and consequently recommend the collection of information supplementary to the drawings.
Acknowledgements
The study received ethics approval from the college research ethics body (MIREC Reference A19-051). The study met all ethics requirements of the institution at the time the data were collected. Throughout the research process, all ethical obligations were adhered to with relation to informed voluntary consent. Efforts to safeguard the privacy and confidentiality of participants were made through the anonymisation of all data at both the school and individual level.
Disclosure statement
No potential conflict of interest was reported by the author(s).
References
- Barman, C. (1996). Do students really view science and scientists? Science and Children, 34(1), 30–33.
- Barman, C. (1997). Students’ views of scientists and science: Results from a national study. Science and Children, 35(1), 18–23.
- Blagdanic, S., Kadijevic, G. M., & Kovacevic, Z. (2019). Gender stereotypes in preschoolers’ image of scientists. European Early Childhood Education Research Journal, 27(2), 272–284. https://doi.org/10.1080/1350293X.2019.1579551
- Bodzin, A., & Gehringer, M. (2001). Breaking science stereotypes. Science and Children, 39, 36–41.
- Buldu, M. (2006). Young children’s perceptions of scientists: A preliminary study. Educational Research, 48(1), 121–132. https://doi.org/10.1080/00131880500498602
- Cannady, M. A., Greenwald, E., & Harris, K. N. (2014). Problematizing the STEM pipeline metaphor: Is the STEM pipeline metaphor serving our students and the STEM workforce? Science Education, 98(3), 443–460. https://doi.org/10.1002/sce.21108
- Central Statistics Office. (2020). Measuring Ireland’s Progress 2020. Retrieved February 5, 2023. https://www.cso.ie/en/releasesandpublications/ep/p- mip/measuringirelandsprogress2020/education/
- Chambers, D. (1983). Stereotypic images of the scientist: The Draw-a-Scientist Test. Science Education, 67(2), 255–265. https://doi.org/10.1002/sce.3730670213
- De Jong, S. P. L., Ketting, E., & van Drooge, L. (2020). Highly esteemed science: An analysis of attitudes towards and perceived attributes of science in letters to the editor in two Dutch newspapers. Public Understanding of Science, 29(1), 37–52. https://doi.org/10.1177/0963662519878988
- Department for Business, Energy and Industrial Strategy. (2019). Public attitudes to science 2019. Main Report. https://www.gov.uk/government/publications/public-attitudes-to-science-2019
- De Roock, R. S., & Baildon, M. (2019). Myskillsfuture for students, STEM learning, and the design of neoliberal citizenship in Singapore. Cognition and Instruction, 37(3), 285–305. https://doi.org/10.1080/07370008.2019.1624545
- DES (Department of Education and Science). (1999). Primary school curriculum: Introduction. Dublin: DES. https://www.curriculumonline.ie/getmedia/93de2707-f25e-4bee-9035-92b00613492e/Introduction-to-primary-curriculum.pdf
- Dickson, J. M., Conway, F. S., & Finch, A. J. (1990). Personality factors, family structure, and sex of drawn figure on the Draw-A-Person Test. Journal of Personality Assessment, 55(1-2), 362–366. https://doi.org/10.1080/00223891.1990.9674073
- Emvalotis, A., & Koutsianou, A. (2018). Greek primary school students’ images of scientists and their work: Has anything changed? Research in Science & Technological Education, 36(1), 69–85. https://doi.org/10.1080/02635143.2017.1366899
- Farland-Smith, D. (2012). Development and field test of the modified draw-a-scientist test and the draw-a-scientist rubric. School Science and Mathematics, 112(2), 109–116. https://doi.org/10.1111/j.1949-8594.2011.00124.x
- Finson, K. D. (2002). Drawing a scientist: What we do and do not know after fifty years of drawings. School Science and Mathematics, 102(7), 335–346. https://doi.org/10.1111/j.1949-8594.2002.tb18217.x
- Finson, K. D., Beaver, J. B., & Cramond, B. L. (1995). Development and field test of a checklist for the Draw-a-Scientist Test. School Science and Mathematics, 95(4), 195–205. https://doi.org/10.1111/j.1949-8594.1995.tb15762.x
- Flick, L. (1990). Scientist in residence program improving children’s image of science and scientists. School Science and Mathematics, 90(3), 204–214. https://doi.org/10.1111/j.1949-8594.1990.tb15536.x
- Fort, D. C., & Varney, H. L. (1989). How students see scientists: Mostly male, mostly white, and mostly benevolent. Science and Children, 26(8), 8–13.
- Fung, Y. V. H. (2002). A comparative study of primary and secondary school students’ images of scientists. Research in Science & Technological Education, 20(2), 199–213. https://doi.org/10.1080/0263514022000030453
- Gardner, H. (1980). Artful scribbles. Basic books.
- Goos, M., Ryan, V., Lane, C., Leahy, K., Walsh, G., O’Connell, T., O’Donoghue, J., & Nizar, A. (2020). Review of literature to identify a set of effective interventions for addressing gender balance in STEM in early years, primary and post-primary education settings. Department of Education. https://www.education.ie/en/Publications/Education-Reports/review-of-literature-to-identify-a-set-of-effective-interventions-for-addressing-gender-balance-in-stem.pdf
- Government of Ireland. (2015). Ireland’s national skills strategy 2025. Department of Education and Skills.
- Government of Ireland. (2017a). STEM education implementation plan 2017–2019. Stationary Office.
- Government of Ireland. (2017b). STEM education policy statement 2017–2026. Stationary Office.
- Hillman, S. J., Bloodsworth, K. H., Tilburg, C. E., Zeeman, S. I., & List, H. E. (2014). K-12 students’ perceptions of scientists: Finding a valid measurement and exploring whether exposure to scientists makes an impact. International Journal of Science Education, 36(15), 2580–2595. https://doi.org/10.1080/09500693.2014.908264
- Hourigan, M, O’Dwyer, A., Leavy, A. M., & Corry, E. (2022). Integrated STEM – a step too far in primary education contexts?. Irish Educational Studies, 41(4), 687–711. http://doi.org/10.1080/03323315.2021.1899027
- Jones, L. K., & Hite, R. L. (2020). Who wants to be a scientist in South Korea: Assessing role model influences on Korean students’ perceptions of science and scientists. International Journal of Science Education, 42(16), 2674–2695. https://doi.org/10.1080/09500693.2020.1829158
- Koren, P., & Bar, V. (2009). Pupils’ image of ‘the scientist’ among two communities in Israel: A comparative study. International Journal of Science Education, 31(18), 2485–2509. https://doi.org/10.1080/09500690802449375
- Laubach, T. A., Crofford, G. D., & Marek, E. A. (2012). Exploring native American students’ perceptions of scientists. International Journal of Science Education, 34(11), 1769–1794. https://doi.org/10.1080/09500693.2012.689434
- Long, M., Steinke, J., Applegate, B., Lapinski, M. K., Johnson, M. J., & Ghosh, S. (2010). Portrayals of male and female scientists in television programs popular among middle school-age children. Science Communication, 32(3), 356–382. https://doi.org/10.1177/1075547009357779
- Losh, S. C., Wilke, R., & Pop, M. (2008). Some methodological issues with “draw a scientist tests” among young children. International Journal of Science Education, 30(6), 773–792. https://doi.org/10.1080/09500690701250452
- Mason, C. L., Kahle, J. B., & Gardner, A. L. (1991). Draw-A-Scientist Test: Future implications. School Science and Mathematics, 91(5), 193–198. https://doi.org/10.1111/j.1949-8594.1991.tb12078.x
- Matthews, B. (1996). Drawing scientists. Gender and Education, 8(2), 231–244. https://doi.org/10.1080/09540259650038888
- McCarthy, D. (2015). Teacher candidates’ perceptions of scientists: Images and attributes. Educational Review, 67(4), 389–413. https://doi.org/10.1080/00131911.2014.974510
- Mead, M., & Métraux, R. (1957). Image of the scientist among high-school students. A pilot study. Science, 126(3270), 384–390. https://doi.org/10.1126/science.126.3270.384
- Meyer, C., Guenther, L., & Joubert, M. (2019). The Draw-a- Scientist Test in an African context: Comparing students’ (stereotypical) images of scientists across university faculties. Research in Science & Technological Education, 37(1), 1–14. https://doi.org/10.1080/02635143.2018.1447455
- Milford, T. M., & Tippett, C. D. (2013). Preservice teachers’ images of scientists: Do prior science experiences make a difference? Journal of Science Teacher Education, 24(4), 745–762. https://doi.org/10.1007/s10972-012-9304-1
- Miller, C. (2001). Hybrid management: Boundary organizations, science policy, and environmental governance in the climate regime. Science, Technology, & Human Values, 26(4), 478–500. https://doi.org/10.1177/016224390102600405
- Miller, D. I., Nolla, K. M., Eagly, A. H., & Uttal, D. H. (2018). The development of children’s gender-science stereotypes: A meta-analysis of 5 decades of U.S. Draw-A-Scientist Studies. Child Development, 89(6), 1943–1955. https://doi.org/10.1111/cdev.13039
- Millstone, E., & van Zwanenberg, P. (2000). A crisis of trust: For science, scientists or for institutions? Nature Medicine, 6(12), 1307–1308. https://doi.org/10.1038/82102
- Monhardt, R. M. (2003). The image of the scientist through the eyes of Navajo children. Journal of American Indian Education, 42(3), 25–39.
- Murphy, T. P., & Mancini-Samuelson, G. J. (2012). Graduating STEM competent and confident teachers: The creation of a STEM certificate for elementary education majors. Journal of College Science Teaching, 42(2), 18–23.
- National Council of Curriculum and Assessment. (2023a). Draft primary curriculum framework. For consultation. https://www.curriculumonline.ie/getmedia/84747851-0581-431b-b4d7-dc6ee850883e/2023-Primary-Framework-ENG-screen.pdf
- National Council of Curriculum and Assessment. (2023b). Primary curriculum framework for primary and special schools. https://www.curriculumonline.ie/getmedia/84747851-0581-431b-b4d7-dc6ee850883e/2023-Primary-Framework-ENG-screen.pdf.
- O’Dwyer, A., Hourigan, M., Leavy, A. M., & Corry, E. (2023). 'I have seen STEM in action and it's quite do-able!' The impact of an extended professional development model on teacher-efficacy in STEM education. International Journal of Science and Mathematics Education, 23, 112. http://doi.org/10.1007/s10763-023-10361-2
- Özel, M. (2012). Children’s images of scientists: Does grade level make a difference? Educational Sciences: Theory & Practice, 12(4), 3187–3198.
- Philip, T. M., Bang, M., & Jackson, K. (2018). Articulating the “how,” the “for what,” the “for whom,” and the “with whom” in concert: A call to broaden the benchmarks of our scholarship. Cognition and Instruction, 36(2), 83–88. https://doi.org/10.1080/07370008.2018.1413530
- Quílez-Cervero, C., Diez-Ojeda, M., López Gallego, A. A., & Queiruga-Dios, MÁ. (2021). Has the stereotype of the scientist changed in early primary school–aged students due to COVID-19? Education Science, 11(7), 365. https://doi.org/10.3390/educsci11070365
- Reinisch, B., Krell, M., Hergert, S., Gogolin, S., & Krüger, D. (2017). Methodical challenges concerning the Draw-A-Scientist Test: A critical view about the assessment and evaluation of learners’ conceptions of scientists. International Journal of Science Education, 39(14), 1952–1975. https://doi.org/10.1080/09500693.2017.1362712
- Roycroft, H. (2018). STEM learning in Ireland: An evaluation of an innovative primary science learning initiative from the students’ perspective. Irish Teachers’ Journal, 6(1), 73–99.
- Rubin, E., Bar, V., & Cohen, A. (2003). The images of scientists and science among Hebrew- and Arabic-speaking preservice teachers in Israel. International Journal of Science Education, 25(7), 821–846. https://doi.org/10.1080/09500690305028
- Sadker, M., & Sadker, D. (1996). Failing at fairness: How America’s schools cheat girls. Maxwell macmillan internationnal.
- Samaras, G., Bonoti, F., & Christidou, V. (2012). Exploring children’s perceptions of scientist through drawings and interviews. Procedia – Social and Behavioral Sciences, 46, 1541–1546. https://doi.org/10.1016/j.sbspro.2012.05.337
- Schibeci, R. A. (1989). Home, school, and peer group influences on student attitudes and achievement in science. Science Education, 73(1), 13–24. https://doi.org/10.1002/sce.3730730103
- Schibeci, R. A., & Sorenson, I. (1983). Elementary school children’s perceptions of scientists. School Science and Mathematics, 83(1), 14–19. https://doi.org/10.1111/j.1949-8594.1983.tb10087.x
- Science Foundation Ireland. (2020). SFI science in Ireland barometer: Research report. https://www.sfi.ie/engagement/barometer/
- Steinke, J., Lapinski, M. K., Crocker, N., Zietsman-Thomas, A., Williams, Y., Evergreen, S. H., & Kuchibhotla, S. (2007). Assessing media influences on middle school-aged children’s perceptions of women in science using the Draw-A-Scientist Test (DAST). Science Communication, 29(1), 35–64. https://doi.org/10.1177/1075547007306508
- Vakil, S. (2018). Ethics, identity, and political vision: Toward a justice-centered approach to equity in computer science education. Harvard Educational Review, 88(1), 26–52. https://doi.org/10.17763/1943-5045-88.1.26
- Wellcome Global Monitor. (2018). https://wellcome.org/reports/wellcome-global-monitor/2018