
 ?Mathematical formulae have been encoded as MathML and are displayed in this HTML version using MathJax in order to improve their display. Uncheck the box to turn MathJax off. This feature requires Javascript. Click on a formula to zoom.
ABSTRACT
Educational reform priorities such as emphasis on quantitative modelling (QM) have positioned undergraduate biology instructors as designers of QM experiences to engage students in authentic science practices that support the development of data-driven and evidence-based reasoning. Yet, little is known about how biology instructors adapt to the pedagogical movement towards incorporating QM opportunities for students in the courses they teach. This study presents the development of the Quantitative Modelling Observation Protocol (QMOP), a classroom observation instrument designed to support the need to characterise various approaches that instructors use to implement QM instruction in undergraduate biology. QMOP provides information about the breadth and depth of QM implementation across three dimensions – authentic instruction, teaching for understanding, and quantitative approach to teaching biology. We present an interpretive argument, the chain of assumptions we made in relation to the intended use of the instrument, and evidence to assess the validity of our assumptions and inferences about observation scores generated using the instrument. Strengths and weaknesses of evidence pertaining to assumptions about scoring, generalisability, extrapolation, and implications will be discussed to build a validity argument for observations and demonstrate how the instrument can be used for investigating QM instruction in undergraduate biology courses.
Introduction
Education reform efforts in science, technology, engineering, and mathematics (STEM) have frequently advocated for a greater emphasis on modelling and quantitative reasoning (AAAS, Citation2011; AAMC & HHMI, Citation2009; Garfunkel & Montgomery, Citation2016; NGSS Lead States, Citation2013; OECD, Citation2019). In the field of biology, there is a marked growth of both experimental data relating to complex global and molecular level problems, and relatively inexpensive technologies or software that support data analysis, simulation, and modelling (Campbell et al., Citation2015; Chen et al., Citation2018).
Because quantitative models have taken on a key role in biology, national reports and undergraduate biology education research recommend and call for examples of integrating modelling practices to enable students to mathematically relate model components and depict biological system dynamics (AAAS, Citation2011; Eaton et al., Citation2020; Mayes et al., Citation2014). A recent study found international experts in STEM disciplines similarly describe modelling and authentic assessment as cornerstones for interdisciplinary research and teaching (Hallstrom et al., Citation2023). Data-driven modelling and learning in biology has spurred a growing body of research focusing on engaging biology students in authentic science practices, such as the modelling process, with the goal of supporting students to generate scientific explanations about natural phenomena (Hester et al., Citation2018; Louca & Zacharia, Citation2019; Schuchardt & Schunn, Citation2016). Biology instruction therefore necessitates educators to intentionally design teaching approaches to include crucial quantitative features that support learning of biological concepts and complex biological systems.
We define Quantitative Modelling (QM) as the creation of representations to explain phenomena and the revision of models to fit reality (Mayes et al., Citation2014). Modelling is at the heart of biology research (Cvijovic et al., Citation2016; Ingalls, Citation2013; Schuchardt & Schunn, Citation2016; Schwarz et al., Citation2009; Svoboda & Passmore, Citation2013) and QM requires quantitative reasoning. The Vision and Change report (AAAS, Citation2011) considers quantitative reasoning and modelling as two separate core competences. While modelling can take on both qualitative and quantitative forms, our focus is on quantitative reasoning based on a framework developed by Mayes et al. (Citation2014) and expanded to describe quantitative modelling by Dauer et al. (Citation2021). In quantitative modelling, modelling is supported by quantifying variables and quantitative interpretation of the model to make predictions (Mayes et al., Citation2019), and includes the construction, revision, and use of quantitative models to understand biological phenomena.
While the relevance of QM is widely accepted in the STEM community, a systematic way of documenting the fidelity by which instructors implement quantitative biology instruction is lacking and needed (Aikens & Dolan, Citation2014; Donovan et al., Citation2015; Eaton et al., Citation2020; Follette et al., Citation2017; Hester et al., Citation2018; Hurney et al., Citation2011; Mayes et al., Citation2019). Undergraduate biology instructors’ practices that incorporate QM into their courses may vary in a spectrum that ranges from infrequent to frequent integration of mathematics in biology. Targeting the population of faculty who use QM in teaching biology can address the paucity of research describing QM practices and examples of instructional activities. Moreover, research instruments that measure the degree of implementation of QM in biology need to be developed to set the groundwork for studying how QM is integrated in biology courses (Goldey et al., Citation2012; Hoffman et al., Citation2016).
Observations of teaching practice are directly measured with the use of classroom observation protocols designed for gathering and classifying observational data regarding what instructors are doing. To examine teaching methods, many classrooms observation protocols have been developed for evolving educational contexts, including the Reformed Teaching Observation Protocol (RTOP, Piburn et al., Citation2000; Sawada et al., Citation2002), Teaching Dimensions Observation Protocol (Hora et al., Citation2013), Classroom Observation Protocol in Undergraduate STEM (Smith et al., Citation2013), and the Measurement Instrument for Scientific Teaching (Durham et al., Citation2017), that are widely used in higher education research. However, these instruments lack the specificity needed to describe how biology instructors are implementing QM in their courses, particularly the interdisciplinary strategies that differentiate instructors who emphasise quantitative reasoning in learning biological concepts (Neitzel et al., Citation2022).
To address the need to characterise QM instruction in undergraduate biology, we developed a classroom observation protocol to capture a range of QM practices in conjunction with pedagogical strategies prioritised in educational reform efforts. Our effort differs from two recent efforts to develop and validate modelling observation protocols (Baumfalk et al., Citation2019; Shi et al., Citation2021). In both cases, the singular focus was modelling while our protocol targets quantitative modelling that promotes quantitative reasoning in biology. Shi et al. (Citation2021) focused on high school chemistry modelling-based teaching and the model discussion was centred on qualitative models, not quantitative models. Our Quantitative Modelling Observation Protocol (QMOP) instrument focuses on quantitative modelling, but the instrument includes the necessary pre-modelling quantitative tasks of quantitative acts and quantitative interpretation, as well as meta-modelling. In this study, we describe the steps and decisions that occurred during the development phase and present evidence for the reliability and validity of the data collected with the QMOP instrument. Across the development process, this study was guided by two research questions:
(1) What evidence supports the validity of the data collected with the QMOP?
(2) How can the QMOP be used to characterize QM instruction in undergraduate biology?
Quantitative modelling in biology and its hypothesised dimensions
The theoretical framework for the development of the QMOP draws from the literature on authentic instruction, teaching for understanding, and quantitative reasoning applied to undergraduate biology instruction. Because QM instruction attends to educational reform priorities, it can be characterised in terms of pedagogical approaches that are aligned with how students learn science. We hypothesise that QM instruction involves engagement in authentic instruction and application of instructional strategies that prioritise student understanding and measurable learning outcomes. Moreover, QM instruction emphasises the integration of mathematics in teaching biology for the purpose of developing quantitative reasoning skills necessary for problem-solving. In this section, we provide a brief discussion of the foundational literature on the dimensions of QM instruction in biology and a more detailed discussion of relevant literature in connection to the components and items in the instrument.
Authentic instruction
Authentic instruction is observed in classrooms where students create knowledge by constructing meaning (Newmann et al., Citation2007). To construct meaning, students employ disciplined inquiry and strive to create conversations, products, and performances that are valuable or meaningful outside of the classroom (Hester et al., Citation2018; Yarden & Carvalho, Citation2011). When students see how abstract concepts relate to their own lives, their attention and motivation to learn are sustained (Watters & Ginns, Citation2000). Instructors who prioritise authentic instruction design lessons that engage students in learning experiences that have value beyond the classroom through examples or use of real-world data (Stein et al., Citation2004). For instance, when biology is taught in connection with the work of scientists, relevant organisations, or external agencies, students may be provided with research experiences such as opportunities to observe, gather data, or collaborate with individuals or groups outside of the classroom (Auchincloss et al., Citation2017). Authentic instruction is associated with meaningful learning because students engage in practices that can be observed in the work of scientists, which supports them to think like a member of their discipline (Meyers & Nulty, Citation2009; Power, Citation2010). Students develop scientific literacy skills that enable them to seek, locate, or determine answers to questions arising from ordinary encounters. In classrooms where authentic instruction is practiced, students communicate verbally or in written form using science vocabulary when they engage in discussions with their instructor or peers to learn to communicate with the general public (AAAS, Citation2011; Brownell et al., Citation2013).
Learning becomes meaningful for students when biology is presented using holistic problems that are relatable to their daily lives (Mayo, Citation2010). The phenomena addressed by holistic problems serve to anchor QM activities to practical applications. Holistic problems also characterise systems biology and put an emphasis on the fundamental interconnectedness of all things. Students are provided with opportunities to examine how systems operate and impact each other when instructors adopt a systems perspective and guide students in understanding phenomena occurring within different levels of biological organisation (Gilissen et al., Citation2020). In contrast to reductionist biology, a systems perspective approach prioritises understanding the larger picture by putting pieces together which fosters authenticity in relation to methods that scientists engage in to address real-world issues associated with complex science topics such as pandemics, climate change, genetically modified organisms, contraception, and reproductive health (Assaraf & Knippels, Citation2022). We hypothesise authentic instruction as a dimension of QM instruction in biology because QM activities are crucial to investigating real-world phenomena (Mayes et al., Citation2014).
Teaching for understanding
Teaching for understanding pertains to the implementation of learning activities that push students to think, analyse, solve problems, and apply what they have learned (Blythe, Citation1998; Wiske et al., Citation2005). It is characterised by the design of lessons that are made accessible to students by connecting to their prior knowledge, making learning objectives, and engaging students in activities that develop their thinking and demonstrate their current understanding. Instructors who prioritise teaching for understanding design lessons built upon overarching concepts that students should learn from the lesson. These overarching concepts are called enduring understandings, which are insights or summaries of key ideas and processes that are important to a field and have significance beyond the classroom (Wiggins & McTighe, Citation2005). For instance, an instructor who wants students to learn that photosynthesis and cellular respiration cycle matter and energy through living systems would embed learning objectives to focus the direction of the lesson and select activities and assessments that determine what students are learning. To target the development of enduring understandings, essential questions that force the learner to apply, analyse, evaluate, and create using information or data are used to guide the lesson (Wiggins & McTighe, Citation2005). Iterative assessments are embedded in lessons to make student learning and changes in understanding visible to the instructor and the students. Overall, learning environments created with teaching for understanding in mind position students as active participants in their own discovery process rather than passive recipients of information. This promotes a paradigm shift towards biology education that combines understanding key biological concepts, modelling skills, and societal awareness (Robeva et al., Citation2020 ).
Quantitative reasoning
Modelling-based learning is a theoretical framework that situates learning in modelling environments, that is, students are provided with opportunities to construct models and understand their nature and purpose (Louca & Zacharia, Citation2019; Nicolaou & Constantinou, Citation2014). QM instruction involves students in using quantitative data to create, test, and revise solutions to ill-structured, real-world problems (Campbell et al., Citation2015; Mayes et al., Citation2014; Mayes et al., Citation2022; Schuchardt & Schunn, Citation2016). A quantitative approach to teaching biology requires learners to develop a quantitative account of the phenomena (Quantitative Acts), understand mathematical and conceptual interactions among the model components (Quantitative Interpretation), and use known QM processes of creating and testing models (Modelling Practices) to explain biological phenomena (Mayes et al., Citation2014). Quantitative acts involve covariation, quantification, quantitative literacy (Feser et al., Citation2013; Flanagan & Einarson, Citation2017; Goldstein & Flynn, Citation2011; Hoffman et al., Citation2016; Speth et al., Citation2010), while quantitative interpretation activities include analysing trends, model translations, making predictions and quantitative comparisons (Thompson et al., Citation2013; White et al., Citation2013). Modelling processes activities refer to creating, testing, revising and refining models. In this framework, QM activities and the reasoning required of students vary in difficulty to support learning as a progression from the basic acts of quantification to the sophisticated steps of model-building (Mayes et al., Citation2013). Modern QM techniques such as computational modelling and simulation modelling support deeper comprehension of underlying mechanisms and the capacity to examine complex biological processes (Bergan-Roller et al., Citation2017; Coller et al., Citation2022; Crowther et al., Citation2021; Mayes et al., Citation2019; Robeva, Citation2015).
Instructors who integrate quantitative reasoning in teaching biology emphasise the use of mathematics to represent biological relationships and solve biology problems (Jungck, Citation2011). They may also take advantage of sources of quantitative data such as research studies and open data sources to promote evidence-based quantitative reasoning (Krajcik & Merritt, Citation2012; Lehrer & Schauble, Citation2006; Louca & Zacharia, Citation2012; Schwarz et al., Citation2009). The modelling framework of learning (Lehrer & Schauble, Citation2006; Louca & Zacharia, Citation2012; Metcalf et al., Citation2000; Nicolaou & Constantinou, Citation2014; Sins et al., Citation2005; Windschitl et al., Citation2008) provides a foundation for modelling-based learning, an approach for teaching and learning in science where students construct models as representations of physical phenomena. The models include representations of objects characteristics and processes to increase student understanding of the phenomena (Louca & Zacharia, Citation2012). Research on metacognition of modelling promotes thinking about the process of modelling self-regulation through explicit identification, description of major steps in the modelling process, and the nature and purpose of models (Oh & Oh, Citation2010; Papaevripidou & Zacharia, Citation2015; Schwarz & White, Citation2005; Upmeier zu Belzen et al., Citation2019). As such, QM instruction also involves meta-modelling through learning experiences that require students to examine the utility of models, the purposes for which they can be used, and the limitations of evidence that can be derived from them.
Using the QM framework as a lens to examine the range of instructional practices focusing on acts, interpretation, practices, and meta-modelling, we developed the QMOP to describe the instructional practices of biology instructors as they implement quantitative reasoning, often through quantitative modelling in terms of authentic instruction, teaching for understanding, and quantitative reasoning. In particular, the breadth and depth of QM activities used by instructors may be related to pedagogical practices that prioritise student understanding and authentic experiences in biology.
Methods
The research team designed the present study to assess the appropriateness of the items in each of the specified QM dimensions and to describe how to interpret scores and uses. In this section, we describe the instrument design, development phases, and validity argumentation approach in relation to scores generated from the QMOP.
Instrument design and intended use
The QMOP is intended to be used as an observation instrument with guidelines for collecting data on the instructional practices in undergraduate biology lessons that integrate QM. Student data and description of the classroom setting can be noted in the introductory portion of the instrument about the learning environment that should be completed prior to a class observation.
The instrument has two distinct parts (see Supplementary Material Appendix 3). The first part is an observation record used for collecting and organising qualitative data using 13 a priori codes that correspond to classroom activities categorised within quantitative acts, quantitative interpretation, modelling processes, and meta-modelling (see ). An additional four codes were specified to correspond to the lesson delivery mode based on the Classroom Observation Protocol for Undergraduate Science instrument (Smith et al., Citation2013). The lesson delivery mode types are (1) Presenting – instructor led presentation to class; (2) Guiding – instructor actively engages students in learning; (3) Administration – instructor performs a non-instructional administrative task, such as taking role; and (4) Other (Smith et al., Citation2013). Raters indicate the presence of aspects of QM and the lesson delivery mode in 10-minute intervals during an observation. Data gathered from this section are designed to be used to determine the broad types of QM activities and frequency of implementation. The purpose of recording specific classroom activities is to provide raters with a source of evidence as grounding for scoring a lesson in the second part of the instrument. To further support decision-making in assigning scores, raters are prompted to write a summary of what they observed about the learning environment and the overall implementation of QM activities. Raters are instructed to write their qualitative assessment of the lesson after completing the observation record.
Table 1. QMOP observation record summary of codes.
The second part of the QMOP includes subscales of the instrument used for collecting quantitative data in which raters holistically assess a lesson observation based on indicators of QM instruction (Supplementary Material Appendix 1). This section describes the domain that the instrument endeavours to measure, namely the degree of implementation of QM in teaching undergraduate biology. Class sessions are assessed and rated from the lens of three dimensions (subscales) of QM: Authentic Instruction (7 items), Teaching for Understanding (6 items), and Quantitative Reasoning (8 items). Raters use a scoring rubric to assign a score for the entire class session.
Each statement in the QMOP is scored using a scale of 0–4 with a scoring rubric. A QMOP overall raw score is the sum of raw scores in all 21 items. The minimum and maximum raw scores are zero and 84, respectively. Raw scores can be transformed to percentage scores. Subscale raw scores and corresponding percentage scores are calculated in a similar manner. Analyses in this study used percentage scores. For all QM dimensions, we hypothesise that higher scores indicate more extensive QM instruction.
Phases of QMOP development
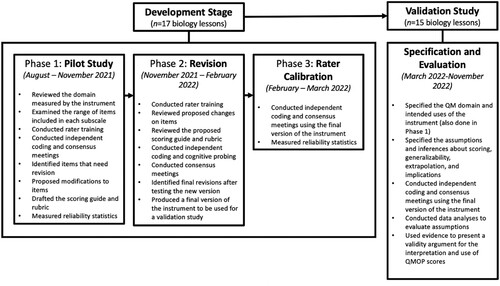
The QMOP was developed over several iterations to ensure that it was properly articulated, adequately defined, and included themes relevant to QM instruction in biology. The development of the instrument was divided into three phases: pilot study, revision, and rater calibration. Thirteen (n = 13) biology lessons were observed and used for protocol refinement during the development stage, which consisted of pilot phase and a revision phase ().
Figure 1. QMOP development and validation study. Participants for the validation study were recruited while the instrument was still under development.
Pilot phase
The pilot study phase involved two raters from the team who tested the instrument in ten classroom observations of local undergraduate biology faculty (eight recorded videos and two live classroom observations) teaching lessons similar to the target population of the validation study. One rater (L.L.) was a postdoctoral researcher with B.S. and M.S. in physics and Ph.D. in science education and the other rater (A.K.) was a Ph.D. student with an M.S. in biology. The first three observations were used for training, where raters reviewed the QM framework and engaged in think aloud sessions with the research team (co-authors) to explain their scores and decide on a consensus. The remaining seven lessons were independently coded by the raters. After coding each video, raters generated a set of consensus scores. During consensus meetings with the research team, raters identified items with discordant scores and noted proposals for item revision.
To inform future revisions of the instrument, the data was analysed to determine an early estimate of interrater reliability and internal consistency of the subscales. Specifically, the bivariate correlation of item scores between two raters (prior to consensus) ranged from r = 0.40 to r = 0.76 for a given lesson and showed improvement as the raters developed a shared understanding of the items in the instrument with each additional lesson. Cronbach’s alpha coefficients with the consensus ratings for each subscale were acceptable (AI, 0.81; TU, 0.80; QR, 0.81). The pilot study resulted in a new draft instrument that included additional description and coding rubric for each item to minimise interpretive differences between raters.
Revision phase
In the revision phase, members of the research team watched three recorded videos and used the new version of the QMOP with a coding guide and rubric. All members had prior experience in using the old version of the instrument, thus, only one video was used for training to ensure that all members were prepared to code the other two videos independently and justify their QMOP scores to their peers. As a form of cognitive interviewing (Ryan et al., Citation2012), research team members were tasked to write their thought process and reasoning for their assigned scores prior to conducting consensus meetings. This method was used to see how research team members perceived the meaning of items and the scoring rubric. Specifically, cognitive probing determined whether team members understood the items, whether they understood items as they were described in the coding guide, and whether they interpreted the rubric response options in similar ways. Disagreements among the research team members resulted in revisions and consensus after reviewing items and segments of observed video lessons. For example, in the following excerpt, Team Member A identified an issue with the coding rubric which was revised accordingly in the final version of the instrument.
Team Member A: I thought that various graphs shown represented data from the natural environment. I assume that [Team Member B] and [Team Member C] did not code as rubric level 2 because they do not view this as raw data. If this is the criteria that we want, then [it is] probably good to clarify rubric level 2 with ‘ … use of raw data from … ’ If we want to let graphs count, then we could clarify level 2 with ‘use of data (raw values, graphs, tables) from … ’
The team identified issues that led to response differences and made final changes on the items, coding rubric, and overall format of the instrument. Appendix 2 (Supplementary Material) shows an example of a modification from the original version to the final version of the QMOP. In this example, the intent of the original item was to capture the use of field experiences as an indicator of authentic instruction. The research team identified that the item would be problematic to score on a scale and different interpretations about what counts as out-of-classroom activity may arise. The item was revised to emphasise the value of a lesson beyond the classroom which may be established through other activities aside from physically bringing students outside the classroom. The final version of the QMOP (Supplementary Material Appendix 3) was produced at the end of the revision phase. The final version includes a description of the item and a scoring rubric in which the inclusion of field experiences is scored higher compared to the use of examples and data. An example of the completed Part 1 of the QMOP is provided (Supplementary Material Appendix 4).
Rater calibration
Two raters from the team checked their use of the final instrument and prepared for the validation study by independently coding four recorded video lessons (n = 4) using the final version of the QMOP with the coding guide and rubric. These were the same two raters as for the pilot phase. Raters discussed and arrived at consensus scores. The bivariate correlation of item scores between raters ranged from r = 0.60 to r = 0.80. Cronbach’s alpha coefficients for each subscale were acceptable (AI, 0.76; TU, 0.80; QR, 0.89). Raters also noted the improved criteria for scoring with the inclusion of the coding rubric.
Validation study
Participating courses
Instructors who teach undergraduate biology topics using quantitative approaches were recruited from various channels particularly the Quantitative Undergraduate Biology Education and Synthesis community of instructors and members of professional organisations, such as the Society for the Advancement of Biology Education Research and Association of College and University Biology Education in the United States. Fifteen (n = 15) instructors consented to participate in the study and completed the data collection requirements.
Data
Participating instructors identified and recorded a video of a biology lesson they planned to teach using a quantitative approach. They submitted a video recording of their target lesson to the research team including related instructional materials, such as worksheets and presentation slides. Each video lesson was coded by the two raters using the QMOP and the RTOP (Piburn et al., Citation2000; Sawada et al., Citation2002). Total scores and subscale scores were calculated and transformed to percentages. Participants also asked their students to complete outside of class time an online version of the QMBUGS student assessment, an instrument designed to measure students’ modelling and meta-modelling knowledge and abilities (Dauer et al., Citation2021; Mayes et al., Citation2019). Results of the QMBUGS assessment were aggregated using the mean percentage score to represent class performance.
Validity argumentation approach
We adopted an argument-based approach to validity, a framework for interpreting scores from assessments characterised by a process of articulating claims and assumptions associated with the proposed use of an instrument, testing these assumptions, and organising the results as evidence to support a validity argument (Kane, Citation2006, Citation2013). Our approach to developing a validity argument is aligned with the American Educational Research Association’s contemporary definition which is the degree to which evidence and theory support the interpretation of test scores for proposed uses of tests (AERA, Citation2014). This definition promotes a view of validity that is based on contemporary validity theory, which forms the foundation of developing a validity argument for the interpretation and use of scores generated from an instrument. While the classical approach often treats different types of validity (e.g. construct, content, criterion, etc.) as separate concepts, contemporary validity theory views them as interconnected and contributing to an overall validity argument.
The four inferences in a validity argument include assumptions about translating an observation to scores (scoring), generalising sample observations to a population (generalisation), relating scores to external indicators that measure shared constructs (extrapolation), and applying scores to inform a decision or action (implication; Kane, Citation2006, Citation2013). First, we describe an interpretative argument (), which is a series of interconnected presumptions that, if true, would support the suggested score interpretation and application of the QMOP. We next discuss our interpretation of scores and the types of evidence we gathered to assess our interpretive argument in relation to the intended use of the instrument. In the results section, we describe a validity argument in which we evaluate our assumptions and inferences using data and arguments.
Table 2. Interpretive argument (assumptions and inferences).
Scoring. The final version of the QMOP includes a scoring rubric to ensure appropriate descriptions for the scale points. This means that scores were designed to correspond to different classroom events for each item. To support this assumption, distributions of item-level scores were examined across QM dimensions. Accuracy in scoring was examined by determining the degree of agreement between individual rater scores and the consensus scores, while consistency referred to raters’ agreement with one another. The intraclass correlation coefficient across QMOP subscales were calculated as a measure of interrater reliability. The intraclass correlation coefficient was based on a single-rating, absolute-agreement, two-way random effects model with two raters across 15 subjects. Scoring bias was mitigated through double coding by the same pair of raters. Cronbach’s alpha was used to determine internal consistency of the subscales.
Generalisation. A sampling frame was created to represent the population of undergraduate biology instructors targeted in the study. The sampling frame used in this study is a list of biology instructors with appropriate contact information. Specifically, instructors who were recruited in the study have experience with QM instruction as shown by their participation and membership in professional development communities such as Quantitative Undergraduate Biology Education and Synthesis. We also identified the sources of variation within the context in which the data were collected to determine what may limit the generalisability of application (Huebner & Lucht, Citation2019). A generalisability study approach (Brennan, Citation2001) was used to estimate sources of variance. For instance, raters and occasions of data collection are usually considered as sources of measurement error or facets of a generalisability study. We considered raters because all instructors were measured on a single occasion by the same pair of raters. In this one-facet crossed design (Huebner & Lucht, Citation2019), the measurement, Xpr, for person p by rater r is given by the equation:
(1)
(1) Here,
is the grand mean, vp, and vr are the main effects, and
is the interaction effects confounded with unmeasured variability (Brennan, Citation2001; Huebner & Lucht, Citation2019). After identifying the design, we estimated the variance of measurements decomposed into components. The package gtheory (Moore, Citation2016) in the statistical software R (R Core Team, Citation2019) was used to calculate the variance estimates in Equation (1) to identify the sources contributing the greatest variability to QMOP measurements.
Extrapolation. We calculated the correlation between the QMOP and the RTOP as a measure of concurrent validity. The RTOP has been widely used to assess reformed teaching in higher education (Piburn et al., Citation2000; Sawada et al., Citation2002), and the original version of the QMOP used the RTOP as a blueprint for developing and refining a classroom observation protocol for QM instruction in biology. Thus, the QMOP is expected to have a high degree of correspondence with the RTOP. Similarly, we also calculated the correlation between the QMOP and QMBUGS assessment as a measure of predictive validity. We expected a moderate correlation because the instruments are applied to different groups, that is, instructors and students, although both were developed within related projects using the same QM framework (Mayes et al., Citation2013, Citation2014). To assess if QMOP scores can distinguish different types of QM instruction as part of discriminant validity, we calculated instructors’ frequency of use of specific QM activities and determined if they can be grouped based on what instructors choose to implement in their quantitative biology lessons. We also determined if the QMOP and subscale scores of these groups of instructors meaningfully reflect a difference in QM instruction.
Implication. To assess if QMOP scores are meaningful and can be used for decision-making, we describe the distribution of QMOP (and its subscales) scores for our sample and provide the normative data as context for QMOP users to compare results relative to the study cohort.
Results
In this section, evidence to examine inferences about scoring, generalisation, extrapolation, and implementation are gathered and discussed in relation to the intended interpretations and uses of the QMOP. We present the results to evaluate the interpretive argument articulated in .
Scoring
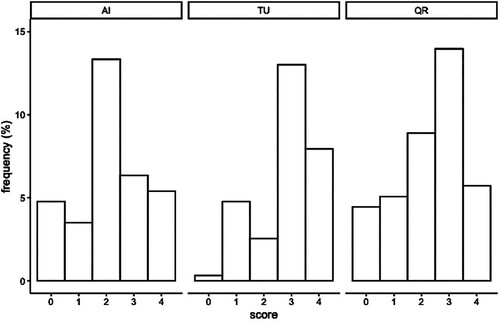
We examined whether the descriptions for the scale points are appropriate (Assumption 1.1) to determine if raters can apply a score based on a match between what they observed in a recorded video and the description of an event in the instrument. We found evidence that raters were able to apply the full range of the QMOP scale to observations (). The distribution of scores in the Teaching for Understanding scale indicated that the sample of instructors demonstrate a relatively high level of teaching for understanding practices such as student-directed activities and a variety of instructional strategies that sustain student engagement.
Figure 2. Distribution of item-level scores per QMOP dimension. Each instructor is represented multiple times in each histogram. AI = Authentic Instruction, TU = Teaching for Understanding, QR = Quantitative Reasoning.
Accuracy and consistency in scoring (Assumption 1.2) were assessed by examining individual rater scores and consensus scores. A high degree of agreement between individual rater scores and consensus scores indicated that individual raters used the scoring rubric as intended. Rater agreement with consensus scores was high, 78% to 87%, across QMOP dimensions (). The intraclass correlation coefficient across QMOP dimensions indicated moderate to good interrater reliability. To address potential scoring bias (Assumption 1.3), each lesson was double coded by the same pair of raters. The decision was made because the study sample was small, and double coding generated a higher total number of ratings that may allow for potential systematic error to be assessed in an interrater reliability estimate (Hallgren, Citation2012). The results indicated that raters independently reached similar conclusions about the classroom events they observed using the QMOP (). Using rater consensus scores, Cronbach’s alpha was used to determine internal consistency of the scales and examine whether the data support the hypothesised QM dimensions (Assumption 1.4). The Teaching for Understanding and Quantitative Reasoning scales exhibited good internal reliability (TU, 0.83; QR, 0.88) the internal reliability of the Authentic Instruction scale was below the generally acceptable Cronbach’s alpha value of 0.7 (Nunnaly & Bernstein, Citation1994).
Table 3. Reliability statistics.
Generalisability
To assess how interpretations made from QMOP scores can be generalised to the population of undergraduate biology instructors (Assumption 2.1), we describe the recruitment process and the sampling frame generated from the target population ().
Table 4. Target population and sampling frame.
Over the course of two years, N = 251 undergraduate biology instructors were identified as potential participants for the study based on having QM experience. The recruitment of faculty participants was challenging during 2020–2021 as the national education community struggled to manage alternative teaching modalities and related personal challenges during the COVID-19 pandemic surge. Video data from instructors were collected after they transitioned from online to face-to-face or blended instruction in 2021. Instructors identified a quantitative biology lesson to record and administered the QMBUGS student assessment to their class in the same semester. Fifteen instructors (n = 15) completed the required data (i.e. recorded video lesson, QMBUGS student assessment) for the study, which corresponded to a 50% response rate from the sampling frame. To assess if QMOP scores can represent a range of indicators of QM instruction in the population of instructors who implemented QM in undergraduate biology education (Assumption 2.2), the context in which data were collected was used to identify sources of variation that may limit the generalisability of application. Variance decomposition indicates that sufficient variance lies at the instructor level as opposed to the rater and unmeasured variance across the three dimensions of the QMOP (AI, 85.8%; TU, 87.0%; QR, 84.7%).
Extrapolation
The correlation of the QMOP with the RTOP and QMBUGS assessment was examined to evaluate Assumptions 3.1 and 3.2. The RTOP has been widely used to assess reformed teaching in higher education. There was a high degree of correspondence between the overall QMOP and RTOP (r = 0.96, ). QMOP was moderately correlated with the QMBUGS assessment (r = 0.58). However, only the Authentic Instruction scale was significantly correlated with students’ overall performance on the QMBUGS assessment (r = 0.69).
Table 5. Means, standard deviations, and correlations with confidence intervals.
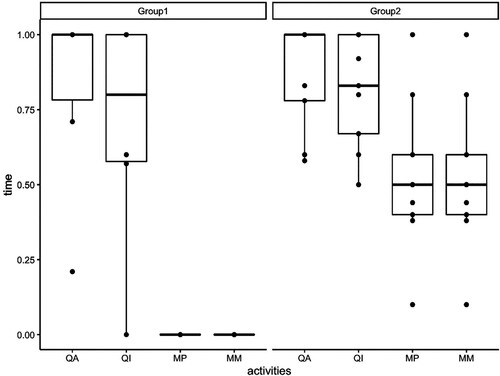
To evaluate Assumption 3.3, we examined whether QMOP scores corresponded to different types of QM instruction. Instructors in our sample appeared, under visual inspection, to form two groups in terms of the QM activities that they implement across their lessons. Instructors roughly differentiated into two groups (), one that focuses on quantitative acts and quantitative interpretation activities (Group 1, n = 6) and another that includes modelling practices and meta-modelling in addition to quantitative acts and quantitative interpretation activities (Group 2, n = 9).
Figure 3. Profile of instructors’ use of QM activities. Time refers to frequency of integration in terms of the proportion of 10-minute intervals (relative to the whole lesson) in which a specific activity was observed. Group 1 (n = 6) instructors focused on quantitative acts and quantitative interpretation activities while Group 2 (n = 9) instructors added modelling practices and meta-modelling activities into their lesson. The boxes cover the interquartile interval, and the whiskers correspond to the lower and upper quartiles. The dots correspond to raw data. Instructors may overlap in a single dot. QA = Quantitative Acts, QI = Quantitative Interpretation, MP = Modelling Processes, and MM = Metamodelling.
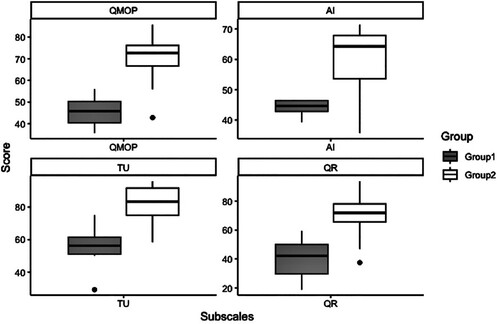
Group 2 instructors have higher QMOP scores compared to Group 1 with the addition of modelling practices and meta-modelling activities in their quantitative biology lessons. Group 2 instructors also had higher Teaching for Understanding and Authentic Instruction scores (). The difference in QMOP performance was consistent across all subscales.
Figure 4. Distribution of instructors’ QMOP and subscale per cent scores by group. Group 1 includes instructors who implement quantitative acts and quantitative interpretation activities in their teaching of biology. Group 2 instructors include modelling practices and meta-modelling in addition to quantitative acts and quantitative interpretation activities. The boxes cover the interquartile interval, and the whiskers correspond to the lower and upper quartiles. Dots represent outliers in the data set. AI = Authentic Instruction, TU = Teaching for Understanding, QR = Quantitative Reasoning.
Implications
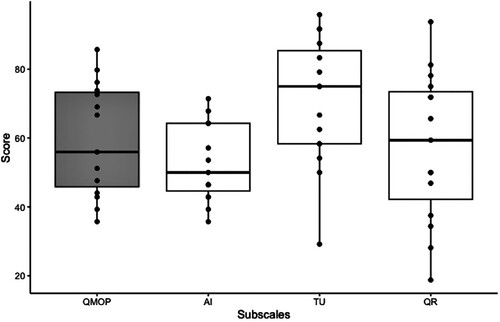
To assess if QMOP scores are meaningful and can be used for interpreting QM instruction based on classroom observations (Assumption 4.1) to characterise QM instruction, we examined the distribution of QMOP and subscale scores for the sample of undergraduate biology instructors. presents normative data to provide context for QMOP users to compare results relative to the study cohort. Instructors in this study were recruited from professional biology organisations and have self-identified as users of QM strategies in teaching biology. Their scores ranged from 35% to 86% with a median score of 56% (). Their score as a group varied across the subscales. They had the highest median score in the Teaching for Understanding scale (70%) and lowest in Authentic Instruction scale (50%). The Quantitative Reasoning scale had the widest range of scores from 19% to 94%.
Figure 5. Distribution of cumulative QMOP and subscale percent scores for the sample of undergraduate biology instructors (n = 15). The median score of the sample was 56%. The Teaching for Understanding subscale had the highest median score (75%). The Quantitative Reasoning subscale had the widest spread of scores from 19% to 94%. The boxes cover the interquartile interval, and the whiskers correspond to the lower and upper quartiles. The dots correspond to raw data. Instructors may overlap in a single dot. AI = Authentic Instruction, TU = Teaching for Understanding, QR = Quantitative Reasoning.
Normative data for the two groups of instructors described in the previous section were also generated. We note the presence of outliers and consider this analysis exploratory. However, the interquartile range can be used as a trimmed estimator to drop the outlying points. Interquartile range limits for Group 1 are 40% to 50% while Group 2 scores are within 67% to 76%. The same trend can be observed across the subscales. There were no overlaps between the two groups’ interquartile ranges with Group 2 consistently having a higher median compared to Group 1.
Discussion
In research question one, we asked what evidence supports the validity of the data collected with the QMOP. First, we examined the scoring assumptions. The strongest evidence supports the appropriateness of scores (Assumption 1.1) and the accuracy and consistency of raters (Assumption 1.2). Specifically, the distribution of scores across the QMOP dimensions shows that raters were able to apply the full range of the QMOP scale to observations. During the development phase, the team iteratively reviewed and revised the scoring rubric per item to capture a range of potential classroom events. The skewed distribution of Teaching for Understanding scores can be explained by the sample of biology instructors who were recruited from professional learning communities that underscore reform-based instruction. Higher QMOP scores in terms of instructional practices that promote teaching for understanding accurately depict these instructors (). The reliability statistics support the claim that raters used the QMOP accurately and consistently. To maintain acceptable interrater reliability, raters conducted calibration and consensus meetings to discuss disagreements in scoring because coding behaviour may change between and within individuals over time.
The bias aspect of the scoring inference (Assumption 1.3) was an area in which we identified supporting, but limited, evidence. The reliability statistics derived from independent raters were satisfactory and the same two raters coded all lessons in the sample. Our use of consensus scoring from two raters ultimately mitigated the bias that could arise from having one rater be the only person scoring a given instructor. However, other research projects may adopt the QMOP and use a pool of raters, potentially having individual videos being scored by an individual rater. Potential scoring biases by individual raters remain unevaluated with the present data.
We found mixed evidence supporting Assumption 1.4. QMOP dimensions were theoretically derived, and we hypothesised that empirical evidence may also support the proposed dimensions. The dimensions were strongly correlated with each other (), which strengthens the assumption that they represent the domain of QM instruction but indicates a degree of overlap between the dimensions. Similarly, the internal consistency of the Teaching for Understanding and Quantitative Reasoning scales was satisfactory and suggests that scores derived from these scales signified the corresponding hypothesised dimensions of QM. The lower internal consistency of the Authentic Instruction scale indicates that the associated items do not fully align with the underlying dimension. One of the items in the Authentic Instruction scale would be considered as a candidate for removal if additional data does not improve the internal consistency of the scale. This item pertains to providing opportunities for students to observe or collaborate with experts such as researchers or organisations outside of the classroom. The item was intended to capture the instructional use of fieldwork or projects that are critical authentic learning experiences to the biological sciences (Fleischner et al., Citation2017). This instructional practice was rarely observed, although we have also indicated in the scoring rubric that virtual observations such as watching a video of research scientists at work would count as a nonzero score in this scale.
Second, we turn to the generalisability assumption. Based on the sampling frame and target population (), the results presented in this study apply to undergraduate biology instructors who reported their use of QM (Assumption 2.1). The recruitment process specifically required potential participants to self-identify that they use QM in teaching biology and demonstrate an understanding of QM instruction by selecting a target lesson that they teach with QM activities. Within the population of instructors who use QM in teaching biology, a range of QMOP scores can be observed to represent differences in QM instruction. Specifically, the results of the generalisability study show that sufficient variance lies at the instructor level as opposed to the rater (Assumption 2.2). Although the generalisability assumption is supported by evidence, limitations of the generalisability study should be noted. In particular, the study did not consider sources of variance other than the rater such as the type of biology lessons observed by the raters, whether the lessons were prepared for introductory or advanced courses, and the number of observations per instructor (Lund et al., Citation2015; Sbeglia et al., Citation2021). Unexpected error is not sufficiently accounted for, and the sample of observed lessons may not adequately represent QM instruction in a broader sense. Therefore, there is limited evidence on the generalisability of QMOP scores to study designs that differ from the present study and evaluation of the validity assumptions across multiple implementation contexts is needed.
Third, we evaluate the extrapolation assumptions. Statistically significant correlations between the QMOP and other external measures were observed. Because the QMOP was designed from a framework that positions QM as a reform-based instructional approach, the QMOP and RTOP measure shared constructs. The high degree of positive correspondence between the two instruments supports Assumption 3.1. The RTOP was also used as a model instrument during the development phase of the QMOP. Similarities may be observed in the format and scoring rule, and items pertaining to student-centredness of instruction can be found in both instruments. QMOP differs from the RTOP principally on its Quantitative Reasoning scale that captures instructional practices that develop and support quantitative reasoning in undergraduate biology courses. All QMOP dimensions were strongly correlated with the RTOP, which was expected for the Authentic Instruction and Teaching for Understanding scales since they were mainly focused on general pedagogical approaches that were also described in the RTOP. The evidence that quantitative reasoning is also correlated with the RTOP supports the theoretical underpinning that QM is a reform-based approach to teaching biology.
If instructors incorporate QM in their biology lessons, a reasonable expectation is that their students gain knowledge and skills related to QM. Research studies have consistently shown that the quality of instruction experienced by students is an important school-related factor for their achievement (Hattie, Citation2009). We examined the correlation between instructors’ aggregate QMOP scores with the mean performance of their class in the QMBUGS assessment. The positive correlation between the two instruments suggests alignment between the QM activities described in the QMOP and the QM knowledge and skills tested in the QMBUGS assessment (Assumption 3.2). Although all the QMOP dimensions were positively correlated with student performance, only the Authentic Instruction scale was significantly correlated. This may point to the lasting impact of authentic instruction strategies on student learning (Mayo, Citation2010; Power, Citation2010). We also presented evidence that QMOP scores can be used to differentiate QM instruction (Assumption 3.3). QMOP scores can be used to differentiate groups of instructors based on the dimensions of QM prioritised in their implementation of biology lessons. Specifically, instructors who implemented a range of QM activities that encompass quantitative acts, quantitative interpretation, modelling practices, and meta-modelling (Group 2) scored higher in the QMOP compared to instructors who only used quantitative acts and quantitative interpretations strategies (Group 1; ). Because the difference might only be due to the items in the Quantitative Reasoning scale in which instructors would receive nonzero scores for the application of modelling practices, we further investigated differences in performance across QMOP scales. Group 2 instructors scored higher than Group 1 in all QMOP dimensions which suggests that instructors who integrate more QM activities also tend to implement higher level authentic instruction and teaching for understanding practices.
Finally, we evaluate the evidence to assess the implication assumption. In research question two, we asked how QMOP can be used to characterise QM instruction in undergraduate biology. We argue that QMOP scores can be appropriately used to characterise QM instruction and identify QM dimensions that instructors incorporate in their lessons through a range of observed practices (Assumption 4.1). Normative data generated from the study cohort represents instructors who reported their use of QM in teaching biology and showed awareness about QM instruction. These instructors were affiliated with professional biology education organisations that were used in creating a recruitment pool for this study. Instructors who already implement QM were targeted although the general population of biology instructors may possibly teach introductory biology classes without using a mathematical approach (Shekhar et al., Citation2014). Because of our sampling approach, we were able to observe modelling practices and meta-modelling activities that we expected to be present in classroom environments that emphasise QM. When we examined the types of QM activities instructors implemented in their lessons, we observed that 60% of the instructors in our sample used modelling practices and meta-modelling practices (Group 2). The inclusion of these practices in their lessons differentiated these instructors from those who also teach quantitative biology using a range of activities that primarily cover quantitative acts and quantitative interpretation. QMOP scores reflected the difference between these two groups consistently across its subscales thus providing a way to characterise QM instruction in support of Assumption 4.1. The result also supports the assumption that the hypothesised dimensions of QM contribute to the theoretical integrity of the instrument.
In summary, we argue that scores generated from the QMOP are meaningful for characterising QM instruction. Evidence supporting the scoring assumptions indicated that raters can be trained to reliably use the instrument. QMOP scores were associated with reform-based instruction and with student performance in a test of QM knowledge and skills, which suggests that it may be used to explore connections between QM instruction and QM learning. QMOP scores can also be used to determine how biology instructors compare with the normative data provided in this study. Evidence presented in this study shows that QMOP scores can also differentiate instructors.
Future users of the instrument should consider the limitations of this study, particularly the sources of error in how the data were collected. Using the QMOP in different contexts such as live classroom observations, conducting multiple observations of a single instructor, and research designs that would involve a pool of random raters would introduce sources of variance that were not accounted for in this study. Future work should consider empirical derivation of the hypothesised subscales (e.g. factor analysis) and using a larger and broader sample of biology instructors to investigate if the QMOP results presented in this study are replicable across instructors, including instructors who do report using QM during their instruction.
Ethics statement
This study was approved under the exempt research category by the Institutional Review Board at the University of Nebraska-Lincoln and was conducted in established or commonly accepted educational settings involving normal educational practices.
Supplemental Material
Download MS Word (47.8 KB)Acknowledgements
Ideas presented in this manuscript are those of the authors and do not necessarily reflect the views of personnel affiliated with the NSF.
Disclosure statement
No potential conflict of interest was reported by the author(s).
Additional information
Funding
References
- Aikens, M. L., & Dolan, E. L. (2014). Teaching quantitative biology: Goals, assessments, and resources. Molecular Biology of the Cell, 25(22), 3478–3481. https://doi.org/10.1091/mbc.E14-06-1045
- American Association for the Advancement of Science. (2011). Vision and change in undergraduate biology education: A call to action.
- American Educational Research Association, American Psychological Association, & National Council on Measurement in Education. (2014). American Educational Research Association, American Psychological Association, & National Council on Measurement in Education Standards for educational and psychological testing. American Educational Research Association.
- Assaraf, O. B., & Knippels, M. P. J. (2022). Lessons learned: Synthesizing approaches that foster understanding of complex biological phenomena. In O. B. Z. Assaraf & M. P. J. Knippels (Eds.), Fostering understanding of complex systems in biology education: Pedagogies, guidelines, and insights from classroom-based research (pp. 249–278). Springer International Publishing. https://doi.org/10.1007/978-3-030-98144-0_12
- Association of American Medical Colleges, & Howard Hughes Medical Institute. (2009). Scientific foundations for future physicians: Report of the AAMC-HHMI Committee.
- Auchincloss, L. C., Laursen, S., Branchaw, J., Eagan, K., Graham, M., Hanauer, D., Laurie, G., McLinn, C., Pelaez, N., Rowland, S., Towns, M., Trautmann, N., Varma-Nelson, P., Weston, T., & Dolan, E. (2017). Assessment of course-based undergraduate research experiences: A meeting report. CBE—Life Sciences Education, 13(1), 29–40. https://doi.org/10.1187/cbe.14-01-0004
- Baumfalk, B., Bhattacharya, D., Vo, T., Forbes, C., Zangori, L., & Schwarz, C. (2019). Impact of model-based science curriculum and instruction on elementary students’ explanations for the hydrosphere. Journal of Research in Science Teaching, 56(5), 570–597. https://doi.org/10.1002/tea.21514
- Bergan-Roller, H. E., Galt, N. J., Dauer, J. T., & Helikar, T. (2017). Discovering cellular respiration with computational modeling and simulation. CourseSource, 4. https://doi.org/10.24918/cs.2017.10
- Blythe, T. (1998). The teaching for understanding guide. Jossey-Bass.
- Brennan, R. L. (2001). Generalizability theory. Springer.
- Brownell, S., Price, J., & Steinman, L. (2013). Science communication to the general public: Why we need to teach undergraduate and graduate students this skill as part of their formal scientific training. Journal of Undergraduate Neuroscience Education, 12(1), E6–E10.
- Campbell, T., Oh, P. S., Maughn, M., Kiriazis, N., & Zuwallack, R. (2015). A review of modeling pedagogies: Pedagogical functions, discursive acts, and technology in modeling instruction. Eurasia Journal of Mathematics, Science and Technology Education, 11(1), 159–176. https://doi.org/10.12973/eurasia.2015.1314a
- Chen, M. M., Scott, S. M., & Stevens, J. D. (2018). Technology as a tool in teaching quantitative biology at the secondary and undergraduate levels: A review. Letters in Biomathematics, 5(1), 30. https://doi.org/10.30707/LiB5.1Chen
- Coller, H. A., Beggs, S., Andrews, S., Maloy, J., Chiu, A., Sankararaman, S., Pellegrini, M., Freimer, N., Johnson, T., Papp, J., Eskin, E., & Hoffmann, A. (2022). Bruins-in-genomics: Evaluation of the impact of a UCLA undergraduate summer program in computational biology on participating students. PLoS One, 17(5), e0268861. https://doi.org/10.1371/journal.pone.0268861
- Crowther, A., Bergan-Roller, H. E., Galt, N. J., Appleby, L., Dauer, J. T., & Helikar, T. (2021). Discovering prokaryotic gene regulation by building and investigating a computational model of the lac operon. CourseSource, 6. https://doi.org/10.24918/cs.2019.4
- Cvijovic, M., Höfer, T., Aćimović, J., Alberghina, L., Almaas, E., Besozzi, D., Blomberg, A., Bretschneider, T., Cascante, M., Collin, O., de Atauri, P., Depner, C., Dickinson, R., Dobrzynski, M., Fleck, C., Garcia-Ojalvo, J., Gonze, D., Hahn, J., Hess, H. M., … Hohmann, S. (2016). Strategies for structuring interdisciplinary education in systems biology: An European perspective. NPJ Systems Biology and Applications, 2(1), 1–7. https://doi.org/10.1038/npjsba.2016.11
- Dauer, J., Mayes, R., Rittschof, K., & Gallant, B. (2021). Assessing quantitative modelling practices, metamodelling, and capability confidence of biology undergraduate students. International Journal of Science Education, 43(10), 1685–1707. https://doi.org/10.1080/09500693.2021.1928325
- Donovan, S., Diaz Eaton, C., Gower, S. T., Jenkins, K. P., Lamar, M. D., Poli, D., Sheehy, R., & Wojdak, J. M. (2015). QUBES: A community focused on supporting teaching and learning in quantitative biology. Letters in Biomathematics, 2(1), 46–55. https://doi.org/10.1080/23737867.2015.1049969
- Durham, M., Knight, J., & Couch, B. (2017). Measurement Instrument for Scientific Teaching (MIST): A tool to measure the frequencies of research-based teaching practices in undergraduate science courses. CBE—Life Sciences Education, 16(4), ar67. https://doi.org/10.1187/cbe.17-02-0033
- Eaton, C. D., LaMar, D., & McCarthy, M. (2020). 21st century reform efforts in undergraduate quantitative biology education: Conversations, initiatives, and curriculum change in the United States of America. Letters in Biomathematics, 7(1), 55–66. https://doi.org/10.30707/LiB7.1.1647875326.082928
- Feser, J., Vasaly, H., & Herrera, J. (2013). On the edge of mathematics and biology integration: Improving quantitative skills in undergraduate biology education. CBE—Life Sciences Education, 12(2), 124–128.
- Flanagan, K. M., & Einarson, J. (2017). Gender, math confidence, and grit: Relationships with quantitative skills and performance in an undergraduate biology course. CBE—Life Sciences Education, 16(3), ar47.
- Fleischner, T., Espinoza, R., Gerrish, G., Greene, H., Kimmerer, R. W., Lacey, E., Pace, S., Parrish, J., Swain, H., Trombulak, S., Weisberg, S., Winkler, D., & Zander, L. (2017). Teaching biology in the field: Importance, challenges, and solutions. BioScience, 67(6), 558–567. https://doi.org/10.1093/biosci/bix036
- Follette, K., Buxner, S., Dokter, E., McCarthy, D., Vezino, B., Brock, L., & Prather, E. (2017). The quantitative reasoning for college science (quarcs) assessment 2: Demographic, academic and attitudinal variables as predictors of quantitative ability. Numeracy, 10(1), 5. https://doi.org/10.5038/1936-4660.10.1.5
- Garfunkel, S., & Montgomery, M. (Eds.). (2016). GAIMME report: Guidelines for assessment & instruction in mathematical modeling education. Consortium for Mathematics and Its Applications/Society for Industrial and Applied Mathematics.
- Gilissen, M. G. R., Knippels, M. P. J., & van Joolingen, W. R. (2020). Bringing systems thinking into the classroom. International Journal of Science Education, 42(8), 1253–1280. https://doi.org/10.1080/09500693.2020.1755741
- Goldey, E. S., Abecrombie, C. L., Ivy, T. M., Kusher, D. I., Moeller, J. F., Rayner, D. A., Smith, C. F., & Spivey, N. W. (2012). Biological inquiry: A new course and assessment plan in response to the call to transform undergraduate biology. CBE—Life Sciences Education, 11(4), 353–363. https://doi.org/10.1187/cbe.11-02-0017
- Goldstein, J., & Flynn, D. F. (2011). Integrating active learning & quantitative skills into undergraduate introductory biology curricula. The American Biology Teacher, 73(8), 454–461. https://doi.org/10.1525/abt.2011.73.8.6
- Hallgren, K. (2012). Computing inter-rater reliability for observational data: An overview and tutorial. Tutorials in Quantitative Methods for Psychology, 8(1), 23. https://doi.org/10.20982/tqmp.08.1.p023
- Hallström, J., Norström, P., & Schönborn, K. (2023). Authentic STEM education through modelling: An international Delphi study. International Journal of STEM Education, 10(1), 62.
- Hattie, J. (2009). Visible learning: A synthesis of over 800 meta-analyses relating to achievement. Routledge.
- Hester, S., Nadler, M., Katcher, J., Elfring, L., Dykstra, E., Rezende, L., & Bolger, M. (2018). Authentic inquiry through modeling in biology (AIM-Bio): An introductory laboratory curriculum that increases undergraduates; scientific agency and skills. CBE—Life Sciences Education, 17(4), ar63. https://doi.org/10.1187/cbe.18-06-0090
- Hoffman, K., Leupen, S., Dowell, K., Kephart, K., & Leips, J. (2016). Development and assessment of modules to integrate quantitative skills in introductory biology courses. CBE—Life Sciences Education, 15(2), ar14.
- Hora, M. T., Oleson, A., & Ferrare, J. J. (2013). Teaching Dimensions Observation Protocol (TDOP) user’s manual. Wisconsin Center for Educational Research, University of Wisconsin-Madison.
- Huebner, A., & Lucht, M. (2019). Generalizability theory in R. Practical Assessment, Research, and Evaluation, 24(1). https://doi.org/10.7275/5065-gc10
- Hurney, C. A., Brown, J., Griscom, H. P., Kancler, E., Wigtil, C. J., & Sundre, D. (2011). Closing the loop: Involving faculty in the assessment of scientific and quantitative reasoning skills of biology majors. Journal of College Science Teaching, 40(6), 18–23.
- Ingalls, B. P. (2013). Mathematical modeling in systems biology: An introduction. MIT Press.
- Jungck, J. R. (2011). Mathematical biology education: Modeling makes meaning. Mathematical Modelling of Natural Phenomena, 6(6), 1–21. https://doi.org/10.1051/mmnp/20116601
- Kane, M. (2013). Validating the interpretations and uses of test scores. Journal of Educational Measurement, 50(1), 1–73. https://doi.org/10.1111/jedm.12000
- Kane, M. (2006). Validation. In R. L. Brennan (Ed.)National Council on Measurement in Education, & American Council on Education (Eds.), Educational measurement (pp. 17–64). Praeger.
- Krajcik, J., & Merritt, J. (2012). Engaging students in scientific practices: What does constructing and revising models look like in the science classroom? Science Scope, 35(7), 6–8.
- Lehrer, R., & Schauble, L. (2006). Cultivating model-based reasoning in science education. In R. K. Sawyer (Ed.), The Cambridge handbook of: The learning sciences (pp. 371–387). Cambridge University Press.
- Louca, L. Τ., & Zacharia, Z. C. (2019). Toward an epistemology of modeling-based learning in early science education. In A. Upmeier zu Belzen, D. Krüger, & J. van Driel (Eds.), Towards a competence-based view on models and modeling in science education (pp. 237–256). Springer International Publishing. https://doi.org/10.1007/978-3-030-30255-9_14
- Louca, L. T., & Zacharia, Z. C. (2012). Modeling-based learning in science education: Cognitive, metacognitive, social, material and epistemological contributions. Educational Review, 64(4), 471–492. https://doi.org/10.1080/00131911.2011.628748
- Lund, T. J., Pilarz, M., Velasco, J. B., Chakraverty, D., Rosploch, K., Undersander, M., & Stains, M. (2015). The best of both worlds: Building on the COPUS and RTOP observation protocols to easily and reliably measure various levels of reformed instructional practice. CBE—Life Sciences Education, 14(2). https://doi.org/10.1187/cbe.14-10-0168
- Mayes, R., Forrester, J., Christus, J., Peterson, F., Bonilla, R., & Yestness, N. (2013). Quantitative reasoning in environmental science: A learning progression. International Journal of Science Education, 36(4), 635–658. https://doi.org/10.1080/09500693.2013.819534
- Mayes, R., Forrester, J., Christus, J., Peterson, F., & Walker, R. (2014). Quantitative reasoning learning progression: The matrix. Numeracy, 7(2), ar5. https://doi.org/10.5038/1936-4660.7.2.5
- Mayes, R., Owens, D., Dauer, J., & Rittschof, K. (2022). A quantitative reasoning framework and the importance of quantitative modeling in biology. Applied and Computational Mathematics, 11(1), 1–17. https://doi.org/10.11648/j.acm.20221101.11
- Mayes, R., Rittschof, K., Dauer, J. T., & Gallant, B. (2019). Quantitative modelling biology undergraduate assessment. Letters in Biomathematics, 6(1), 1–27. https://doi.org/10.30707/LiB6.1Mayes
- Mayo, J. (2010). Constructing undergraduate psychology curricula: Promoting authentic learning and assessment in the teaching of psychology. American Psychological Association.
- Metcalf, S. J., Krajcik, J., & Soloway, E. (2000). Model-It: A design retrospective. In M. Jacobson & R. B. Kozma (Eds.), Innovations in science and mathematics education: Advanced designs for technologies in learning (pp. 77–116). Lawrence Erlbaum Associates.
- Meyers, N., & Nulty, D. (2009). How to use (five) curriculum design principles to align authentic learning environments, assessment, student approaches to thinking and learning outcomes. Assessment & Evaluation in Higher Education, 34(5), 565–577. https://doi.org/10.1080/02602930802226502
- Moore, C. T. (2016). Package ‘gtheory’ (v0.1.2). https://cran.uni-muenster.de/web/packages/gtheory/gtheory.pdf
- Neitzel, S., Zhao, Y., & Eaton, C. D. (2022). Improving interdisciplinary teaching through a complexity lens. bioRxiv. https://doi.org/10.1101/2022.05.26.493642
- Newmann, F., King, B., & Carmichael, D. (2007). Authentic instruction and assessment: Common standards for rigor and relevance in teaching academic subjects. Department of Education.
- NGSS Lead States. (2013). Next Generation Science Standards: For states, by states. http://www.nextgenscience.org/lead-state-partners
- Nicolaou, C. T., & Constantinou, C. P. (2014). Assessment of the modelling competence: A systematic review and synthesis of empirical research. Educational Research Review, 13, 52–73. https://doi.org/10.1016/j.edurev.2014.10.001
- Nunnaly, J. C., & Bernstein, I. H. (1994). The assessment of reliability. In Psychometric theory (3rd ed., pp. 206–235). McGraw-Hill.
- OECD. (2019). PISA 2018 assessment and analytical framework. OECD Publishing. https://doi.org/10.1787/b25efab8-en
- Oh, P. S., & Oh, S. J. (2010). What teachers of science need to know about models: An overview. International Journal of Science Education, 32(1), 1–29. https://doi.org/10.1080/09500690802412449
- Papaevripidou, M., & Zacharia, Z. C. (2015). Examining how students’ knowledge of the subject domain affects their processing of modeling in a computer programming environment. Journal of Computers in Education, 2(3), 251–282. https://doi.org/10.1007/s40692-015-0034-1
- Piburn, M., Sawada, D., Turley, J., Falconer, K., Benford, R., Bloom, I., & Judson, E. (2000). Reformed Teaching Observation Protocol (RTOP) reference manual. Arizona Collaborative for Excellence in the Preparation of Teachers.
- Power, A. (2010). Community engagement as authentic learning with reflection. Issues in Educational Research, 20(1), 57–63.
- R Core Team. (2019). R: A language and environment for statistical computing. R Foundation for Statistical Computing. http://www.R-project.org
- Robeva, R. (2015). Algebraic and discrete mathematical methods for modern biology. Academic Press.
- Robeva, R. S., Jungck, J. R., & Gross, L. J. (2020). Changing the nature of quantitative biology education: Data science as a driver. Bulletin of Mathematical Biology, 82(10), 127. https://doi.org/10.1007/s11538-020-00785-0
- Ryan, K., Gannon-Slater, N., & Culbertson, M. J. (2012). Improving survey methods with cognitive interviews in small- and medium-scale evaluations. American Journal of Evaluation, 33(3), 414–430. https://doi.org/10.1177/1098214012441499
- Sawada, D., Piburn, M., Judson, E., Turley, J., Falconer, K., Benford, R., & Bloom, I. (2002). Measuring reform practices in science and mathematics classrooms: The Reformed Teaching Observation Protocol (RTOP). School Science and Mathematics, 102(6), 245–253. https://doi.org/10.1111/j.1949-8594.2002.tb17883.x
- Sbeglia, G. C., Goodridge, J. A., Gordon, L. H., & Nehm, R. H. (2021). Are faculty changing? How reform frameworks, sampling intensities, and instrument measures impact inferences about student-centered teaching practices. CBE—Life Sciences Education, 20(3), ar39. https://doi.org/10.1187/cbe.20-11-0259
- Schuchardt, A. M., & Schunn, C. D. (2016). Modeling scientific processes with mathematics equations enhances student qualitative conceptual understanding and quantitative problem solving. Science Education, 100(2), 290–320. https://doi.org/10.1002/sce.21198
- Schwarz, C. V., Reiser, B. J., Davis, E. A., Kenyon, L., Achér, A., Fortus, D., Shwartz, Y., Hug, B., & Krajcik, J. (2009). Developing a learning progression for scientific modeling: Making scientific modeling accessible and meaningful for learners. Journal of Research in Science Teaching, 46(6), 632–654. https://doi.org/10.1002/tea.20311
- Schwarz, C. V., & White, B. Y. (2005). Metamodeling knowledge: Developing students’ understanding of scientific modeling. Cognition and Instruction, 23(2), 165–205. https://doi.org/10.1207/s1532690xci2302_1
- Shekhar, S., Zhu, L., Mazutis, L., Sgro, A., Fai, T., & Podolski, M. (2014). Quantitative biology: Where modern biology meets physical sciences. Molecular Biology of the Cell, 25(22), 3482–3485. https://doi.org/10.1091/mbc.E14-08-1286
- Shi, F., Wang, L., Liu, X., & Chiu, M. H. (2021). Development and validation of an observation protocol for measuring science teachers’ modeling-based teaching performance. Journal of Research in Science Teaching, 58(9), 1359–1388. https://doi.org/10.1002/tea.21712
- Sins, P. H. M., Savelsbergh, E. R., & Van Joolingen, W. R. (2005). The difficult process of scientific modelling: An analysis of novices’ reasoning during computer-based modelling. International Journal of Science Education, 27(14), 1695–1721. https://doi.org/10.1080/09500690500206408
- Smith, M. K., Jones, F. H. M., Gilbert, S. L., & Wieman, C. E. (2013). The classroom observation protocol for undergraduate STEM (COPUS): A new instrument to characterize university STEM classroom practices. CBE—Life Sciences Education, 12(4), 618–627. https://doi.org/10.1187/cbe.13-08-0154
- Speth, E. B., Momsen, J. L., Moyerbrailean, G. A., Ebert-May, D., Long, T. M., Wyse, S., & Linton, D. (2010). 1, 2, 3, 4: Infusing quantitative literacy into introductory biology. CBE—Life Sciences Education, 9(3), 323–332.
- Stein, S., Isaacs, G., & Andrews, T. (2004). Incorporating authentic learning experiences within a university course. Studies in Higher Education, 29(2), 239–258. https://doi.org/10.1080/0307507042000190813
- Svoboda, J., & Passmore, C. (2013). The strategies of modeling in biology education. Science & Education, 22(1), 119–142. https://doi.org/10.1007/s11191-011-9425-5
- Thompson, K. V., Cooke, T. J., Fagan, W. F., Gulick, D., Levy, D., Nelson, K. C., Redish, E. F., Smith, R. F., & Presson, J. (2013). Infusing quantitative approaches throughout the biological sciences curriculum. International Journal of Mathematical Education in Science and Technology, 44(6), 817–833. https://doi.org/10.1080/0020739X.2013.812754
- Upmeier zu Belzen, A., van Driel, J., & Krüger, D. (2019). Introducing a framework for modeling competence. In A. Upmeier zu Belzen, D. Krüger, & J. van Driel (Eds.), Towards a competence-based view on models and modeling in science education (pp. 3–19). Springer International Publishing. https://doi.org/10.1007/978-3-030-30255-9_1
- Watters, J., & Ginns, I. (2000). Developing motivation to teach elementary science: Effect of collaborative and authentic learning practices in preservice education. Journal of Science Teacher Education, 11(4), 301–321. https://doi.org/10.1023/A:1009429131064
- White, H. B., Benore, M. A., Sumter, T. F., Caldwell, B. D., & Bell, E. (2013). What skills should students of undergraduate biochemistry and molecular biology programs have upon graduation? Biochemistry and Molecular Biology Education, 41(5), 297–301. https://doi.org/10.1002/bmb.20729
- Wiggins, G. P., & McTighe, J. (2005). Understanding by design (2nd ed.). Pearson.
- Windschitl, M., Thompson, J., & Braaten, M. (2008). Beyond the scientific method: Model-based inquiry as a new paradigm of preference for school science investigations. Science Education, 92(5), 941–967. https://doi.org/10.1002/sce.20259
- Wiske, M. S., Franz, K., & Breit, L. (2005). Teaching for understanding with technology. Jossey-Bass.
- Yarden, A., & Carvalho, G. (2011). Authenticity in biology education: Benefits and challenges. Journal of Biological Education, 45(3), 118–120. https://doi.org/10.1080/00219266.2011.590219