
 ?Mathematical formulae have been encoded as MathML and are displayed in this HTML version using MathJax in order to improve their display. Uncheck the box to turn MathJax off. This feature requires Javascript. Click on a formula to zoom.
ABSTRACT
The present work investigates the impact resistance of metallic parts produced using Laser Powder Bed Fusion and the possibility of its prediction using machine learning algorithms. The challenge lies in finding optimal process parameters before printing based on the existing data. Economic constraints often result in the availability of only a limited amount of data for predictive purposes. In this work, around one hundred data points from Charpy impact tests on AlSi10Mg0.5 were used to analyse the correlation between the impact resistance and process parameters, including information about sample porosity. The present research implements a data augmentation technique that artificially increases the volume of training data by applying domain-specific transformations to the original limited dataset. Using this technique, the dataset had been extended to over one thousand data points. To identify the most suitable approach for the specific issue at hand, several algorithms were explored: Regression Neural Network, K-Nearest Neighbours, Decision Tree, Random Forest, AdaBoost, Gradient Boosting, XGBoost, as well as ensemble combinations of Random Forest with AdaBoost, Gradient Boosting, and XGBoost algorithms. The results suggest that the Random Forest and the boosting algorithms generalise best given the sparse testing data. The best-performing models yield a prediction fitness reaching 86 percent. Therefore, an effective model for predicting the impact resistance had been developed and can be used to optimise the quality of additively manufactured parts.
1. Introduction
Understanding the process-structure-property correlation is of crucial importance when implementing new technology or designing new materials. However, is not always easy to describe these relations due to the complexity of a manufacturing process and microstructure development. Therefore, there is a need for the development and application of techniques that would support revealing the process-structure-property relations. Herein, machine learning (ML), or more broader artificial intelligence, is intensively used in material science. In the last decade, numerous papers have been published to address this issue, particularly in the field of emerging technologies like additive manufacturing (AM) [Citation1–3].
AM has emerged as a groundbreaking technology that allows the creation of objects by depositing material layer by layer, in contrast to traditional manufacturing methods, where the material is typically removed [Citation4]. Therefore, it is currently implemented in various industrial sectors such as automotive, aerospace, or medicine to new a few. AM and Laser Powder Bed Fusion (PBF-LB) in particular, have multiple benefits, such as unprecedented design flexibility in geometries, increased integral part design leads to reduced joining procedures, and lower production waste [Citation5]. However, some challenges include relatively high costs and possible production defects [Citation5, Citation6]. In particular, PBF-LB-fabricated specimens might contain pores that affect the ability of a specimen to withstand external stresses [Citation6]. The other challenge is a large number of process parameters that need to varied to achieve the process stability and optimal product quality [Citation5]. When addressing the automotive industry, such properties as material toughness related to the crash performance are of crucial importance. The most common testing method to obtain this property is the Charpy impact test, which measures the energy absorbed by a material during the fracture of a specimen [Citation7]. Although achieving high-quality parts is possible, the complexity of the parametric setup makes it challenging to anticipate material qualities precisely before printing. One way is to use ML and in particular regression algorithms to recognise data patterns and make predictions based on the available limited historical data [Citation8].
The previous works show several attempts to predict the Charpy impact energy using ML. For example, Muscat et al. used a variation of artificial neural networks to predict the Charpy impact energy of heat-treated steels. The researchers showed a distinguished result achieving a correlation of 82 percent while successfully mitigating the issue of overfitting when training on a dataset with 1661 samples [Citation9]. Another research described the efficient test prediction of low-alloyed carbon steel, where the researchers managed to achieve a correlation of 95 percent using a deep neural network for a dataset of 7211 samples [Citation10]. Considering the various studies on predicting the Charpy impact energy using diverse statistical and machine learning methods, it is evident that constructing a reliable prediction model is feasible with an adequately large dataset. However, during process qualification or optimisation of the PBF-LB process, much smaller datasets are typically available, which rarely exceed more than 200 samples with large variations of printing parameters [Citation11–13]. This creates the question, of how to apply ML methods to such small datasets. The present paper explores the applicability of ML techniques to predict Charpy impact energies based on a small dataset. To boost the results, novel techniques such as data augmentation by ensemble methods are investigated.
2. Methods
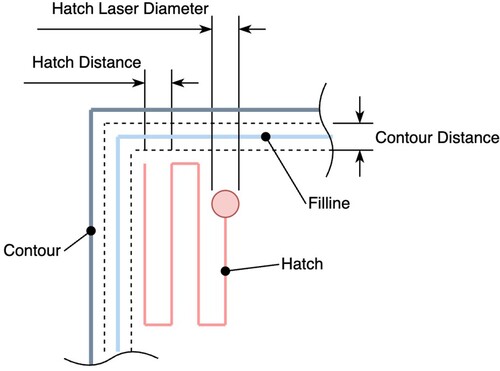
The dataset used in the present work was generated using the Charpy impact testing of samples produced using PBF-LB from AlSi10Mg0.5 alloy. For that, several Charpy V-notch samples were printed in the build direction with a geometry according to DIN EN ISO 148-1 (). The specimens, as well as the density cubes, were produced in the same batch as described in [Citation14]. The variation of the PBF-LB process parameters as well as the microstructure evaluation are described in the previous paper as well [Citation14]. The testing of samples was performed according to DIN EN ISO 148-1 using the PSW 30 impact testing machine from Losenhausen Maschinenbau AG and a 300 J pendulum from VEB Leipzig (now Kögel Werkstoff- und Materialprüfsysteme GmbH). The resulting dataset consisted of 122 data vectors. The following PBF-LB parameters were considered as independent variables as summarised below and illustrated in :
Contour Laser Power: The energy transferred by the laser at the contour of a specimen slice.
Contour Scan Speed: The speed at which the laser travels around the contour.
Contour Distance: The spacing between successive laser passes during contouring.
Fill-line Scan Speed: The speed of the laser traveling during the filline phase.
Hatch Laser Power: The energy transferred by the laser during the hatching of a specimen.
Hatch Scan Speed: The speed of the laser during the hatching phase.
Hatch Laser Diameter: The diameter of the laser beam during hatching.
Hatch Distance: The spacing between successive laser passes during hatching.
Layer Thickness: The height of each layer of powder material deposited.
Figure 1. A concept of the laser path demonstrating the independent variables as the core structural patterns.
Different ML algorithms were applied to enable the regression of the process parameters and prediction of a continuous output value. In particular, the following algorithms were implemented and evaluated: Regression Neural Networks, Decision Tree, Random Forest, k-Nearest Neighbours, Gradient Boosting, AdaBoost, XGBoost, AdaBoost + Random Forest, Gradient Boosting + Random Forest, XGBoost + Random Forest [Citation15–21]. The latter three algorithms are the combinations of ensemble methods, where Random Forest is used as a pre-trainer or as a modification of the initial algorithm [Citation22]. These combinations serve the purpose of reducing the bias-variance trade-off, compared to single methods [Citation23, Citation24]. The detailed implementation of the ML algorithms is beyond the scope of this work. The performance of the chosen ML algorithms was evaluated using the following error metrics: mean absolute error and coefficient of determination,
[Citation25].
Dataset splitting is a major challenge when training and testing ML models because it requires a careful approach specific to the nature of the data [Citation16]. For this research work, first, the classical group data splitting – further naïve splitting was investigated. The term naïve splitting implies a distinctive splitting technique that takes into account the grouped nature of the dataset. The grouping criteria are the process parameter sets, each consisting of multiple data points. Since the training data cannot be used during the testing phase, the train/test splitting should occur in a particular manner where a single group, i.e. a process parameter set, does not occur in both the training and testing datasets. For this, the GroupShuffleSplit from scikit-learn was used [Citation26]. The initial dataset of 122 vectors was split into 98 and 24 feature vectors using the 80-20 splitting strategy.
In order to ensure that the splitting does not cause overfitting due to the small number of feature vectors, a data augmentation technique was introduced. Arslan et al. describe appending Gaussian noise as a recommended and effective augmentation strategy for regression tasks [Citation27]. It involves creating artificial data points sampled from the Gaussian distribution probability density function given by Equation (Equation1(1)
(1) ), which is built using a mean and a standard deviation taken from each feature per process parameter set [Citation28, Citation29]. These artificial vectors are generated by sampling noise from the original dataset, therefore increasing the actual size of the training dataset. Subsequently, ML models are trained exclusively on the augmented dataset consisting of artificial data. The training procedure was conducted using the previously mentioned Python libraries. The computational backbone of this process was a machine equipped with the Apple M1 Pro chip and 32 GB of combined RAM/VRAM. On average, the complete training of all models was accomplished within a remarkably short duration of 9 minutes and 30 seconds. Here several factors influence the training speed: the small dataset simplifies the computational complexity, the optimised hardware to perform the calculations, where there is enough memory to fit all the models without a need for temporal data storage. Where some models had a form of regularisation – early stopping, which prevents models from a growing variance while not improving the error, indicating that the model starts to overfit, other models were regularised using other techniques, like pruning in case of decision trees, where branches with weak performance are removed. All this contributes to the shorter training time [Citation16]. Following the training step, the model's performance and generalisation capabilities were evaluated during the testing step using the original unseen data. The process of artificial data creation is reflected in the toy scheme in . This image shows a simplified version of the process of creating artificial data, where the left block is responsible for the augmentation. While rows are grouped by the impact value [J], the algorithm iteratively runs for every feature column and samples noise from the distributions generated out of the selected column values. All the feature columns are included in the augmentation, except the process parameter set column, which is removed before the data augmentation step. The final augmented dataset contains added variance of
, where σ is a standard deviation. After the last parameter set is processed, the total dataset is shuffled, and the training proceeds. In order to improve the performance further, hyperparameter tuning was performed on the presented models. The underlying technique is Grid Search using the GridSearchCV from the scikit-learn library [Citation26].
(1)
(1) where
| χ: | The Gaussian random variable | ||||
| μ: | The mean value | ||||
| σ: | The standard deviation | ||||
Figure 2. Data augmentation using Gaussian noise sampled from the grouped features [Citation30].
![Figure 2. Data augmentation using Gaussian noise sampled from the grouped features [Citation30].](/cms/asset/dfe80b3e-78a6-49fe-98d2-ed0b8aea9f94/tphl_a_2372497_f0002_oc.jpg)
3. Results
3.1. Naïve splitting
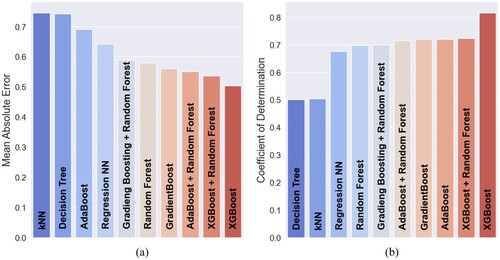
First, the naïve approach of the data splitting was applied for all considered ML algorithms. The best-performing ones for the naïve splitting are displayed in descending order from worst to best model in b: XGBoost, XGBoost + Random Forest, AdaBoost, Gradient Boosting, AdaBoost + Random Forest, Gradient Boosting + Random Forest, Random Forest, Regression NN, k-NN and Decision Tree. The highest score of the listed algorithms reached of 81.52 percent and
of 0.5 J for XGBoost. The lowest score for
is 50.11 percent and the worse score for
is 0.75 J for k-NN. The resulting bar charts can be seen in a and b, where the performance of the different methods can be compared. In the naïve approach, the dataset included 98 data points for training and 24 for testing.
Figure 3. Comparison of models after naïve splitting. (a) metric and naïve splitting and (b)
metric and naïve splitting.
3.2. Data augmentation
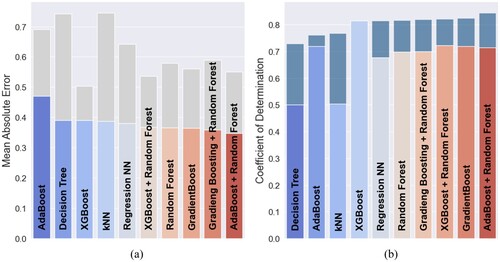
In the following step, the data augmentation was introduced to train the selected ML models exclusively on the augmented dataset. During this step, the dataset included 1015 augmented data points for training and 122 original data points for used testing. The final amount of augmented data points was provided from an empirical investigation balancing between increasing the dataset size and the introduction of excessive synthetic noise, where the latter would rather disrupt the underlying data patterns. The bench-marking for a number of augmented points in a similar domain varies from study to study, for instance, Zhu et al. nearly tripled the amount of data by the augmentation and for them the the disparity between the discriminator's accuracy for real data regulated the amount of the generated data [Citation31]. The best-performing algorithms within the data augmentation approach were AdaBoost + Random Forest, Gradient Boosting, XGBoost + Random Forest, Random Forest, Regression NN, and XGBoost. These algorithms delivered a score above 80 percent of the metric. It implies, that the models could explain more than 80 percent of the testing data points of the target variable. In average, the
score gained 12.18 percent and the
improved by 0.23 J. The k-NN regression method gained the most, according to the
and the
metrics. Its value increased for the
score by 26.3 percent and for the
by 0.36 J. The improvement of the selected models can be attributed to the robustness and flexibility of the algorithms to the noise and outliers. The least successful was the Decision Tree algorithm, scoring approximately 70 percent, according to the
error metric. The comparison can be seen on the bar plots in a and b, where algorithms are sorted by their performance. The grey area of the MAE plots indicates a decrease in error metric values compared to the naïve splitting. The blue area on top of the bars indicates an increase in values. The AdaBoost
score displayed only a moderate improvement, whereas the XGBoost did not show any improvement according to the
metric and moderately improved according to
, showing that these two algorithms do not greatly benefit from noisy data. Alternatively, the compromise for this problem involves training on an expanded dataset composed of augmented data, as well as testing on previously unseen data. This fact brings up a higher probability of a well-performing model in production.
Figure 4. Comparison of models after data augmentation. (a) metric and data augmentation and (b)
metric and data augmentation.
3.3. Hyperparameter optimisation
The hyperparameter optimisation on an augmented dataset reached the goal of improving the performance in most of the algorithms, excluding the Gradient Boosting + Random Forest model, where the default hyperparameters were already considered to be near-optimal, as they showed relatively high performance and the thorough searching for other combinations of hyperparameters demonstrated a deterioration in predictability. For the other models, the hyperparameter tuning resulted in different gains. The corresponding bar plots are shown in a and b, where the grey and blue areas indicate a change compared to the and
metric values before hyperparameter tuning. The best-performing algorithm remains to be the AdaBoost + Random Forest, while the most successful tuning was done on XGBoost, increasing by
percent. The average raise after the hyperparameter tuning is 1.14 percent, according to the
metric. The average change in
score is
. XGBoost is the method that showed the largest improvement. According to the
metric, its delta score is +2.29 percent, reaching 82.12 percent in total. On the other hand, the
score deteriorated by delta
, yielding 0.48 J. This behaviour points out that the XGBoost model fits the testing data well regarding variance. However, several single predicted points might significantly deviate from the true values, which may affect the
. This observation may require further investigation. The least-gaining method is Gradient Boosting + Random Forest yielding delta +0.5 percent in
and reaching 36.46 percent in total. These changes can also be observed in the respective bar plot. The hyperparameter tuning additionally introduced the regularisation for the Regression NN. This step included L1, L2, and dropout techniques of the model weights, as well as having Gaussian noise introduced to it. The
score demonstrated an improvement after the hyperparameter tuning. Respectively, the MAE values confirm that trend. Overall, the investigated ML models gained delta +13.32 percent on average, according to the
, and in comparison to the naïve results. Accordingly, the average change in
score is delta −0.23 J. The most improved model was k-NN with a delta value of +28.00 percent for the
metric and delta −0.37 J for the
metric. The least improved model according to the
was XGBoost, yielding a delta +0.60 percent difference concerning the naïve splitting results. Similarly, the
metric for XGBoost yields only delta −0.03 J, indicating that hyperparameter tuning on augmented data did not significantly influence this score.
Figure 5. Comparison of models after hyperparameter tuning. (a) metric and hyperparameter tuning and (b)
metric and hyperparameter tuning.
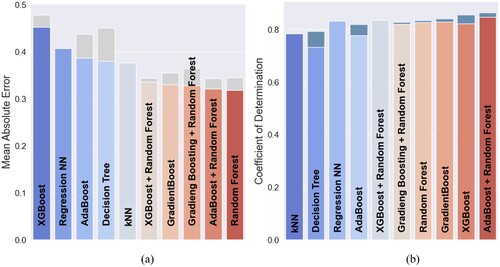
3.4. Porosity data
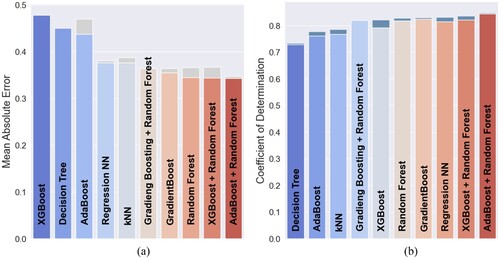
After the introduction of the porosity data, almost all the models allegedly improved their prediction quality. The corresponding bar charts can be seen in a and b, where the grey and blue areas indicate the difference in the values before introducing the porosity data. The AdaBoost + Random Forest continues to outperform the other models, according to . However, the most significant gain introduced by porosity data was presented by the Decision Tree algorithm having a delta of
equals 0.07 J and delta
of 6.03 percent, with
reaching 79.25 percent and
reaching 0.38 J. The best-performing method according to the
metric is Random Forest scoring 0.32 J. This difference in the best-performing models might exist due to the reason that the
metric emphasises the variance captured by one model. Therefore the model with a high
might be overall fitting the data well but it might still have significant errors on single data outliers. On the other hand, the lower-valued
metric consistently predicts closer to the true values, although the metric might not capture the overall variance as efficiently. While most of the models managed to improve their prediction performance after the introduction of the porosity data, the XGBoost + Random Forest and the Regression NN algorithms were not as performing, according to the
and the
metrics. The Regression NN yielded the
score of delta
and the
score of delta −0.028 percent upon the introduction of porosity data, reaching 0.41 J and 80.31 percent correspondingly. The k-NN model did not yield any changes of the metric values upon introducing the porosity data. Overall, it is possible to conclude that the porosity data does influence the performance of most of the models, but the effect is not constantly supreme. The investigated models improved by delta −0.25 J on average of the
score and delta +14.71 percent given by the
score, with respect to the naïve splitting results. The method with the largest improvement is k-NN having delta
of delta −0.37 J when comparing it to the naïve splitting results. The
score yielded the Decision Tree model as the most improved model, reaching
of delta 29.14 percent. Correspondingly, the least improved method is XGBoost, yielding the
score of delta
and the
score of delta +3.96 percent.
Figure 6. Comparison of models including the porosity data. (a) metric and porosity data and (b)
metric and porosity data.
3.5. Discussion
Given the results above, the best performing algorithm for predicting Charpy impact testing is the ensemble combination of the AdaBoost regressor and Random Forest as a base estimator, reaching 86.28 percent for the metric and 0.32 J for
. On the other hand, the
metric yielded Random Forest as the best-performing model, reaching 0.32 J. The next two most performing models were XGBoost and Gradient Boosting, according to
. The
yields AdaBoost + Random Forest and Gradient Boosting + Random Forest as the next two most performing models. Across these three algorithms, the most important features consistently were the contour laser power, the contour scan speed, and the hatch laser power. Specifically, the contour laser power has a variance of 10.7e5 W, which is a rather high value. The other two features exhibit a significant variance as well, as a larger variance carries potentially more information that might be useful for predictions [Citation16]. The least important features were the filling scan speed, the hatch distance, and the layer thickness. It follows the reasoning because the variance for the hatch distance is 55e-5 mm, which shows a minimal variance in the data. The filling scan speed value is nearly constant and equals 800, which does not yield a significant variance. The layer thickness variance follows the same logic, which is nearly constant and takes only two possible values: 50 and
.
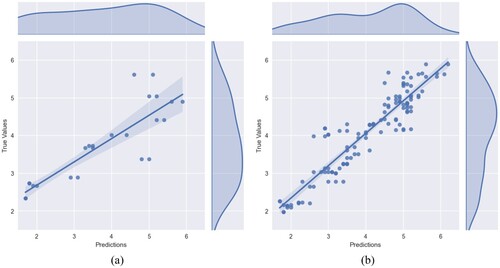
The correlation analysis displayed for the naïve splitting and data augmentation with the porosity data for the ensemble combination AdaBoost + Random Forest in a and b, correspondingly. Each dot represents the Charpy impact energy with its respective predicted value (horizontal axis) and true value (vertical axis) in the test dataset. The straight line attempts to summarise the dependency between the variables linearly. The shaded area around the regression line represents the confidence interval for the mean of the target variable, meaning a reasonable certainty about the line's position. The distribution of the predicted and true values is shown on the top and right margins of both plots. The plot in a suggests that the variability in the data was not fully captured by the initial learning approach, as indicated by the presence of outliers. This plot displays only a limited number of points, due to the small size of the original dataset. It is noticeable that several points are located at a certain distance from the regression line, indicating relatively poor predictability. This conclusion is also reflected by the error metrics, where reaches 0.56 J and
reaches 71.44 percent. In contrast, the augmented data correlation analysis shown in b reveals that the majority of the points are clustered around the regression line, suggesting improved predictability, having
reaches 0.32 J and
reaches 86.28 percent. Moreover, a large portion of the improvement took place after the introduction of the porosity data, reaching a delta of 1.62 percent according to the
metric. This plot also features a larger number of points due to data augmentation. The confidence band appears narrower compared to that in the naïve splitting plot, which indicates a better model fit to the augmented data. However, there are still some points that are remotely located and could not be accurately predicted. Addressing this issue may require more sophisticated data pre-processing techniques In the context of tree methods, boosting, and neural networks, the investigated models improved the quality of predictions. The efficiency of ensemble methods also indicates the inherent complexity of predicting Charpy impact testing. Ensembles are especially useful when the relationship between features and target is non-linear. Their ability to combine multiple base estimators and iteratively correct errors likely contributed to the satisfactory results in this research.
Figure 7. Comparison of the correlation analysis. (a) Naïve splitting and (b) Data augmentation incl. porosity data.
4. Summary and conclusions
The present paper investigated supervised ML methods to predict the toughness of additively manufactured metals. In particular, the PBF-LB process has been investigated when applied to the aluminum alloy AlSi10Mg0.5. Several regression algorithms were considered herein: Regression Neural Network, K-Nearest Neighbours, Decision Tree, Random Forest, AdaBoost, Gradient Boosting, XGBoost, as well as ensemble combinations of Random Forest with AdaBoost, Gradient Boosting, and XGBoost algorithms. Data augmentation using Gaussian noise was applied to increase the limited data set of measured values. The generated dataset was then used to train the models with pre-tuned hyperparameters.
summarises the final results listing the performance of the considered algorithms in descending order. The AdaBoost + Random Forest algorithm demonstrated the best performance reaching the score of 86.28 percent and 0.32 J of the
score after training on the augmented dataset including the porosity data. The method gained a significant improvement after the introduction of data augmentation. The extended dataset mitigated the problem of overfitting and offered an opportunity for the model to learn deeply underlying patterns in the data. For this reason, the data augmentation technique with sampling noise from a Gaussian distribution can be recommended for a similar problem with a small dataset. Furthermore, the porosity data extended the feature count of the dataset and further improved the predictability. Finally, the ensemble combination of the AdaBoost + Random Forest algorithms can be recommended as the suitable predictor of the Charpy impact energy. Given the complexity inherent in ensemble models, the AdaBoost + Random Forest combination is recommended for its balance between predictive power and interpretability. For better accessibility, software solutions that offer a user-friendly interface for parameter tuning, such as scikit-learn, are advisable. This allows even those with limited ML expertise to leverage these findings effectively. Scikit-learn stands out for its comprehensive documentation and ease of use, making it an ideal platform for implementing the suggested models and conducting parameter optimisation through strategies like grid search [Citation26]. The conducted research demonstrated that it is possible to predict the toughness of additively manufactured metallic materials using various regression techniques. In particular, the high importance of contour laser power, contour scan speed, and hatch laser power features was observed suggesting that PBF-LB operations should prioritise precise control and optimisation of these parameters to enhance material toughness. However, the effectiveness of using machine learning in AM is influenced by various factors. Many parameters need to be varied during the manufacturing to achieve high quality of samples. The optimisation of these parameters requires the conduction of a large number of experiments that are not technically and economically feasible. Thus, only a limited amount is usually available and additional data sources should be considered, e.g. from microstructure investigations such as the analysis of pore area fraction. This brings further valuable information about the fracture toughness as differences in the sample density influence this property. Therefore, the industry should consider the porosity of additively manufactured materials as an additional feature that influences the resulting mechanical properties of the material. As shown in this study, the inclusion of porosity data was beneficial to the predictability of Charpy impact energies, which can be utilised to enhance the crash behaviour of printed parts e.g. for automotive applications. Future research can focus on exploring the impact of further factors, model generalisation, and developing advanced techniques for optimising ML models in AM, such as different ways of data augmentation for regression.
Table 1. Performance of different algorithms.
Disclosure statement
No potential conflict of interest was reported by the author(s).
Additional information
Notes on contributors
Mykyta Smyrnov
Mykyta Smyrnov, M.Sc., is a software engineer and MLOps practitioner. He studied industrial engineering at the University of Applied Sciences Rhein-Waal and Computational Science and Engineering at the Technical University of Munich. His research focus is the application of machine learning in industrial processes.
Florian Funcke
Florian Funcke, M.Sc., is working as a material scientist and developer for metals in additive manufacturing, copper for EVs, and sustainability at BMW Group in Munich. He studied material science at Augsburg University and is currently a PhD student at the chair of materials engineering of additive manufacturing, at the Technical University of Munich. His research is focused on data-efficient machine learning in additive manufacturing, in particular laser powder bed fusion.
Evgeniya Kabliman
Dr. Evgeniya Kabliman is a group leader for materials computation at the Chair of Materials Engineering for Additive Manufacturing, Technical University of Munich. She graduated from South Urals State University and then finished her doctoral studies at the Technical University of Vienna. Afterwards, she worked as a scientist at the Austrian Institute of Technology in the area of light metals technology. The research focus of Dr. Kabliman is the application of computational methods to materials science, in particular, multi-scale materials modelling and machine learning.
References
- N. Kouraytem, X. Li, W. Tan, B. Kappes, and A.D. Spear, Modeling process–structure–property relationships in metal additive manufacturing: A review on physics-driven versus data-driven approaches, J. Phys.: Mater. 4 (2021), p. 032002. https://doi.org/10.1088/2515-7639/abca7b
- Q. Liu, W. Chen, V. Yakubov, J.J. Kruzic, C.H. Wang, and X. Li, Interpretable machine learning approach for exploring process-structure-property relationships in metal additive manufacturing, Addit. Manuf. 85 (2024), p. 104187. https://doi.org/10.1016/j.addma.2024.104187
- T.S. Vu, M.Q. Ha, D.N. Nguyen, V.-C. Nguyen, Y. Abe, T. Tran, H. Tran, H. Kino, T. Miyake, K. Tsuda, and H.-C. Dam, Towards understanding structure–property relations in materials with interpretable deep learning, npj Comput. Mater. 9 (2023), p. 215. https://doi.org/10.1038/s41524-023-01163-9
- F. Calignano, D. Manfredi, E.P. Ambrosio, S. Biamino, M. Lombardi, E. Atzeni, A. Salmi, P. Minetola, L. Iuliano, and P. Fino, Overview on additive manufacturing technologies, Proc. IEEE 105 (2017), pp. 593–612. https://doi.org/10.1109/JPROC.2016.2625098
- W.H. Kan, Y. Nadot, M. Foley, L. Ridosz, G. Proust, and J.M. Cairney, Factors that affect the properties of additively-manufactured AlSi10Mg: Porosity versus microstructure, Addit. Manuf. 29 (2019), p. 100805. https://doi.org/10.1016/j.addma.2019.100805
- H. Hyer, L. Zhou, S. Park, G. Gottsfritz, G. Benson, B. Tolentino, B. McWilliams, K. Cho, and Y. Sohn, Understanding the laser powder bed fusion of AlSi10Mg alloy, Metallogr. Microstruct. Anal. 9 (2020), pp. 484–502.
- Y. Chen, S. Wang, J. Xiong, G. Wu, J. Gao, Y. Wu, G. Ma, H.H. Wu, and X. Mao, Identifying facile material descriptors for charpy impact toughness in low-alloy steel via machine learning, J. Mater. Sci. Technol. 132 (2023), pp. 213–222. https://doi.org/10.1016/j.jmst.2022.05.051
- L. Meng, B. McWilliams, W. Jarosinski, H.Y. Park, Y.G. Jung, J. Lee, and J. Zhang, Machine learning in additive manufacturing: A review, JOM 72 (2020), pp. 2363–2377. https://doi.org/10.1007/s11837-020-04155-y
- R. Muscat and M. Mahfouf, Predicting charpy impact energy for heat-treated steel using a quantum-membership-function-based fuzzy model, IFAC-PapersOnLine 49 (2016), pp. 138–142.
- S.W. Wu, J. Yang, and G.M. Cao, Prediction of the charpy v-notch impact energy of low carbon steel using a shallow neural network and deep learning, Int. J. Miner. Metall. Mater. 28 (2021), pp. 1309–1320.
- E. Brandl, U. Heckenberger, V. Holzinger, and D. Buchbinder, Additive manufactured alsi10mg samples using selective laser melting (SLM): Microstructure, high cycle fatigue, and fracture behavior, Mater. Des. 34 (2012), pp. 159–169. https://doi.org/10.1016/j.matdes.2011.07.067
- N. Read, W. Wang, K. Essa, and M.M. Attallah, Selective laser melting of AlSi10Mg alloy: Process optimisation and mechanical properties development, Mater. Des. (1980–2015) 65 (2015), pp. 417–424. https://doi.org/10.1016/j.matdes.2014.09.044
- K. Riener, T. Pfalz, F. Funcke, and G. Leichtfried, Processability of high-strength aluminum 6182 series alloy via laser powder bed fusion (LPBF), Int. J. Adv. Manuf. Technol. 119 (2022), pp. 4963–4977. https://doi.org/10.1007/s00170-022-08673-8
- F. Funcke, T. Forster, and P. Mayr, Advantages of hybrid neural network architectures to enhance prediction of tensile properties in laser powder bed fusion, Key Eng. Mater. 964 (2023), pp. 65–71. https://doi.org/10.4028/p-0tCaMF
- C. Bentéjac, A. Csörgó, and G. Martínez-Muñoz, A comparative analysis of gradient boosting algorithms, Artif. Intell. Rev. 54 (2021), pp. 1937–1967.
- C.M. Bishop and N.M. Nasrabadi, Pattern Recognition and Machine Learning, Vol. 4, Springer, New York, 2006.
- L. Breiman, Random forests, Mach. Learn. 45 (2001), pp. 5–32.
- T. Chen and C. Guestrin, Xgboost: A scalable tree boosting system, in Proceedings of the 22nd ACM SIGKDD International Conference on Knowledge Discovery and Data Mining, 2016, pp. 785–794. San Francisco, CA.
- X. Li, L. Wang, and E. Sung, A study of AdaBoost with SVM based weak learners, in Proceedings 2005 IEEE International Joint Conference on Neural Networks, 2005, Vol. 1, 2005, pp. 196–201. Montreal, Quebeck. https://doi.org/10.1109/IJCNN.2005.1555829
- Y.Y. Song and L. Ying, Decision tree methods: Applications for classification and prediction, Shanghai. Arch. Psychiatry 27 (2015), p. 130.
- K. Taunk, S. De, S. Verma, and A. Swetapadma, A brief review of nearest neighbor algorithm for learning and classification, KIIT University, Odisha, India, 2019.
- G.I. Webb and Z. Zheng, Multistrategy ensemble learning: Reducing error by combining ensemble learning techniques, IEEE Trans. Knowl. Data. Eng. 16 (2004), pp. 980–991.
- G. Leshem and Y. Ritov, Traffic flow prediction using adaboost algorithm with random forests as a weak learner, Int. J. Math. Comput. Sci. 1 (2007), pp. 1–6.
- A. Merentitis, C. Debes, and R. Heremans, Ensemble learning in hyperspectral image classification: Toward selecting a favorable bias-variance tradeoff, IEEE J. Sel. Top. Appl. Earth Obs. Remote Sens.7 (2014), pp. 1089–1102.
- M. Naser and A. Alavi, Insights into performance fitness and error metrics for machine learning, preprint (2021), arXiv:2006.00887
- Scikit-learn Developers, Scikit-Learn – scikit-learn 1.x documentation (2023). Accessed: 22.10.2023. Available at https://scikit-learn.org.
- M. Arslan, M. Guzel, M. Demirci, and S. Ozdemir, SMOTE and Gaussian noise based sensor data augmentation, in 2019 4th International Conference on Computer Science and Engineering (UBMK), IEEE, 2019, pp. 1–5.
- N.M.R. Valente, Multiboosting for regression. Master thesis, Faculdade de Engenharia, Universidade do Porto, Porto, Portugal, 2020.
- Y. Ye, Y. Li, R. Ouyang, Z. Zhang, Y. Tang, and S. Bai, Improving machine learning based phase and hardness prediction of high-entropy alloys by using Gaussian noise augmented data, Comput. Mater. Sci. 223 (2023), p. 112140. https://doi.org/10.1016/j.commatsci.2023.112140
- M. Smyrnov, Quality optimization for additively manufactured parts using machine learning, Master's thesis, Technical University Munich, 2023.
- W. Zhu, W. Huo, S. Wang, Ł. Kurpaska, F. Fang, S. Papanikolaou, H.S. Kim, and J. Jiang, Machine learning-based hardness prediction of high-entropy alloys for laser additive manufacturing, JOM 75 (2023), pp. 5537–5548. https://doi.org/10.1007/s11837-023-06174-x