
 ?Mathematical formulae have been encoded as MathML and are displayed in this HTML version using MathJax in order to improve their display. Uncheck the box to turn MathJax off. This feature requires Javascript. Click on a formula to zoom.
Abstract
Friction stir welding (FSW) success depends heavily on the temperature and strain the FSW/FSP tool induces. This study examined the influence of FSW tool characteristics like shoulder and probe diameter and probe height on temperature, forces and failure load of welding of AA5083 alloy using the response surface methodology (RSM). The study’s setup consisted of three factors, three levels, and 17 experimental runs. In order to determine the welding temperature, a thermocouple was placed inside the samples. Also, the force during the process was measured using a fixture designed for this purpose. The generated model’s suitability at a 95% confidence level was assessed using an analysis of variance. Using RSM, a relationship was discovered between input parameters, including tool settings and output responses, such as temperature, force, and joint mechanical properties. This relationship was then used to discover the best process parameters using a hybrid multiobjective optimization. Hybrid multiobjective optimization recommends a probe diameter of 5.1 mm, a shoulder diameter of 17.63 mm, and a probe height of 3.86 mm as the optimum tool. This study discovered that the most important factors influencing temperature force and failure load were shoulder diameter, probe diameter, and probe height, respectively.
1. Introduction
FSW is a well-liked solid-state joining technique established by the Welding Institute in 1991 to join aluminum alloys [Citation1–4]. Since no material melts during the operation, FSW welding minimizes faults caused by melting [Citation5,Citation6]. FSW/FSP produces considerable plastic deformation and frictional heat [Citation7,Citation8]. Both of these factors led to an increase in internal workpiece temperature. The temperature history during FSW/FSP substantially impacts the microstructure, including grain size and boundary features, and the ensuing mechanical properties of the joints.
The microstructural and mechanical properties of the fabricated welds are stimulated during the FSW process by heat generation and temperature dispersion over various locations. The study of temperature and strain during FSW has been extensively researched to produce higher-quality welds [Citation9,Citation10]. A heat production model for FSW medium-thickness aluminum alloy 2219 was developed by Lu et al. [Citation11], taking into account both the heat produced by friction at the interface between the tool and the workpiece and the heat produced by the plastic deformation of the weldment material close to the tool. They investigated how welding factors affected temperature distribution. Using machine learning (ML) techniques, Anandan et al. [Citation12] predicted the maximum temperature during FSW using regression analysis techniques. They asserted that a tool rotating at 1000 revolutions per minute (rpm) would guarantee a maximum temperature of less than 300 °C, acceptable appearance, a lack of flaws, and adequate material mixing.
The rotation and traverse movements of the welding tool generate tool welding forces during the FSW process [Citation13]. Determining the force is crucial because an improved comprehension of tool forces allows for better tool development and clamping configurations that lessen tool wear and workpiece distortion. Therefore, it is essential to monitor and manage forces during FSW. This has several benefits, including improved tool design, increased tool life, improved fixture design, improved welded joint quality, and increased joint strength. So far, little research has been conducted on how to measure these forces and how friction stir welding is affected by them. D'Orazio et al. [Citation14] forecasted the vertical force generated during friction stir welding (FSW) of sheets made of the magnesium alloy AZ31 using a multivariable empirical model. Khan et al. [Citation15] investigated the effect of heat Generation and strain rate on traverse Force in FSW. Wu et al. [Citation16] combined the outputs of numerical modeling and experimental monitoring to establish a methodology for estimating the traverse force in FSW for different probe profiles.
One of the crucial elements in producing a joint with the required microstructural and mechanical qualities is designing an FSW tool suited for joining metals [Citation17,Citation18]. The probe with a specified profile and a specific shoulder are the components of the FSW tool, which will be used to determine the joints between the two sheets. After being pushed into the joining regions of the two specimens at high speed, the tool’s shoulder will touch the upper surface of the material. Next, the tool is made to move along the joint line. Tool probe size, including probe diameter, height, and shoulder diameter, significantly affect temperature and force during FSP. The procedure is quite complex, making it challenging to obtain the appropriate FSW parameters [Citation19]. Many academics have been interested in using the RSM method to study and improve various processes, including FSW. Suhin et al. [Citation20] used regression analysis and RSM to optimize the FSW process parameters for aluminum materials. The four variables used in FSW were spindle speed, axial load, tool probe profile, and aluminum material. Response surface methodology was used by Rahiman et al. [Citation21] to analyze friction stir welding of dissimilar aluminum 6061 and titanium TC4 alloys. Using the RSM approach, Bruce et al. [Citation22] improved the friction stir welding of AA5052-AA6061. The results demonstrate that increasing feed rate, RPM rate, and tilt attitude all enhance ultimate tensile up to a certain point, after which it starts to decrease.
The RSM method is an effective method for modeling the relationship between input and output parameters. So far, research has been done to check the capability of this model in comparison with other models. For example, Chabbi et al. [Citation23] investigated the model provided by RSM and ANN methods. Their results showed that both methods have a very high capability for modeling. Ahmadi et al. [Citation24] modeled the process of LaFeO3-NPs for fluoride reduction via the RSM and ANN tools. They used the CCD plan to analyze RSM and ANN to determine their capabilities of predicting the outputs. They claimed both methods gave a high degree of accuracy. Onu et al. [Citation25] studied the application of ANN, RSM, and adaptive neuro-fuzzy inference system (ANFIS) in modeling the uptake of Eriochrome black-T (EBT) dye. They claimed that the ANFIS, RSM, and ANN models accurately predicted the output parameters. In the RSM method, due to the presence of DOE provided by this method, as well as the simpler interface, a smaller number of data is required compared to the ANN method [Citation26].
As mentioned, FSW process optimization has been done by researchers with various methods, including RSM. Most of these researches have only investigated the mechanical properties of welding, and force and temperature have not been investigated. Also, all these researches are on butt welding, and lap welding, which has a different behavior, has not been investigated. For this reason, in this research, using the RSM method, the effects of tool geometry on the force, temperature, and tensile strength of the connection are investigated in friction stir lap welding. This study examined how applied force, temperature, and tensile strength were impacted using mathematical modeling and statistical analysis. As a method for designing experiments, the response surface methodology was selected. Using the results of the regression analysis and ANOVA of experimental data, the precision and accuracy of regression equations were evaluated.
2. Experimental method
2.1. Chemical composition of the base materials
The experiments were carried out on AA5083-O aluminum alloy plates with a thickness of 2.2 mm and chemical compositions as listed in .
Table 1. Chemical composition of the 5083 aluminum plates (wt%).
2.2. Experimental setup
The test apparatus is a friction stir welding machine with a stable base, table, tool head, horizontal process control, and revolving spindle supporting the FSP procedure. A specially designed instrument was employed to monitor the axial forces and maintain a firm grip on the workpiece (). This load measurement system uses two bending load cells to detect axial force and one S-type load cell to measure transverse force. This device’s transverse force measurement capability was 1.5 t with a precision of 5 N at the same sampling frequency, while the axial force measurement capability was up to 7 t with a precision of 12 N at a sampling frequency of 10 samples/s.
Figure 1. (a) The experimental setup, (b) a specially designed fixture, (c) a representation of different components of the force measurement fixture.
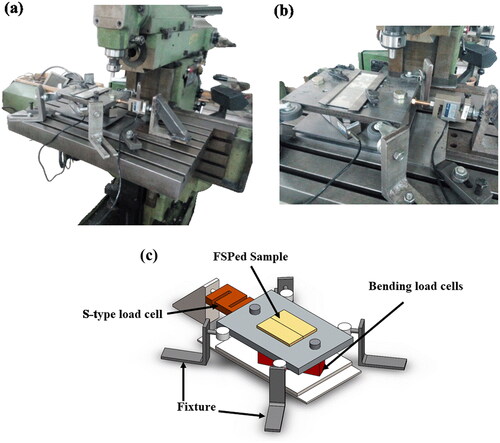
The lap joining procedure was performed using FSW at constant tool speeds of 1000 rpm and 32 mm/min. The welding setup is schematically shown in .
Figure 2. Schematic presentation of welding setup.
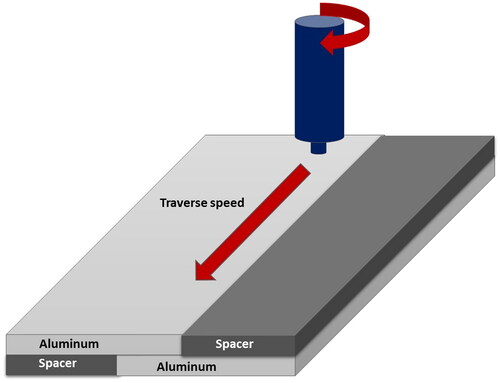
With a precision of 0.1 °C, a four-channeled thermometer was used to record the FSW's temperature history. K-type thermocouples were inserted 30 mm from the welding line to monitor temperature during FSW.
2.3. FSP tool
The lap joint was constructed using a variety of H13 steel FSW tools with various shoulder diameters (D), probe diameters (d), and probe heights (h). includes the dimensions and specifications for welding tools.
Table 2. Input parameters and their changes range in the FSW.
2.4. Tensile testing
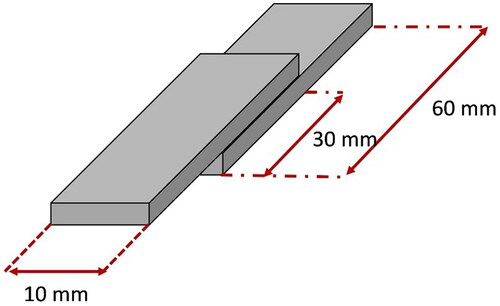
Peel or shear loading can be used to load lap joints predominantly. In this work, the nominally loaded lap joints in overlap shear were tested for strength. Tensile tests were carried out to examine the weld’s mechanical characteristics. depicts the dimensions of the test specimens utilized in the lap shear tests.
Figure 3. Dimensions of the prepared specimens for the tensile shear test.
3. Response surface method
3.1. Developing the design matrix
The RSM is used to model and improve response variable models in which several independent characteristics impact a dependent response. It combines statistical and mathematical tools. Using a central composite rotatable second-order design (CCD) matrix with star points placed in the center of each face of the factorial space, tests were carried out in line with the experimental plan. A factor’s upper and lower boundaries were both denoted by the numbers +1 and −1, respectively. The tool parameters settings and their levels used in this work are listed in .
Using Design Expert software, statistical analysis and experiment design have both been accomplished. depicts the design of the FSW experiments. The rows of the design matrix indicate several experiments, while the columns represent the level of tool parameters. It has a core composite design with three factors, three levels, and 17 sets of coded criteria.
Table 3. The layout of the FSW trials.
4. Result and discussion
4.1. Model adequacy
The validity of the derived empirical relation was evaluated using the analysis of variance (ANOVA) approach. show the results of the ANOVA for the temperature, force, and failure load of the joint, respectively. The created model has a substantial F-value for each response. A parameter’s p value indicates how effective it is. A parameter’s more significant value in the model is correlated with a smaller p value for that parameter. The model terms are considered significant when ‘Prob > F’ values are less than 0.050.
Table 4. ANOVA of the regression model for the temperature.
Table 5. ANOVA of the regression model for the force.
Table 6. ANOVA of the regression model for the failure load.
The model is validated using the ‘lack of fit’ test. The lack of fit test can be confirmed to be meaningless (PLack of fit > 0.05), which leads to the conclusion that the model can fit the data well. The ‘lack of fit’ test for the response variables is meaningless, as shown in , and the given model thus accurately depicts the data trend. On the other hand, the best analysis is performed when the model term is significant, and the ‘lack of fit’ term is insignificant. As a result, it is clear from the p values () that the model term is significant, whereas the ‘lack of fit’ term is not. This confirms the fitted model’s capability to forecast changes in response variables as a function of input variables.
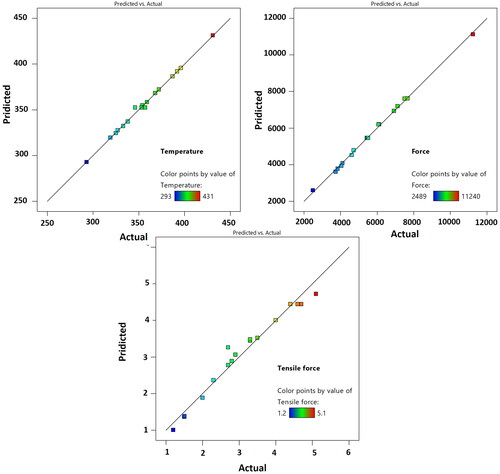
displays a graph of actual values versus predicted values that demonstrate the predictive ability of the developed model. The fact that both graphs’ points were so close to the actual value line suggests that the actual and expected values are relatively similar.
Figure 4. Normal probability diagram.
4.2. Developing the mathematical model
In the current study, RSM has been used as the approach for creating experiments. In most RSM-related issues, the relationship between the input variables and the responses is unknown. Therefore, the objective is to closely approximate the link between the set of response variables and independent input factors. The following is an expression for the response functions that describe the temperature, force, and failure load of the friction stir process:
(1)
(1)
In these equations, Y is the response, f is the response functions, PD, PH and SD are independent parameters. The approximation function, a second-order model, was employed in this study and is denoted by the following notation:
(2)
(2)
While b0 is considered the offset coefficient, bi, bii, and bij are the linear, quadratic, and variable interaction terms, respectively. xi and xj are also independent variables, and er is the unexpected error. The expected values for each response derived and evaluated from the RSM analysis’s regression equations are as follows:
(3)
(3)
(4)
(4)
(5)
(5)
4.3. Impact of FSW tool parameters on welding temperature
The temperature history during FSW/FSP affects the flow of material, microstructure, and final mechanical properties [Citation27]. The processes utilized to join materials during the FSW/FSP are well established and include frictional heat between the FSW tool and the material, softening, mixing, and extrusion action of a spinning tool [Citation27]. In FSW/FSP, heat is generated as a result of friction between the rotating tool and the plate as well as plastic deformation around the tool. The contact area and friction factor between the tool-workpiece surface, as well as the pressure applied to the tool, have an impact on heat generation.
Depending on the input variables, temperature variations can be depicted using 3D surface plots and contour plots (). The contour and surface plots, which are indicators of the potential independence of components, have been produced to acquire the influencing nature and optimal condition of the process on temperature. The response of any zone inside the design domain can be predicted with the use of these response contours. The response plot’s minimal value displays the lowest possible temperature value. In contrast to the simple sequence of parallel lines that can appear with first-order models, a contour plot is created to show the region of the optimal factor setting for the second-order response.
Figure 5. Response surface and contour plots of temperature against pin diameter, pin height, and shoulder diameter.
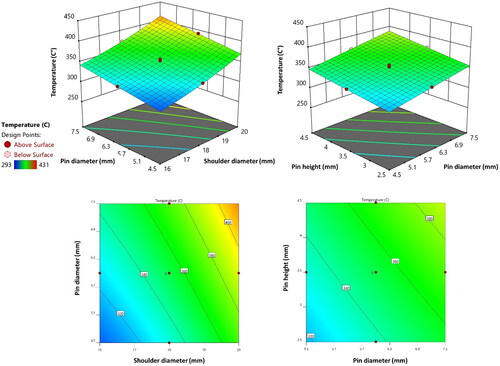
The temperature of the joint rises as the tool’s shoulder diameter increases, as illustrated in . Because more of the FSW tool and workpiece are in contact, friction heat generation has increased, which is primarily responsible for the temperature rise. In addition, as demonstrates, raising the tool probe diameter raises the workpiece temperature [Citation28]. Compared to an increase in shoulder diameter, an increase in probe diameter affects rising temperatures less. This was attributable to the shoulder and workpiece having a broader contact area than the probe and workpiece. Additionally, due to the shoulder’s larger radius, its linear velocity is higher than the probe’s.
displays the weld temperature for various probe heights. As seen in the illustration, raising the probe height raises the workpiece’s temperature. The primary cause of the temperature increase is an increase in friction heat brought on by an increase in the surface area in contact between the probe side and the material.
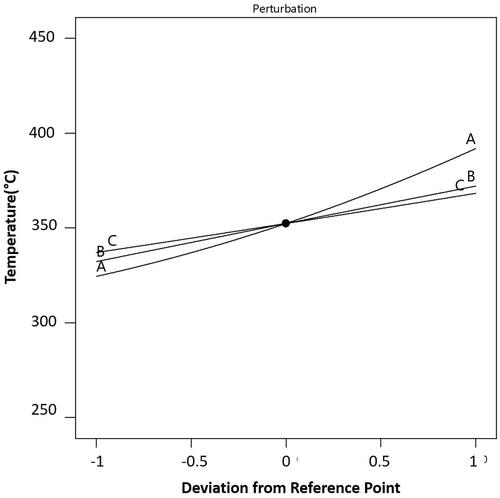
shows the perturbation plot for the response temperature. With all other parameters held constant at the reference value, this plot depicts the silhouette response and displays the temperature change when each tool parameter deviates from the reference point. The more significant F ratio value, obtained from ANOVA, reflects the greater significance of the levels. The F ratio value concludes that shoulder diameter is the primary component affecting the temperature. The force on the tool rises as the shoulder diameter grows, although it has less of an impact on the force when compared to the diameter of the tool’s pin. This is because the material softens as the shoulder diameter increases because more heat is created. The extra resistance force resulting from the larger diameter of the tool shoulder is somewhat offset by the more heat generated.
Figure 6. The perturbation plot for the response temperature.
4.4. Impact of FSW tool parameters on welding force
The examination of the forces applied to the FSW instrument is required for a number of reasons. First, as the load on the tool grows, its wear rate rapidly rises, resulting in a reduction in tool lifetime and an increase in processing costs [Citation29]. Second, tool wear-related composite impurities may cause the joint to degrade. It would appear vital to ascertain how tool characteristics affect force for this reason. The axial force history during the process is shown in . The samples are first placed inside a rotating instrument. The axial force drastically rises when the tool probe comes into contact with the metal plate during the plunging stage due to the interaction between material softening and work hardening. The two phases of the plunging stage are when the probe pierces the surface of the workpiece and when the tool shoulder touches the sample’s surface [Citation30]. shows the zone OA for probe penetrations into workpiece surfaces and the region AB for shoulder penetrations into sample surfaces. When the shoulder fully enters the specimen during the plunge, the axial force is at its maximum.
Figure 7. The axial force history.
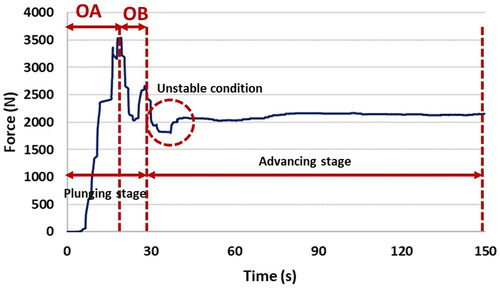
During the advancing stage, the force is initially slightly unsteady, but after some time, it stabilizes and drops below the maximum force felt during the plunging stage. The unstable period is mostly caused by the cooler material in front of the tool not being sufficiently stirred up at the start of the traverse. The material under the tool softens as a result of the frictional heat produced, and the high rotating of the FSP tool enables the plasticized metal to strain-harden. This conflict between heat generation and work hardening continues until a steady state is attained.
3D surface plots and contour plots in displays the average axial force for various FSW tool. It may be concluded that increasing the shoulder diameter causes rising the tool’s axial force. The variance in material resistance and heat generation caused by friction in each tool may be the cause of the discrepancy in axial force between tools with various shoulder diameters. On the one hand, by enlarging the tool shoulder, more frictional heat is produced, which increases material flow and, as a result, softens the workpiece’s material, which reduces axial force. On the other hand, as the tool’s interfacial contact area grows, the material resistance acting on the tool also grows. In this instance, the tool with the larger shoulder diameter produced more heat from friction and experienced greater axial forces as a result of greater material resistance. Thus, the impact of material resistance on axial force is more significant than the heat generated by friction. Additionally, when the probe diameter increases, the axial force increases. The increased contact area between the probe and the workpiece is what led to this outcome. The width of the material that needs to be sheared and stirred grows as the probe diameter rises, which increases the resistance force acting on the tool as it moves along the weld line. Similar to probe diameter, an increase in probe height causes an increase in axial forces because more of the workpiece is in contact with the probe.
Figure 8. Response surface and contour plots of force against pin diameter, pin height, and shoulder diameter.
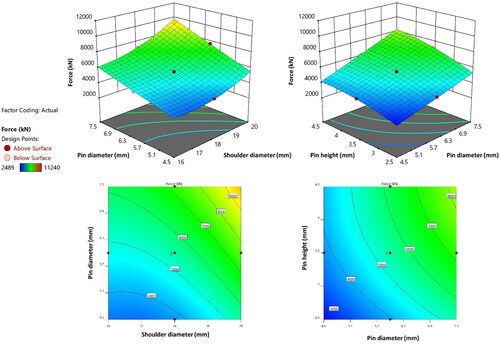
The least practical applied force value, as determined by the study of the contour plots and response surface in , is 2489 N. This bare minimum result is achieved by using a tool with a probe diameter of 4.5 mm, probe height of 2.5 mm, and shoulder diameter of 16 mm. The F ratio value implies that probe diameter is the most crucial element in a force reduction.
4.5. Impact of FSW tool parameters on the failure load of joints
It is widely acknowledged that probe and shoulder diameter significantly impact the FSW joints’ mechanical characteristics, such as their tensile characteristics [Citation31]. Because of friction, the tool’s shoulder diameter directly impacts the amount of heat produced during FSW. The friction heat generation will increase with increased tool shoulder diameter due to an increase in contact area [Citation32].
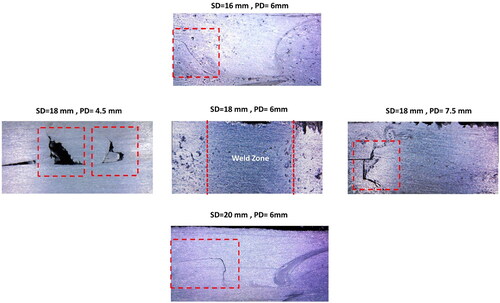
shows the failure load of joints for various tool parameters using 3D surface plots and contour plots. Compared to the joints welded by the tools with shoulder diameters of 16 mm and 20 mm, the welds created by the tools with an 18 mm shoulder diameter (D/d = 3) have demonstrated higher tensile characteristics. These outcomes may be explained by the fact that the process produces less heat at lower D/d ratios. This heat generation is unable to create the right environment for improved material mobility. In order to investigate the joint at low magnification, photos were taken of the cross-section of the welds produced with different probe and shoulder diameters to inspect the weld region quality (). As shown using the tool with a shoulder diameter of 18 mm and a probe diameter of 6 (D/d = 3), the joint is found to be defect free. At D/d less than 3, cracks are observed in the welding area. With greater D/d ratios, extra heat is produced, which causes a turbulent form of material flow, according to Saravanan et al. [Citation4]. They demonstrated how excess heat generation at higher D/d ratios could weaken the weld zone and cause a turbulent material flow between two metals. Due to this poor material mixing, there is a higher chance that a defect would form in the weld zone, which might weaken the joint’s tensile strength. In D/d more than 3, cracks and holes are formed in the welding area (). As a result, an FSW zone with strong metal consolidation and without no welding defects can be obtained through tool optimization. It can be said that one of the crucial aspects of welding tool design is the D/d ratio. The failure load of joints increases up to a D/d ratio of 3, beyond which it starts to decline. This ratio directly affects how much heat is produced, which in turn affects how quickly the material flows through the stir zone and, ultimately, how strong the joints are.
Figure 9. Response surface and contour plots of temperature against pin diameter, pin height, and shoulder diameter.
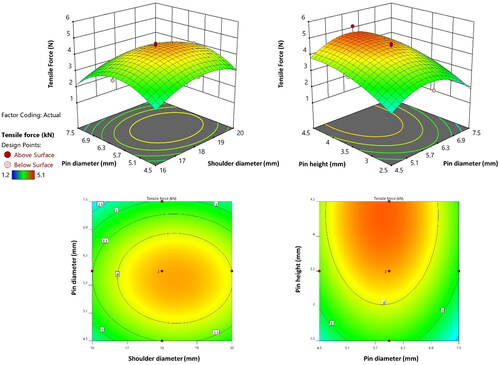
Figure 10. Macrostructure and defects of joints with different tool parameters.
displays the weld’s tensile characteristics for various probe heights. This graph makes it clear that raising probe height increases failure load. This outcome may be explained by the requirement that, in lap welding, the FSW tool probe enters the bottom plate through the top plate in order to form a strong junction between the two plates. Additionally, increasing the probe height improves the bonding areas’ interface size and penetration depth into the bottom plate.
The maximum practicable failure load value is determined to be 5.1 kN, which is achieved using the tool with a probe diameter of 6 mm, a shoulder diameter of 18 mm, and a probe height of 4.5 mm. According to the F ratio value, probe height is the most crucial element in the failure load value. When compared to other parameters, welding is improved by lengthening the pin because it enhances welding depth and material mixing. Increasing the pin length increases the welding depth and the amount of material mixing, which improves the welding compared to other parameters.
4.6. Multiobjective optimization using NSGA-II
The objective functions are frequently at odds with one another when tackling multiobjective optimization issues. This implies that when one function improves, the other will become less effective. Thus, all objective functions cannot be simultaneously seen at their best state. As a result, no single answer can simultaneously optimize all of the objectives [Citation33]. The Pareto optimal point concept is applied to optimize all goals simultaneously. It is impossible to optimize the Pareto front’s responses in terms of one goal before at least one other goal deteriorates. The points known as Pareto points are those that are not dominated by any other point [Citation9,Citation19]. This study uses Matlab software to find Pareto points using the NSGA-II algorithm. Functions will not combine into a single function in a multiobjective genetic algorithm; instead, each one will be optimized independently. A multiobjective optimization approach was used to determine the optimum values of the process, such as the failure load and applied force, using the relationship between the input and output parameters obtained by RSM. These variables (failure load and force) had to be simultaneously optimized with regard to the tool variables of shoulder diameter, probe diameter, and probe height. The optimization problem can be formulated as follow:
(6)
(6)
The corresponding Pareto front of the two objectives is shown in . It is evident that multiobjective optimization produced a number of nondominated solutions. In manufacturing processes, only one optimal parameter is needed to produce the product; hence one of the Pareto optimal solutions must be selected as the best choice. Depending on the specified criteria, an optimal parameter was chosen from Pareto solutions using the TOPSIS approach. In the TOPSIS technique, the positive ideal solution (S+) and the negative ideal solution (S-) are first specified, and the optimal compromise solution is then introduced as the response that is closest to the positive ideal solution and the farthest from the negative ideal solution among the Pareto points.
Figure 11. Optimization result (Pareto front).
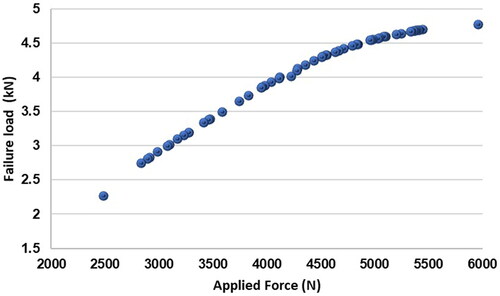
For the TOPSIS to find the best compromise response, it is critical to weigh each objective according to its significance. Because the failure load is more important than the applied force, this objective is given greater weight than the applied force. The applied force was given a weight of 0.3, and the failure load was given a weight of 0.7. In this experiment, the optimum compromise option has a probe diameter of 5.1 mm, a shoulder diameter of 17.63 mm, and a probe height of 3.86 mm at w = (0.3, 0.7).
5- Conclusion
The current study conducted multiple experiments to determine how the critical tool parameters affect the applied force, temperature, and failure load in aluminum friction stir lap joining. The probe diameter, probe height, and shoulder diameter are the most critical tool parameters, and they alter at three separate levels. RSM was used to forecast the responses after the regression model was built. Regression equations were used to establish the associations between the input and output variables. Finally, the best process parameters are determined using a hybrid optimization method. In conclusion, the following findings were made:
The results showed that the length of the tool pin has the greatest effect on the tensile strength of the weld compared to the diameter of the pin and the shoulder of the tool. By increasing the pin length, the welding depth and the amount of material mixing increases, which improves the welding compared to other parameters.
The results showed that the force on the tool increases with the increase in the diameter of the probe and shoulder, as well as the length of the probe.
By increasing the shoulder diameter, the force on the tool increases, but compared to the diameter of the tool’s pin, it has less effect on the force, which is due to the softening of the material due to more heat produced when the shoulder diameter increases. This more heat produced partially compensates for the increased resistance force due to the increased diameter of the tool shoulder.
The welds produced by the tools with an 18 mm shoulder diameter (D/d = 3) have shown greater tensile properties when compared to the joints welded by the tools with shoulder diameters of 16 and 20 mm. These results could be attributed to the process producing less heat at lower D/d ratios. This heat generation is unable to create the right environment for improved material mobility. With greater D/d ratios, extra heat is produced, which causes a turbulent form of material flow, resulting in poor material mixing, and a higher chance that a defect formed in the weld zone
The optimum compromise option has a probe diameter of 5.1 mm, a shoulder diameter of 17.63 mm, and a probe height of 3.86 mm at w = (0.3,0.7)
Disclosure statement
No potential conflict of interest was reported by the author(s).
References
- Akbari M, Asadi P. Simulation and experimental investigation of multi-walled carbon nanotubes/aluminum composite fabrication using friction stir processing. Proc IMechE Part E. 2021;235(6):2165–2179.
- Rabe P, Schiebahn A, Reisgen U. Deep learning approaches for force feedback based void defect detection in friction stir welding. J Adv Join Process. 2022;5:100087.
- Yaknesh S, Sampathkumar K, Sevvel P, et al. Generation of force and torque during joining of AZ91C plates by FSW under distinctive tool tilt angle and their impact on mechanical strength and micro-structure. J Adhes Sci Technol. 2022;1–20.
- López EAT, Ramirez AJ. Effect of process parameters in obtaining aluminium–steel joints and their microstructure by friction stir welding (FSW). Weld Int. 2015;29(9):689–697.
- R C, A A, A S, et al. Prediction of relationship between angular velocity to the pitch line velocity (ω/v) on tensile strength of friction stir welded AA2014-T6 aluminium alloy joints: angular velocity to pitch line velocity ratio on FSW joints. Forces in Mechanics. 2021;4:100036.
- Rajendran C, Kumar MV, Sonar T, et al. Investigating the effect of PWHT on microstructural features and fatigue crack growth behavior of friction stir welded AA2024-T6 aluminum alloy joints. Forces in Mechanics. 2022;8:100107.
- Asadi P, Mirzaei M, Akbari M. Modeling of pin shape effects in bobbin tool FSW. Int J Lightweight Mater. 2022;5(2):162–177.
- Akbari M, Asadi P. Dissimilar friction stir lap welding of aluminum to brass: modeling of material mixing using coupled Eulerian–Lagrangian method with experimental verifications. Proc IMechE Part L. 2020;234(8):1117–1128.
- Asadi P, Akbari M, Karimi-Nemch H. 12 – Simulation of friction stir welding and processing. In: Givi MKB, Asadi P, editors. Advances in friction-stir welding and processing. Cambridge: Woodhead Publishing; 2014. p. 499–542.
- Bonome EC, Carletti CB, De Alcantara NG, et al. Friction stir welding – FSW applied to tailored blanks. Weld Int. 2007;21(4):279–283.
- Lu X, Luan Y, Meng X, et al. Temperature distribution and mechanical properties of FSW medium thickness aluminum alloy 2219. Int J Adv Manuf Technol. 2022;119(11-12):7229–7241.
- Anandan B, Manikandan M. Machine learning approach for predicting the peak temperature of dissimilar AA7050-AA2014A friction stir welding butt joint using various regression models. Mater Lett. 2022;325:132879.
- Pietras A, Zadroga L, Lomozik M. Characteristics of welds formed by pressure welding incorporating stirring of the weld material (FSW). Weld Int. 2004;18(1):5–10.
- D’Orazio A, Forcellese A, Simoncini M. Prediction of the vertical force during FSW of AZ31 magnesium alloy sheets using an artificial neural network-based model. Neural Comput Appl. 2019;31(11):7211–7226.
- Khan NZ, Bajaj D, Siddiquee AN, et al. Investigation on effect of strain rate and heat generation on traverse force in FSW of dissimilar aerospace grade aluminium alloys. Materials. 2019;12(10):1641.
- Su H, Wu C. Determination of the traverse force in friction stir welding with different tool pin profiles. Sci Technol Weld Join. 2019;24(3):209–217.
- Morisada Y, Fujii H, Kanda K, et al. Evaluation of friction stir welding tool using wettability. Weld Int. 2018;32(7):469–474.
- Takai H, Ezumi M, Aota K, et al. Basic study of friction stir welding tool life-investigation for increase of FSW reliability. Weld Int. 2007;21(9):621–625.
- Akbari M, Asadi P, Besharati Givi MK, et al. 13 – Artificial neural network and optimization. In: Givi MKB, Asadi P, editors. Advances in friction-stir welding and processing. Cambridge: Woodhead Publishing; 2014. p. 543–599.
- Suhin S, Robin Divahar S, Edwin Raja Dhas J, et al. Optimizing FSW process parameters using RSM and regression analysis for similar and dissimilar aluminium materials. Mater Today. 2022;64:368–373.
- Kalil Rahiman M, Santhoshkumar S, Mythili S, et al. Experimental analysis of friction stir welded of dissimilar aluminium 6061 and titanium TC4 alloys using response surface methodology (RSM). Mater Today. 2022;66:1016–1022.
- Ruskin Bruce A, Prem Kumar P, Arul K, et al. Experimental characteristics and optimization of friction stir welded AA5052-AA6061 using RSM technique. Mater Today. 2022;59:1379–1387.
- Chabbi A, Yallese MA, Nouioua M, et al. Modeling and optimization of turning process parameters during the cutting of polymer (POM C) based on RSM, ANN, and DF methods. Int J Adv Manuf Technol. 2017;91(5–8):2267–2290.
- Ahmadi S, Mesbah M, Igwegbe CA, et al. Sono electro-chemical synthesis of LaFeO3 nanoparticles for the removal of fluoride: optimization and modeling using RSM, ANN and GA tools. J Environ Chem Eng. 2021;9(4):105320.
- Onu CE, Nwabanne JT, Ohale PE, et al. Comparative analysis of RSM, ANN and ANFIS and the mechanistic modeling in eriochrome black-T dye adsorption using modified clay. S Afr J Chem Eng. 2021;36:24–42.
- Venkata Rao K, Murthy P. Modeling and optimization of tool vibration and surface roughness in boring of steel using RSM, ANN and SVM. J Intel Manuf. 2018;29(7):1533–1543.
- Zolghadr P, Akbari M, Asadi P. Formation of thermo-mechanically affected zone in friction stir welding. Mater Res Express. 2019;6(8):086558.
- Shojaeefard M, Akbari M, Asadi P. Multi objective optimization of friction stir welding parameters using FEM and neural network. Int J Precis Eng Manuf. 2014;15(11):2351–2356.
- Marzbanrad J, Akbari M, Asadi P, et al. Characterization of the influence of tool pin profile on microstructural and mechanical properties of friction stir welding. Metall and Materi Trans B. 2014;45(5):1887–1894.
- Akbari M, Asadi P. Effects of different cooling conditions on friction stir processing of A356 alloy: numerical modeling and experiment. Proc IMechE Part C. 2022;236(8):4133–4146.
- Akbari M, Asadi P, Behnagh RA. Modeling of material flow in dissimilar friction stir lap welding of aluminum and brass using coupled Eulerian and Lagrangian method. Int J Adv Manuf Technol. 2021;113(3–4):721–734.
- Vijayavel P, Balasubramanian V, Sundaram S. Effect of shoulder diameter to pin diameter (D/d) ratio on tensile strength and ductility of friction stir processed LM25AA-5% SiCp metal matrix composites. Mater. Des. 2014;57:1–9.
- de Moura MVF, Marques LS, Barbosa BHG, et al. Multiobjective genetic algorithm applied to inverse finite element analysis: t-joint welding case study. Weld Int. 2021;35(7–9):269–280.