
 ?Mathematical formulae have been encoded as MathML and are displayed in this HTML version using MathJax in order to improve their display. Uncheck the box to turn MathJax off. This feature requires Javascript. Click on a formula to zoom.
Abstract
The liquid metal embrittlement (LME) severity is a significant concern in the fusion welding of Zn-coated steel. The LME severity in galvannealed (GA) interstitial free (IF) steel processed through microplasma arc welding (MPAW) is investigated. The weld geometry, microstructure and mechanical properties of the 0.8 mm thin butt-welded structure are evaluated to check the welding quality. Optical microscopy and field emission scanning electron microscopy (FESEM) of the weld surface are considered to observe any LME cracks. The high-temperature tensile test is executed on GA-IF steel to simulate external stress-free MPAW conditions. The ultimate tensile strength of the welded joint is more than that of the base material, and it is LME-free, which signifies that the current MPAW system can be successfully used for joining GA-IF steel. The microstructure of the weld zone is having large grain structure and much more hardness than the base material. Even the high-temperature tension test does not show any LME cracks. Approximately, one-third of yield strength is reduced as the temperature rises from 600 °C to 700 °C. Overall, the parametric domain for MPAW of GA IF steel is successfully evaluated, which can produce any LME-free weld.
1. Introduction
Interstitial-free (IF) steels are essential for application in the automobile industry due to their high ductility, excellent deep drawability and machinability. This steel has a low percentage of carbon (<0.005 wt. % C) and nitrogen, which helps with antiaging properties and fading of surface refraction of the automobile body. Zinc coatings are provided to augment corrosion resistance; however, it augments the liquid metal embrittlement (LME) severity during welding. Moderate brittleness due to low carbon content martensite in the weld zone and the possibility of softening effect of the heat-affected zone (HAZ) are the critical challenges encountered while welding these steels.
LME is a phenomenon of reduction in ductility of typically yielding metals in contact with liquid metals. Specific solid–liquid couples experience LME influenced by the composition of participating elements, the solid’s metallurgical state and the exposure conditions. A critical temperature range exists for every LME-specific solid–liquid metal system over which the embrittling liquid impairs the metal’s ductility and is known as ductility trough temperature range [Citation1]. In zinc-coated IF steel, the low melting point Zn melts earlier than steel melts and acts as a liquid metal embrittle to cause any LME cracks. A catastrophic failure of the weld joint may occur due to LME, where the mechanism is not well understood to date. Most researchers have tried to explain the effect of various parameters on liquid embrittlement by performing hot tensile tests. The liquid zinc penetrates through grain boundaries at suitable temperatures and stress conditions and causes LME crack. However, there is a lack of deterministic prediction of LME in steel that varies with process conditions, types of materials, nature of the coating and the state of temperature and stress. The diffusion through the grain boundary is mainly responsible for the Zn penetration [Citation2]. At the temperature range of 600 °C to 1000 °C with a constant strain rate, there is a drastic reduction in tensile strength and ductility of the twinning-induced plasticity (TWIP) steel [Citation3]. With the increase in strain rate, the ductility through the temperature range widens. Increasing holding time lessens Zn embrittlement, and about 30 s holding time tries to regain the entire ductility of the specimen [Citation3]. Here, the formation of intermetallic compounds at the solid steel-liquid Zn interface reduces the availability of low melting point Zn. Nonuniform thermal expansion and contraction, temperature gradient and phase transformation during the weld cycle produce the stresses in the weldment [Citation4]. The nature of tensile stress assists in the crack opening; hence, the LME severity increases with strain rate. At low tensile stress with high testing time, the availability of the liquid zinc reduces. The LME crack propagation at a high strain rate is limited because of the unavailability of liquid metal at the crack tip [Citation5]. Razmpoosh et al. observed that about 80–115% of yield stress is required to form LME cracks by applying external stress in a laser welding system [Citation6].
Few researchers argued that austenite phase content in microstructure influences LME sensitivity. LME sensitivity of dual phase (DP) steels is observed to be lower than TRIP and TWIP steels. TWIP steel has a significantly lower yield strength than TRIP steel, and the austenite content in TWIP steel is higher. Also, high austenitic fractions are associated with TWIP and TRIP steels compared to DP steels. Therefore, the ductility trough broadens as the austenitic component increases in the microstructure. The embrittlement starts in DP steels only above the AC3 temperature, implying that LME sensitivity may emerge after austenitic formation [Citation7]. Jung et al. [Citation8] investigated LME of advanced high-strength steels where major constituent phases were ferrite, ferrite plus martensite, and austenite. The critical stress to start LME corresponds to 0.4% strain at a temperature above 700 °C. It indicates that the LME resistance of all steels is almost similar. It is postulated that the liquid metal penetration is intergranular, and there is some incubation period for liquid metal to reduce the tensile strength sufficiently [Citation9]. For steels, the ductility through temperature range lies between 600 °C and 900 °C, which is well above the melting point of zinc (∼419 °C). It indicates that for the LME phenomenon to happen, sufficient liquid metal should be present for proper wetting. However, the formation of intermetallic compounds (Zn and Fe) reduces the availability of liquid Zn to cause any LME [Citation10]. Bhattacharya [Citation5] showed a reduction in LME severity above the boiling point of zinc (907 °C) during the hot tension test of steels at 1000 °C.
Several studies indicate that hot dip galvanized (GI) steels are more susceptible to LME compared to galvaannealed (GA) or electro-galvanized (EG) Zn-Ni coating since GA is subjected to an additional process of annealing at a temperature of roughly 500 °C, resulting in an entirely alloyed coating with Fe-Zn intermetallic. The LME susceptibility also depends on the melting temperature of the coating. GI (Fe-Zn) coating has a lower melting point than GA (Fe–Zn) and EG (Zn–Ni) coatings [Citation11]. A lower melting point alloy allows more liquid Zn to be available for embrittlement. Compared to GI-coated steels, this could significantly lower the risk of LME in GA steels [Citation1].
There is a drastic reduction in static strength due to LME cracks for TRIP1100 (about 43.5%) compared to DP980 and TRIP690 steels [Citation12,Citation13]. Ghatei et al. [Citation14] show the presence of Zn near the LME crack and confirms the fully ferritic structure near the crack region in the resistance spot welding (RSW) process. In RSW, solid-state zinc diffusion drives the LME crack that usually occurs at a considerably shorter welding time before reaching the expulsion limit. There is a significant reduction in the number and average depth of cracks when electrode force is higher, welding current is lower, and total weld cycle time is low [Citation15]. The increasing electrode holding time suppresses LME crack formation for two and four stack-ups of DP and mild steel [Citation16]. The dome-type electrodes produced a higher percentage of cracks than the flat-type electrode with the same welding conditions. To avoid LME cracks, a short pre-current with a magnitude less than the primary current may melt away zinc coating before forming the weld nugget [Citation15]. The LME in RSW is also suppressed by using interlayers of aluminum between TRIP 1100 and TRIP 1200 sheets of steel [Citation17]. The Al forms a protective intermetallic layer. The liquid Al-Zn mixture reduces Zn’s availability for further crack propagation. DiGiovanni et al. [Citation18] show the reduction of LME cracks during RSW by ramp-down current instead of constant current for the weld cycle. Here, an excellent current profile can reduce the liquid Zn availability in the weld shoulder region. Khosravi et al. [Citation19] performed resistance seam welding of IF steel in an automotive fuel tank. The GA sheet requires a lower welding current than to weld GI sheet to achieve equal joint strength. The increased welding current leads to an improvement in heat input and increases grain size. It promotes the susceptibility to brittle fracture. The LME severity is more significant in the case of RSW, where the sample is subjected to compressive stress and a high-temperature state.
The analysis of LME severity is equally important for fusion welding processes, and very few works have been reported in the literature. During gas metal arc welding (GMAW) of GI steels and stainless steels, cracks up to 3 mm in length are produced in HAZ, and they have an intergranular character with the presence of Zn near cracks [Citation20]. Here Zn vaporizes and condenses on the austenitic stainless steel. The EBSD results showed that the LME crack propagated intergranular along the previous austenite high-angle boundaries [Citation6]. The LME crack propagates before the martensite transforms during the cooling cycle. Razmpoosh et al. [Citation21] also showed that HABs significantly influence the liquid metal penetration path in Fe – Zn LME couple. The liquid metal mainly penetrated through grain boundaries of high-index planes. Grain boundary oriented along (5 3 1) has the highest LME susceptibility; about 45% of liquid penetrated through this grain boundary despite its volume of 18% of the overall grain boundary. The laser welding of Zn-coated steel indicates that HAZ contains a martensitic phase, whereas pearlite and bainite are precipitated for micro-alloyed steel and only the bainite phase for low-carbon steel [Citation22]. In summary, conventional GMAW and simulated laser welding produce the LME cracks for Zn-coated steel [Citation6,Citation20,Citation21]. The laser heating was performed during the deformation of the tensile specimen to simulate the LME condition experimentally. In contrast, the conventional laser welding of Zn-coated steel does not produce any LME cracks, as reported by Zdravecká [Citation22]. It is evident from the literature that fusion welding may create any LME severity without applying external stress.
Although micro-plasma arc welding (MPAW) is a widely used joining method for very thin sheets, the work on coated steel is not observed. The primary motive is to apply MPAW to join very thin sheets, which is advantageous over laser welding in terms of cost, and MPAW creates a concentrated arc next to the laser source. The secondary objective is to produce quality joints where LME is a concern for Zn-coated steel. Batool et al. [Citation23] analyzed weld characteristics of MPAW and tungsten inert gas welding (TIG) of 0.8 mm thick stainless steel sheet (304 L). There was no appreciable change in hardness during MPAW, and joint efficiency was more than 100%. Tseng et al. [Citation24] showed a constant weld penetration to width ratio for stainless steel at smaller standoff distances; however, a slight reduction in the ratio is observed with an increase in standoff distance. Baruah and Bag [Citation25] showed with an increase in heat input, the bead width increases slowly and reaches a steady state position for MPAW of titanium alloy. Sahu and Bag [Citation26] analyzed the effect of pulse current on weld morphology in the MPAW of Inconel 718. The microstructure of the fusion zone has been refined significantly because of the current pulsation. A ductility enhancement of 47% is observed in the pulse current mode over the continuous current mode. Dwibedi and Bag [Citation27] studied MPAW of different thicknesses (0.6 mm and 0.8 mm) of dissimilar stainless steels. The fracture mode shifts from ductile to mix mode as heat input increases due to micro/macro voids and reduction in corrosion resistance (Cr). Prasad et al. [Citation28] indicated that the grain diameter fluctuation is influenced by the cooling rate and heat distribution region for MPAW of stainless steel. The welding speed, viz., heat input per unit length, was the most influential factor in grain size control.
It is evident that LME is a significant concern when joining zinc-coated steels and needs further research. The thermomechanical studies show a specific temperature range and critical stress for LME to occur. Since zinc and steel are known to be LME couples, embrittle cracks may generate under favorable conditions and must be avoided for a sound weld. Most of the research on coated steels is aligned with the application of RSW. However, other fusion welding processes are also prone to LME cracks due to their similar temperature range and thermal stress conditions. Literature indicates that the LME severity is not exclusively studied for MPAW. Usually, LME is studied for advanced high-strength steel considering their strength factor. Limited studies are available for Zn-coated IF steel related to LME, which needs further exploration. Hence, the present investigation illustrates the LME severity of Zn-coated IF steel during MPAW. The proper welding parameters are evaluated to obtain complete penetration and weld strength close to base material strength. The tensile test at high temperature is evaluated for Zn-coated IF steel to create an environment of high temperature and thermal stress conditions.
2. Materials and methods
The primary process parameters for MPAW are current and welding speed. Hence, these two parameters are varied in the design of experiments (DOE). The test samples are prepared after conducting the welding operation. The test coupons are evaluated for micro-hardness, ultimate tensile strength (UTS), yield strength, and elongation. Several cross-sectional areas of welded samples are also observed closely to identify any LME severity, which might occur when joining cold-rolled and annealed GA-IF (interstitial free) steel of 0.8 mm thin sheet. The zinc coating of 60 gm/m2 is present on the IF steel.
An MPAW system with a linear movement platform is used in the present study. The current range of 0.1 A–21 A DC power supply is used for the experiment. A thoriated tungsten electrode (diameter of 1.2 mm) is utilized in conjunction with a copper nozzle of diameter 1.6 mm. Argon gas is employed as both plasma and shielding gas with a flow rate of 0.6 LPM and 5 LPM, respectively. The secondary parameters used in the MPAW are reported in . The experimental setup is depicted in .
Figure 1. Micro plasma arc welding setup used for experiments.
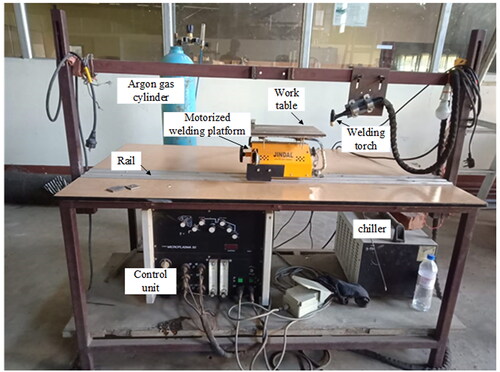
Table 1. Parameters of MPAW used in the present investigation.
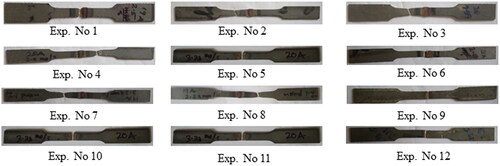
The workpiece moves with uniform speed using the motorized worktable. The square butt joint configuration of Zn-coated IF steel sheets of 100 × 80 × 0.8 mm3 is prepared. Sheets are held in position with the support of a copper fixture to influence the rate of heat transfer. Alignment is very significant for a 0.8 mm thick sheet. Edges are prepared using emery paper and acetone to remove any dirt or oil, and the minimum gap is maintained between the two plates. The welding direction is followed perpendicular to the rolling direction of the sheet. DCEN polarity is applied for welding. Initially, a starting arc is used to check the alignment of the joint, and later the plasma gas is pumped to generate the actual arc. The design of experiments (DOE) is performed based on Taguchi orthogonal array statistical technique using only two parameters: welding current and speed. Initially, the trial experiments were conducted to find a suitable range of primary and secondary parameters for welding of 0.8 mm sheet. The selected range of control factors and their levels are depicted in . This study uses a full factorial design matrix with two components and three/four varied levels. depicts the appearance of the welded samples for a few experimental conditions. It indicates continuous welding with proper surface texture. No visual defects are observed in the butt joint. With an increase in heat input, the width of the weld zone is broadened. The combined effect of welding power and velocity is represented by heat input per unit length as
(1)
(1)
where V is voltage, I is current, and v is welding speed. Here the combined effect of primary welding parameters is accounted for by the heat input parameter assuming thermal efficiency is the same for all welding conditions.
Figure 2. Top surface appearance of weld bead at heat input of (a) 200 J/mm, (b) 190 J/mm, (c) 181 J/mm, and (d) 140 J/mm.
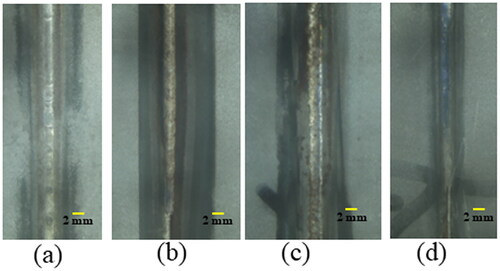
Table 2. Control variables and orthogonal array used in DOE.
shows control variables and their various levels used in DOE.
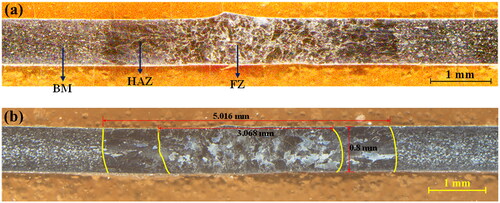
The test specimens are prepared according to the dimension of 16 × 4 × 0.8 mm3 using wire EDM cut that follows ASTM E8 standard. The cross-sections of the welded samples are prepared with a standard metallography process. In the case of IF steel, Nital (5%) is used as an etchant. The polished samples are entirely dipped in this etchant for 15 s and cleaned using water, followed by drying. It is obvious that the amount of fused base material is determined by the heat input, which in turn determines the weld bead characteristics. The weld macrostructure is shown in , which consists of a fusion zone (FZ), heat-affected zone (HAZ), and unaffected base metal (BM). The full-depth penetration is achieved without any sagging for a wide FZ. The FZ extends ∼3 mm, and the size of HAZ is 1 mm. The temperature experienced and the cooling rate determines the final structure and phase in each region.
Figure 3. Typical weld zone corresponding to the experimental condition of 20 A, 2.9 mm/s (172 J/mm): (a) macrograph and (b) microstructure.
The uniaxial tension test is performed with a crosshead speed of 1 mm/min. Usually, transverse weld test specimens are used in which the weld metal, HAZ, and base metal are located in the gauge section, and an identical load is applied throughout. A Vickers microhardness testing equipment (136° included angle) is used for testing the microhardness of the prepared samples. The test is carried out at 200 g load for 15 s of dwell time. After an impression is made using a diamond indenter, the length of diagonals is measured using an optical microscope attached. The etched sample is observed first through a stereo-zoom microscope. The entire cross-section is thoroughly observed to check for any cracks present in the specimen. The microstructure is further studied using an optical microscope. The entire specimen surface is scanned at higher magnification to check the presence of any micro cracks. The microstructure of the samples is examined using a field emission electron microscope (FESEM). The average grain size is measured using the linear intercept method from an optical image.
2.1. High-temperature tensile test
The elevated temperature tension test is a reliable method to calculate the mechanical behavior of materials at a higher temperature. An additional setup of the furnace is attached with the UTM. The furnace temperature is maintained at the test temperature throughout. The test is performed on the 250 kN UTM (Make: BISS, Model: MEDIAN- 250 UT-04-0250). The usual 100 mm tensile specimen is insufficient for a high-temperature test since the furnace has a depth of around 150 mm. So tensile specimen of 200 mm in length is extracted according to ASTM-E-646-98-standard. The high-temperature test of Zn-coated IF steel is performed at 600 °C, 700 °C, and 725 °C on both the coated and uncoated specimens. The temperature range is selected based on ductility through temperature range, where LME usually is expected to happen. The uncoated sample is prepared by immersing the specimen in the muriatic acid (37% HCl) solution for 12 h. The glass wool is used to keep the specimen insulated. The test temperature is set using a furnace control system. The heating rate is around 10 °C/min. The test is performed at a crosshead speed of 2 mm/min.
3. Results and discussions
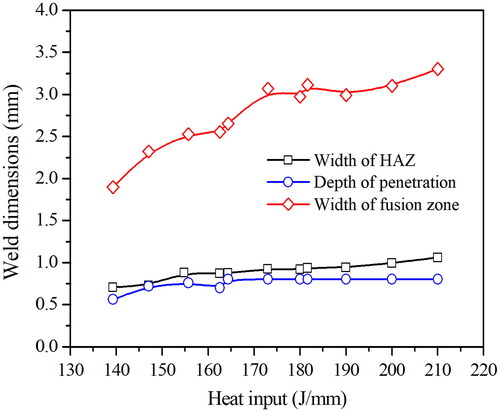
The measured weld geometry, tensile properties, microhardness distribution, grain structure, and hot tensile test behavior are analyzed on account of any LME severity of Zn-coated IF steel. The width of the fusion zone, penetration depth, and the width of HAZ corresponding to heat input are depicted in . The top width of the fusion zone is only considered, and the width of HAZ refers to the average of the left and the right side. The weld dimension increases with increased heat input since more heat is absorbed in either a high current or at a low welding velocity. The width of the fusion zone increases rapidly at low heat input and gradually reaches a quasi-steady state. A dynamic balance exists between heat input and heat loss for a defect-free weld. With an excessive heat input, the defective weld is produced with a sagging profile. However, the rate of increment of HAZ with heat input is relatively less since the temperature difference in HAZ much less than in FZ. In FZ, more heat is dissipated if superheating is much more for a high heat input condition. Therefore, a critical amount of heat input (∼210 J/mm) creates a sound weld. The variation of weld depth with heat input is shown in . The weld depth grows with an increase in heat input and reaches the equal of sheet thickness. Some deviations from the general trend may be due to challenges encountered while welding thin sheets. It includes (a) the weld line should be ideally in line with the electrode; otherwise, it will result in improper fusion; (b) the alignment of sheets should be free of tilt and bends; otherwise, it will result in abnormal welding. These may cause slight variations in the width of the fusion zone, the width of HAZ, and the penetration depth.
Figure 4. Variation of weld dimensions and HAZ with heat input per unit length.
3.1. Effect of process parameters on weld bead geometry
The variation of weld bead geometries with welding current and speed is shown in . The width of the fusion zone increases with an enhanced welding current and a reduced welding speed. Both these opposing parameters have a direct influence on the heat input per unit length. As this heat input increases, more metal is fused, increasing the weld dimensions. The variation in the width of HAZ is also the same as the variation in the width of FZ.
Figure 5. Variation of the width of FZ and HAZ with (a) welding current and (b) welding speed.
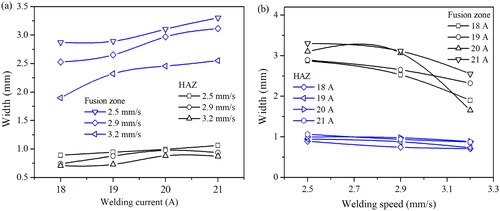
The width of HAZ increases with an increase in current and a decrease in welding speed. The general trend of changing weld dimensions and HAZ are not linear. The change is more gradual for HAZ than for FZ. The temperature gradient for creating HAZ is much less than FZ. This variation cannot be observed here as the penetration depth has already reached its maximum value of plate thickness.
3.2. Macro and microstructural characterization of welded joints
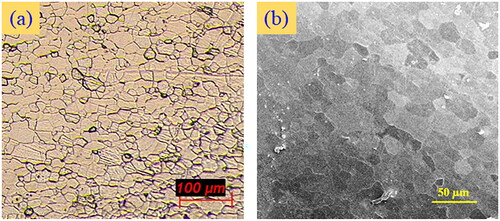
The Base metal microstructure of IF steel observed through an optical microscope and FESEM micrograph is shown in . The base metal microstructure consists of equiaxed ferrite grains with an average grain size of ∼18 µm. However, the grains are a little elongated along the rolling direction. The rolling direction makes a slope of ∼1 with reference to . For all the cases, the welding velocity vector is perpendicular to the rolling direction. The average aspect ratio of the elongated microstructure is ∼0.55.
Figure 6. Base material microstructure: (a) optical micrograph and (b) FESEM micrograph.
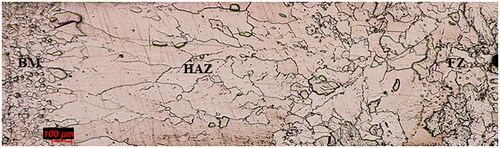
The entire microstructure of the weld section is shown in . There is a significant variation in grain size after solidification and solid-state phase transformation as compared to a fine-grained base material. show a magnified view of HAZ and FZ microstructure. The size of grains in the HAZ increases drastically in comparison with the base material. The FZ grain size is in between the size of base metal grains and HAZ grains. The columnar-type grain structure in HAZ is grown and orientated outward from the weld pool boundary. Because the highest temperature gradient sustains normal to the grain boundary, and the high-temperature zone near BM promotes bigger grains in this part of the HAZ. This causes the austenite grains to enlarge, and the massive austenite grains eventually turn into larger ferrite grains during cooling [Citation29]. The local thermal gradient, G, and the displacement rate of the Ar3 isotherm, R (Ar3 is the beginning temperature of austenite to ferrite transformation), are the parameters to control the solidification behavior. Here, G exceeds R and indicates that the grains in the HAZ are urged to excessive grain growth [Citation30]. The difference between G and R-values grows away from the weld pool and towards the BM. When G exceeds R, the accumulation of heat causes a temperature higher than the melting temperature of the material. Depending on the cooling rate, the direction of heat transfer, and the composition of the material, the fusion zone microstructure may be varied. In the thickness direction, the temperature gradient is less than in the transverse direction. Therefore, a wide variety of grain sizes is observed along the transverse direction. The average measured grain sizes of FZ and HAZ are ∼400 µm and ∼110 µm, respectively.
Figure 7. Microstructure of entire weld region at welding condition of 21 A, 2.5 mm/s.
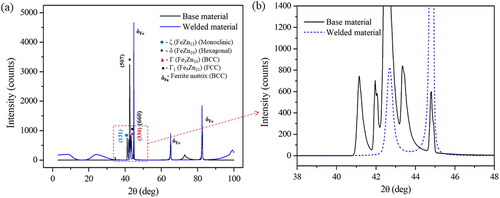
X-ray diffraction (XRD) analysis is performed on the base material and welded specimen. The diffraction patterns are shown in . The analysis is performed using Cu Kα radiation having a wavelength of 1.54 Å. In both cases, peaks are observed at 2Ɵ values of 44.78°, 65.12°, and 82.4°. In the welded sample, there is one peak at 42.7°. In base material, there are several peaks in the 2Ɵ range of 41.14° to 44.8°. These are due to the presence of Fe-Zn intermetallic formed by Zn coating over steel. The main intermetallic compounds in Fe-Zn are gamma (Γ1), gamma (Γ), delta (δ), and zeta (ζ) phases, and their maximum intensity are witnessed at 42.59°, 42.63°, 42.22°, and 41.50° in the plane of (660), (330), (507) and (131) respectively [Citation31]. The peaks corresponding to 2Ɵ values of 44.78°, 65.12°, and 82.4° are related to the ferrite phase of steel having a BCC crystal structure and shown in . The multi-peaks are more clearly visible in . It can be observed that the intensity of these peaks is low in coated specimen compared to the welded sample. The zinc coating might act as a filter to reduce peak intensity in the case of the base material.
Figure 8. (a) XRD pattern of base material and a welded sample of GA IF steel at 21 A, 2.5 mm/s; (b) Zoomed view of multiple peaks.
3.3. Mechanical properties of welded joints
The tensile tests are performed to check the weld quality, where two samples are considered for each welding condition. The elongation results from these tests can be used as an indicator for checking LME since the reduction in ductility is the primary indication of LME fractures. The stress-strain graphs of the welded samples and base material are shown in . It is observed that for the coated steel, the tensile strength is higher, and elongation is close to base materials for a few samples. However, in a few cases, the strength properties are inferior. Hence, further segregation of parameters is required that produce a good-quality weld joint. All the strength properties and elongation are analyzed as a function of heat input per unit length (). Overall, all these increase with heat input. A partial penetration to full-depth penetration achieves with an increase in heat input. Further, increased heat input reduces the temperature gradient along the depth direction. The grain size variation or gradient along the depth direction gradually reduces with increased heat input. Therefore, the strength and elongation usually enhance up to a limiting value of heat input. Further, an increase in heat input creates the sagging of the welded sheet and creates a geometrical defect. At meager heat input, the strength properties are inferior. Hence, the elongation below 165 J/mm is not of acceptable quality. However, the critical value of heat input can be considered as 180 J/mm for the present set of experiments. A good combination of strength and elongation is achieved at this heat input. Beyond this heat input, the strength and elongation improve and are of acceptable quality.
Figure 9. (a) Stress-strain diagram of various welding conditions; (b) variation of mechanical properties with heat input.
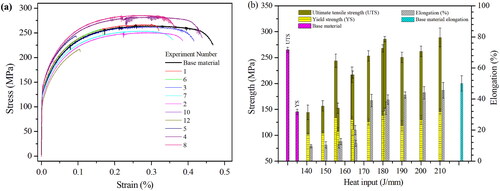
Figure 10. Fracture location of tensile test samples.
It can be seen that except in welding conditions of 3.23 mm/s (low heat input), in all other cases, the weld strength is nearly equal to or more than the maximum strength of the base metal. The yield strength also shows similar variation. In the case of elongation, the base metal has the highest elongation, but in a best-case scenario, the elongation of welded specimen reaches about 91.3% with respect to the base material. The ratio of strength and elongation of welded samples with reference to the base material is reported in . The reduction in elongation can easily be explained by the fact that during fusion welding, there will be a change in phase in the weld section. While tensile testing, this phase will be strong enough to hold applied stress but not ductile as a base material which eventually reduces the total elongation of the welded specimen. The tensile test results show that proper MPAW of GA-IF steel sheets can be obtained in the welding current of 19–21 A and welding speed of 2.5–2.89 mm/s at the secondary parameter setting depicted in .
Table 3. Weld joint efficiency in terms of strength and elongation.
The images of tested tensile specimens are shown in . It is obvious that the fracture occurs in base material at relatively high heat input where the joint efficiency is above 100%. The failure occurs in HAZ at moderate heat input, and at low heat input, the fracture occurs at the fusion zone. It seems at low heat input, the presence of Zn, at least a small amount creates the inhomogeneous microstructure or the intermetallic at the fusion zone. However, the low melting point Zn may vaporize from the weld zone at a relatively high input. Away from the fusion zone, the Zn intermetallic may form at high heat input conditions.
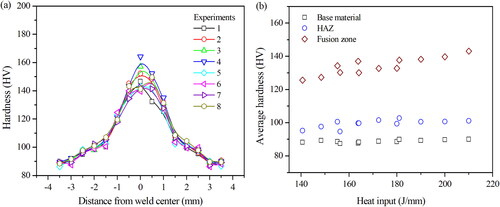
The variation of hardness along the weld cross-section is shown in . The microhardness of the cross-section is measured along a straight line with a distance of 0.3 mm between two adjacent indentations. The highest and lowest hardness is observed in FZ and BM, respectively. The average hardness of BM is around 89 HV, and in FZ, hardness goes up to 164 HV with an average value of 145 HV. In HAZ, the hardness is just slightly above the base material’s hardness. The average value of hardness in this region is 101 HV. The microstructure of both HAZ and FZ contain grains more significant than the base material, but their hardness values are increased in contrast to the fact that coarse grains reduce the hardness value. The FZ and HAZ may be associated with carbide/nitride precipitates of Nb and Ti at the required temperature of these phases. Even there are considerable differences in the microstructure of the BM in comparison to the HAZ and FZ. The BM contains ferrite grains; this phase may change during welding and hard phases such as martensite and bainite are formed, which might increase the hardness [Citation32]. The average hardness values of different regions at different heat inputs are depicted in . It is observed that the hardness values of BM and HAZ remain similar in each of these cases, and the only observed variation is in the hardness value in the FZ. At high heat input, the peak hardness and average hardness values of this zone increase. The highest hardness is achieved for a welding speed of 2.5 mm/s (high heat input). However, the HAZ and FZ hardness is a little low at low heat input.
Figure 11. Average hardness at different welding conditions: (a) variation from weld center at different experiment numbers depicted in , and (b) variation with heat input depicted in .
3.4. High-temperature tensile test
The high-temperature (HT) tensile tests are performed at 600 °C, 700 °C, and 725 °C both on GA-coated and uncoated specimens. These high-temperature tensile tests simulate the high temperature and external stress state where LME might occur. The stress-strain graph of hot tension tests is shown in . It is observed that at 600 °C, the nature of stress-strain diagrams of both bare and Zn-coated IF steel are similar. The bare specimen shows a higher tensile strength value, and the coated specimen shows a higher elongation. The strain-hardening effect is evident for a bare sheet that limits the elongation or strain-softening zone after ultimate tensile strength. However, the strain-softening effect is much more apparent for coated IF steel, where the strain-hardening effect is minimal. For an LME-free weld, the critical amount of liquid Zn does not reach the grain boundary. The minimum amount of liquid Zn at the grain boundary probably creates the grain boundary sliding that usually occurs at ∼0.4 times the melting point temperature of steel. Grain boundary sliding also facilitates the dislocation movement, brings a limited amount of strain-hardening effect, and otherwise extends the strain-softening behavior after reaching the maximum strength value. However, the strength of the bare sheet extends due to the strain hardening effect in the absence of any liquid Zn at 600 °C. The overall area under the stress-strain diagram for both cases is almost similar. It seems both materials have similar toughness. The stress-strain diagram of the HT tensile test performed at 700 °C is quite different. For the bare specimen, the maximum strength is 30.8 MPa compared to a maximum strength of 38.8 MPa in the case of the coated specimen. The bare specimen shows higher elongation compared to the coated specimen. A reduction of 16.7% is observed. The overall area under the stress-strain diagram is almost equal in both cases. Here, high temperature plays a role in deciding the mechanical properties than the presence of Zn coating. With further temperature increases, the strength of both bare and coated steel is reduced. It is evident that as temperature increases, the whole level of the stress-strain graph drops. This implies that the tensile strength decreases as temperature increases. The tensile strength of GA-IF steel was 128.8 MPa at 600 °C, which reduces to 38.5 MPa at 700 °C. A drop of about 69% is observed here. In-room temperature conditions, the tensile strength was observed to be 266.7 MPa. The other noticeable effect is elongation or strain percentage. As temperature increases, the percentage of elongation also increases. Elongation is observed at a 62.3% rise in percentage as the temperature increases from 600 °C to 700 °C. reports the difference in strength and elongations between bare and coated steel.
Figure 12. Stress-strain diagram of HT tensile test at different temperatures.
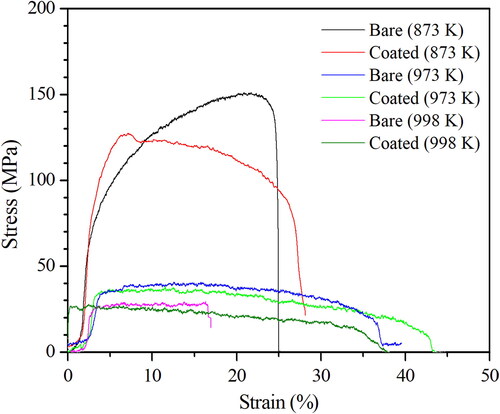
Table 4. Strength properties at elevated temperature of GA-IF steel.
3.5 Discussion on LME severity of GA-IF steel
During the welding of zinc-coated steel, a situation may arise where liquid zinc embrittles the steel beneath the coating and causes brittle failure. In fusion welding, it is quite possible that liquid zinc can result in LME-induced cracks. These LME cracks mainly occur in HAZ because of the favorable temperature and the availability of liquid Zn. It is observed that the Zn coating vaporizes at a high processing temperature of IF steel. However, the welds formed under various welding conditions are examined to determine the susceptibility to the LME cracking phenomenon. However, no cracks are discovered even when the heat input is significant. This is supported by the work of Salimi Beni et al. [Citation29] on the susceptibility of cracking in RSW of galvanized IF steel. No LME cracks were observed under various welding conditions. Jung et al. [Citation8] indicated that enough tensile stress is required for the occurrence of LME above the critical value. In MPAW, only localized stresses due to temperature variation and without any external stresses are not sufficient conditions to initiate any LME crack, unlike RSW. The strength of the steel is another contributing factor to causing any LME crack. With the increased strength of the coated steel, the susceptibility to LME crack enhances [Citation1]. The relatively low flow stress of high-strength low alloy (HSLA) steel is least affected by LME [Citation1]. The strength of GA-IF steels is the lowest compared to other steels. The thermal conductivity is responsible for heat accumulation in the HAZ, and the thermal expansion coefficient is responsible for stress build-up [Citation11,Citation33]. It was observed high manganese austenitic steels are vulnerable to LME cracking due to low heat conductivity and high thermal expansion coefficient (11 W m−1 K−1 and 24 × 10−6°C−1, respectively). However, IF steel has relatively high thermal conductivity (58 W m−1 K−1) and a low thermal expansion coefficient (9.8 × 10⁻⁶°C−1). This promoted a high heat dissipation rate and reduced stress development in the HAZ, suppressing the LME cracking in fusion weld [Citation29].
Overall, the combined effect of the fusion welding process and the choice of material do not produce any LME cracks. In MPAW, the only stress factor is internal thermal stress. The maximum current value used here is 21 A, and the minimum welding speed is 2.5 mm/s. The maximum heat input generated here may not be enough to produce stress levels more significant than the critical stress value required for the LME to occur. Study indicates that as the strength of steel increases, its severity of embrittlement also increases. However, for IF steel, the strength is low, and ductility is high. Even at elevated temperatures, the strength of coated steel is lower than the bare sheet al.l these factors lead to a reduction of LME severity in the present case. The thermal conductivity of IF steel is higher compared to other steel variants, reducing heat accumulation in the weld region. Heat accumulation can influence the overall thermal stress generated in the material. The thermal expansion coefficient is low for IF steel leading to less expansion and less stress generation. All these factors can suppress the LME cracking in MPA-welded GA IF steel sheets.
The HT tensile test at 700 °C shows a ∼16.7% reduction in ductility of coated specimen compared to the bare specimen. This reduction in ductility may be due to the presence of additional zinc coating. indicates that the coating is almost melted away at 700 °C. However, the literature indicates that this temperature range is most favorable for LME of Zn-steel couples, but further studies (like EDX elemental mapping) are required to confirm that Zn embrittlement is the cause of ductility reduction and early fracture. A few images of the weld cross-section of IF steel are shown in . At low heat input (), there is partial penetration, and at moderate heat input (), almost full depth of penetration is achieved for 0.8 mm thin sheet. With proper lagging of support, the weld sample distortion is observed. However, no cracks are visible on the surface and weld cross-section of any of the samples. shows FESEM images of the welded samples at low and high heat inputs. Different phases (mainly carbides) are observed at different positions of the cross-section at a high heat input of 200 J/mm. However, not any micro cracks are observed at high heat input. Similarly, at low heat input (156 J/mm), there are no visible micro-cracks at different positions of the cross-section. indicates the interface between two plates corresponding to partial butt-welding of substrates, which is very much distinct from LME cracks.
Figure 13. Tensile specimen and fracture of HT tensile specimen (7000C).
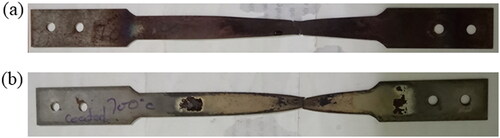
Figure 14. Optical micrographs of welded cross-section (a) 20 A, 3.2 mm/s (156 J/mm), (b) 20 A, 2.5 mm/s (200 J/mm), (c) 21 A, 2.9 mm/s (181 J/mm), (d) 20 A, 2.9 mm/s (172 J/mm).
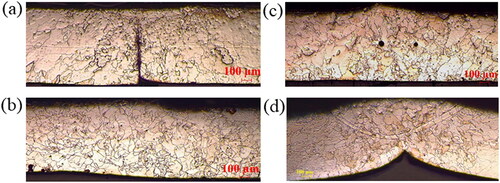
Figure 15. FESEM images of welded samples [(a), (b), (c) corresponds to] 20 A, 2.5 mm/s (200 J/mm) and [(d), (e), (f) corresponds to] 20 A, 3.2 mm/s (156 J/mm).
![Figure 15. FESEM images of welded samples [(a), (b), (c) corresponds to] 20 A, 2.5 mm/s (200 J/mm) and [(d), (e), (f) corresponds to] 20 A, 3.2 mm/s (156 J/mm).](/cms/asset/2a22ba35-4579-4a01-b554-5e438a5efd3c/twld_a_2218562_f0015_b.jpg)
4. Conclusions
MPAW of GA-IF steel sheets is performed with proper design of experiments. The surface and cross-section of welds are thoroughly studied through stereo zoom and optical microscope. Weld bead geometry, microstructure, tensile properties, and hardness are studied at different welding conditions. HT tensile tests are also performed to simulate the LME severity of galvannealed IF steel. The salient findings of this work are presented below.
In the MPAW of GA-IF steel sheets, a full penetration depth is obtained in the considered process window. As heat input increases, the width of the fusion zone, width of HAZ, and depth of penetration are observed to increase.
Weld microstructure shows enlarged grains in HAZ and weld zone compared to the base metal. The average measured grain sizes of base material, fusion zone, and HAZ are ∼18 µm, ∼400 µm, and ∼110 µm, respectively.
The tensile test of welded specimens shows weld strength more than base metal strength in welding conditions in the speed range of 2.5–2.9 mm/s and the current range of 19–21 A. An elongation of 91% is also observed compared to base metal elongation.
The microhardness of the weld section is highest in the fusion zone, followed by HAZ and base material. There is not much variation in the hardness of HAZ as heat input varies—however, hardness increases in the fusion zone as heat input increases.
The HT tensile test shows that compared to coated specimen bare specimen shows a much more strain-hardening effect and lowers total elongation. As temperature increases, there is a reduction in strength and an increase in elongation at fracture.
The welds formed under various welding settings are examined to determine their susceptibility to the LME cracking phenomenon, and no cracks are discovered on the welds. This means the MPAW of GA-IF steel is free of LME for the presented set of primary and secondary variables.
However, more HT tensile tests can be performed at different temperatures and displacement rates to evaluate performance under varying conditions. This analysis may be helpful to evaluate any LME for high-strength steels, where the chances of zinc embrittlement are more.
Acknowledgments
The authors gratefully acknowledge the support from Tata Steel Limited, Jamshedpur, India, for supplying the materials used in this study. The author gratefully acknowledges the computational and experimental facilities provided by the Mechanical Engineering Department of IIT Guwahati, India. Dr. Ajit Kumar Sahu, NIT Rourkela, is gratefully acknowledged for the discussion of XRD results.
Disclosure statement
No potential conflict of interest was reported by the author(s).
References
- Bhattacharya D. Liquid metal embrittlement during resistance spot welding of Zn-coated high-strength steels. Mater Sci Technol. 2018;34(15):1809–1829.
- Razmpoosh MH, Biro E, Chen DL, et al. Liquid metal embrittlement in laser lap joining of TWIP and medium-manganese TRIP steel: the role of stress and grain boundaries. Mater Character. 2018;145:627–633.
- Beal C, Kleber X, Fabregue D, et al. Liquid zinc embrittlement of twinning-induced plasticity steel. Scrip Mater. 2012;66(12):1030–1033.
- Fernandes PJL, Clegg RE, Jones DRH. Failure by liquid metal-induced embrittlement. Eng Failure Analysis. 1994;1(1):51–63.
- Bhattacharya D, Cho L, Marshall D, et al. Liquid metal embrittlement susceptibility of two Zn-coated advanced high-strength steels of similar strengths. Mater Sci Eng A. 2021;823:141569.
- Razmpoosh MH, Macwan A, Biro E, et al. Liquid metal embrittlement in laser beam welding of Zn-coated 22MnB5 steel. Mater Design. 2018;155:375–383.
- Beal C. Mechanical behavior of a new automotive high manganese TWIP steel in the presence of liquid zinc [dissertation]. INSA de Lyon; 2011.
- Jung G, Woo IS, Suh DW, et al. Liquid Zn assisted embrittlement of advanced high-strength steels with different microstructures. Met Mater. Int. 2016;22(2):187–195.
- Ina K, Koizumi H. Penetration of liquid metals into solid metals and liquid metal embrittlement. Mater Sci Eng A. 2004;387–389:390–394.
- Beal C, Kleber X, Fabregue D, et al. Embrittlement of a zinc-coated high manganese TWIP steel. Mater Sci Eng A. 2012;543:76–83.
- Ashiri R, Shamanian M, Salimijazi HR, et al. Liquid metal embrittlement-free welds of Zn-coated twinning induced plasticity steels. Scrip Mater. 2016;114:41–47.
- DiGiovanni C, Biro E, Zhou NY. Impact of liquid metal embrittlement cracks on resistance spot weld static strength. Sci Technol Weld Join. 2019;24(3):218–224.
- DiGiovanni C, Han X, Powell A, et al. Experimental and numerical analysis of liquid metal embrittlement crack location. J Materi Eng Perform. 2019;28(4):2045–2052.
- Ghatei-Kalashami A, Ghassemali E, DiGiovanni C, et al. Occurrence of liquid-metal-embrittlement in a fully ferritic microstructure. Materialia. 2021;15:101036.
- Kim YG, Kim IJ, Kim JS, et al. Evaluation of surface crack in resistance spot welds of zn-coated steel. Mater Trans. 2014;55(1):171–175.
- Böhne C, Meschut G, Biegler M, et al. Avoidance of liquid metal embrittlement during resistance spot welding by heat input-dependent hold time adaption. Sci Technol Weld Join. 2020;25(7):617–624.
- He L, DiGiovanni C, Han X, et al. Suppression of liquid metal embrittlement in resistance spot welding of TRIP steel. Sci Technol Weld Join. 2019;24(6):579–586.
- DiGiovanni C, Bag S, Mehling C, et al. Reduction in liquid metal embrittlement cracking using weld current ramping. Weld World. 2019;63(6):1583–1591.
- Khosravi A, Halvaee A, Hasannia MH. Weldability of electro galvanized versus galvanized interstitial free steel sheets by resistance seam welding. Mater Design. 2013;44:90–98.
- Pańcikiewicz K, Tuz L, Zielińska-Lipiec A. Zinc contamination cracking in stainless steel after welding. Eng Failure Anal. 2014;39:149–154.
- Razmpoosh MH, Macwan A, Goodwin F, et al. Crystallographic study of the liquid-metal-embrittlement crack path. Mater Lett. 2020;267:127511.
- Zdravecká E, Slota J. Mechanical and microstructural investigations of the laser welding of different zinc coated steel. Metals. 2019;9(1):91.
- Tseng KH, Hsieh ST, Tseng CC. Effect of process parameters of micro-plasma arc welding on morphology and quality in stainless steel edge joint welds. Sci Technol Weld Join. 2003;8(6):423–430.
- Mvola B, Kah P. Effects of shielding gas control: welded joint properties in GMAW process optimization. Int J Adv Manuf Technol. 2017;88(9–12):2369–2387.
- Baruah M, Bag S. Influence of heat input in microwelding of titanium alloy by micro plasma arc. J Mater Proces Technol. 2016;231:100–112.
- Sahu AK, Bag S. Effect of current pulsation on weld microstructure during micro-plasma arc welding of Inconel 718. In: Bag S, Paul CP, Baruah M, editors. Next generation materials and processing technologies. Singapore: Springer; 2021. p. 159–169.
- Dwibedi S, Bag S. Development of micro-plasma arc welding system for different thickness dissimilar austenitic stainless steels. J Inst Eng India Ser C. 2021;102(3):657–671.
- Prasad S, Pal S, Robi PS. Analysis of weld characteristics of micro plasma arc welded thin stainless steel 306 L sheet. J Manufac Proces. 2020;57:957–977.
- Salimi Beni S, Atapour M, Salmani MR, et al. Resistance spot welding metallurgy of thin sheets of zinc-coated interstitial-free steel. Metall Mater Trans A. 2019;50(5):2218–2234.
- Bayraktar E, Kaplan D, Devillers L, et al. Grain growth mechanism during the welding of interstitial free (IF) steels. J Mater Proces Technol. 2007;189(1–3):114–125.
- Frederick R, Grant G. Identification and characterization of the iron-zinc intermetallics formed in galvanneal steel PhD Thesis 1995. p. 1–127.
- Chakraborty G, Pal TK, Shome M. Microstructure development in resistance spot welded galvannealed IF steel sheet. Mater Sci Technol. 2011;27(1):382–386.
- Ashiri R, Haque MA, Ji CW, et al. Supercritical area and critical nugget diameter for liquid metal embrittlement of Zn-coated twining-induced plasticity steels. Scrip Mater. 2015;109:6–10.