
ABSTRACT
The rapid growth of population since 1950s has resulted in an enormous increase in demand for all kinds of manufactured goods. Manufacturing supply chains are becoming more sophisticated and complex, in particular within global food sector. At the same time, an increasing number of disruptions, ranging from those related to climate change and economic crisis as well as those associated with the socio-political turmoil and modern criminal activities such as cyber-attacks, are threatening the day-to-day operations. Although in the recent years, there have been significant advancements in supply chain management methods and tools, food manufacturers are still struggling to mitigate the possible impacts of these disruptions, leading to questions over the long-term resilience of their supply chains. This paper presents a novel framework for the improvement of food supply chain resilience and proposes a simulation-based decision support approach to aid the manufacturers to mitigate the impact of a range of unanticipated disruptions, specifically those related to climate change. The application of this framework has been demonstrated using activities of a dairy product manufacturer together with other main actors from its supply chain, namely the dairy farmers and wholesalers.
1. Introduction
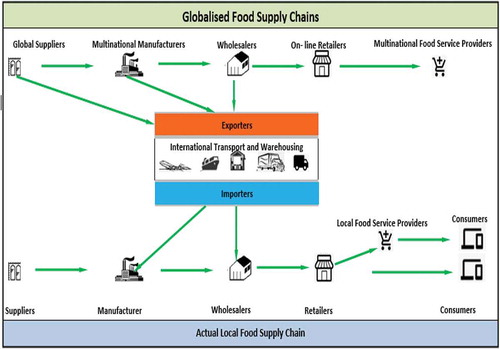
One of the main challenges nowadays is how to make supply chains more resilient against the various disruptions. In recent years, the contemporary food supply chains have become more complex to include a range of actors such as farmers, ingredient processors, food manufacturers, wholesalers, retailers and transporters each of which could be located in different parts of the world, as illustrated on the ().
Figure 1. An overview of interactions between global and local food supply chains
A definition of supply chain disruption provided by Craighead et al. (Citation2007) is the ‘unplanned and unanticipated events that disrupt the normal flow of goods and materials within a supply chain’. Over the last two decades, there has been an increasing range of new disruptions that are caused by global warming and climate change. Dillingham (Citation2018) states that in 2014 three out of five major disruptions were caused by climate change, which had resulted in 15 billion dollars losses for US manufacturing companies. The International Disaster Database (2017) and Bhatia, Lane, and Wain (Citation2013) have also highlighted an ever-increasing range of disruptions that threaten supply chains across the globe, causing billions of pounds of damages to production facilities or loss of revenue due to shortage of raw materials. According to reports by Price Waterhouse Cooper (Citation2020), extreme weather events such as droughts, floods and forest fires have caused significant financial impact and have compounded the global challenges related to resource availability. For example, during 2008–2010 the severe winters caused significant disruption to UK infrastructure, including airports and railways, resulting in 1.6 billion pounds of damages (Manners Bell Citation2014), and in 2018 the storm Eleanor with winds of 90 mph resulted in disruptions in the form of road closures and caused shortage of food ingredients across European countries (White Citation2018).
The overall aim of the research reported in this paper is to develop appropriate methodologies and associated decision support tools to improve resilience of food supply chain, particularly in response to unanticipated disruptions which have their origins in climate change. The initial sections provide an overview of existing research in this area and the latter part of the paper describes a three-stage framework as well as simulation-based decision support models developed to aid with mitigation planning against unanticipated disruptions. The application of this research within a dairy product supply chain, including three main actors namely the farmers, the manufacturer and the wholesalers are also described.
2. An overview of previous research in supply chain resilience
Although research in supply chain resilience is relatively new, there are several publications that have provided insight and novel solutions in this field. The term resilience has been defined by Oxford dictionary (Citation1989) as ‘the capacity to recover quickly from difficulties’, however this definition can vary across different research fields, such as ecology (Schulze Citation1996) and engineering (Rose Citation2011). The growing interest during the past two decades has also led various authors to provide several definitions for supply chain resilience (Rice and Caniato Citation2003; Christopher and Peck Citation2004; Sheffi Citation2005; Datta, Allen, and Allen Citation2007; Longo and Oren Citation2008; Levesque Citation2012; Ivanov, Sokolov, and Dolgui Citation2014; Stone and Rahimifard Citation2018). In fact, the number of research publications on Supply Chain Resilience (SCR) has had a significant surge after 2010 as highlighted by Biedermann, Kotzab, and Pettit (Citation2018) and illustrated in the ().
Table 1 Raw milk per farmer, dairy products produced by manufacturer, and dairy products distributed to wholesalers for US, IAM and RPMs for RC scenario
The publications on SCR often provide guidelines and strategies to develop recovery plans to mitigate against the impacts of disruptions (Mascaritolo and Holcomb Citation2008; Craighead et al. Citation2007; Saenz and Revilla Citation2014; Stone Citation2018). These strategies vary in the way that they are initially categorised and implemented by companies (). For example, Rice and Caniato (Citation2003) consider the role of inventory management in SCR, Habermann (Citation2009) focuses on logistics security and stock availability and access, Ponomarov and Holcomb (Citation2009) investigate the impact of varying logistics capabilities, Vlachos et al. (Citation2012) utilise forecasting and risk-management methods in recovery planning, and Johnson, Elliott, and Drake (Citation2013) emphasise on the information sharing in order to achieve resilience. In a comprehensive study by Petit et al. (Citation2011), a range of different disruptions have been categorised on a global scale, based on their definition and factors causing them, in order to provide the manufacturing companies with a tool to improve their resilience.
More recently, digital concepts and capabilities offered through recent advances in Industry 4.0 (Herrera and Janczewski Citation2016; Ivanov and Dolgui Citation2020; Al- Talib et al. Citation2020; Jagtap et al. Citation2021), in particular discrete event simulation techniques and tools have been adopted in the implementation of SCR strategies (Cigolini et al. Citation2014; Macdonald et al. Citation2018; Ivanov Citation2018; Singh et al. Citation2020). According to Al- Aomar et al. (Citation2015) a ‘system simulation model is the computer mimicking of the complex, stochastic, and dynamic operation of a real-world system, including inputs, elements, logic, controls and outputs’. Simulation model can be either stochastic or deterministic. Stochastic models are those that use probabilistic scenarios which better represent most of the modern global supply chain operations. Ramanathan (Citation2014) investigates the importance of supply chain collaboration between partners and uses the simulation technique and industrial data to model the supply chain performance, Wu et al. (Citation2013) investigate the product stockout within a retailer and utilise an agent-based simulation model to calculate the length of stockout for different products, Sandhue, Helo, and Kristianto (Citation2013) investigate the impact of bullwhip on resilience using simulation models, and Lenort et al. (Citation2014) use simulation techniques to improve resilience with automotive industry supply chain. In a recent publication, Tan, Cai, and Zhang (Citation2019) have utilised discrete event simulation to measure supply chain performance based on a specific disruption in different plants and to assess the effectiveness of a proposed strategy to recover from this disruption. In a different approach to many others, Ivanov and Dolgui (Citation2020) investigates how supply chain ‘digital twin’ can assist in achieving supply chain resilience before a disruption takes place based on a proactive strategy.
In direct relation to the scope of research in this paper within food sector, Vorst, Tromp, and Zee (Citation2009) use the simulation modelling for redesign of food supply chain to improve product quality, sustainability and logistics, Stone and Rahimifard (Citation2018) highlight a distinct shortage of decision support tools to address the resilience in the ‘food supply chain’ and a need for a cost-effective approach to develop recovery plans to improve the resilience of food sector. Leithner and Fikar (Citation2019) utilise a simulation model to investigate impacts of facilitating quality data within organic fresh food supply chains, Behzadi et al. (Citation2018) propose a stochastic model to combine risk management strategies together with supply chain decisions in order to mitigate supply-side disruptions risks, Gimenez-Escalante, Garcia-Garcia, and Rahimifard (Citation2020) suggest distributed localised manufacturing model to improve the resilience in food supply chains, and finally Zhu and Krikke (Citation2020) explore the sustainability and resilient of perishable food supply chain after an outbreak.
While there is growing number of publications in this area, the analysis of the literature review has highlighted a specific need for further research to examine the impact of a range of ‘unanticipated disruptions’ (see the definition provided in section 3), in particular those directly related to climate change. Therefore, a novel framework is proposed in this paper, entitled the Resilient Food Supply Chain (RFSC), to address this gap specifically for food manufacturers of varying size.
3. The resilient food supply chain framework
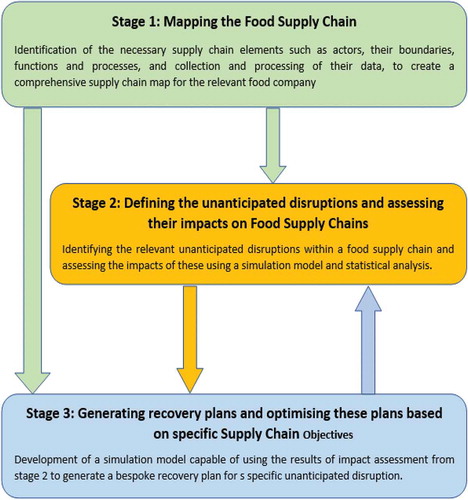
Typically, disruptions in manufacturing could be categorised to ‘anticipated disruptions’ which are those that though unpredictable about pattern of occurrence, there is some level of recorded historical data about their nature, range, and frequency that could be used to assess the ‘risk’ of them happening and the most appropriate mitigation plan that can be applied. This data is then used to develop a risk-management policy to deal with these disruptions. The second type of disruptions is referred to as ‘unanticipated disruptions’ which are those that there is no reliable and dependable historical data available, and therefore, current risk-management methods and tools could not effectively be used to aid with recovery planning for such disruptions. The RFSC framework has been developed to improve () food supply chains resilient against such unanticipated disruptions, specifically those caused by climate change, and consists of three stages, as depicted in ().
Figure 2 The resilient food supply chain framework
A simple example from UK dairy industry has been used as a case study for demonstration of applicability of the RFSC framework. The specific nature of its products (e.g. short shelf life and strict preservation requirements, rapidly diminishing stock and volume sales) and its importance within daily diet (i.e. as a main provider of energy and protein, and containing a wide range of vitamins and minerals, including calcium) make dairy sector particularly vital and vulnerable to unanticipated disruptions. Although, in recent years there has been a significant improvement in the average annual milk yield per cow, the UK dairy industry still relies on imported milk to meet its demands (AHDB Citation2020). The main actors in this sector are typically the dairy farmers, dairy product manufacturers and a number of large wholesalers.
A brief description of various stages of the RFSC framework using the example of dairy industry is provided below.
3.1. Stage 1: mapping the food supply chain (FSC)
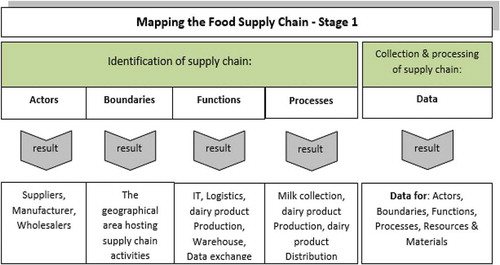
In this first stage, all relevant data related to various actors within the food supply chain under consideration is collected and collated to generate the FSC map. This includes the nature and number of actors, their physical boundaries, definition of functions and associated processes as well as the details for materials and information flows. () provides an overview of such map generated for the Dairy Product Supply Chain (DPSC) in the United Kingdom. This mapping process involves the formulation of a comprehensive supply chain architecture as well as the collection of all relevant data related to the various elements within the defined architecture (see ).
Figure 3 Overview of RFSC Stage 1
3.2. Stage 2: defining the unanticipated disruptions and assessing their impacts in food supply chains
The second stage of RFSC framework aims to define a range of Unanticipated Disruptions (UD), their causes and impacts on the actors of the food supply chain under consideration. At first, the causes and types of a UD are defined and analysed along with their impact on various actors within FSC, using a bespoke simulation model termed Impact Analysis Model (IAM). The IAM is designed and implemented using the WITNESS Software Version 22.5 (Lanner group, Citation2016). The occurrence of one or more UD, through a chain of intermediate phenomena and events, may affect one or more supply chain actors and their functions and processes. () summarises a list of possible UDs for dairy products supply chain. The main expected result from IAM is to assess whether or not a set of ‘threshold values’ for predicated impact sizes have been exceeded due to the UD. These threshold values are defined as a set of values beyond which there is an ‘undesirable impact’ likely to occur and therefore corrective actions via development of a bespoke recovery plans are required. These values are often set either by one of the main actors (manufacturer or wholesaler) or in collaboration among various actors within a food supply chain.
Table 2. Supply chain disruption causes and impacts in Dairy Product Supply Chain
3.3. Stage 3: generating recovery plans and οptimising these plans based on specific supply chain objectives
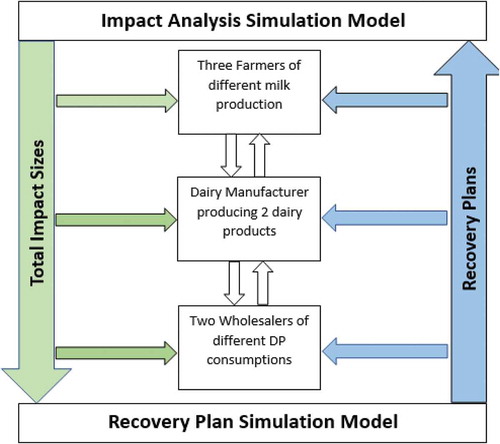
The third and final stage of RFSC framework is based on the use of a related simulation model, termed Recovery Plan Model (RPM) (also developed using WITNESS simulation software), which utilises the information on the predicated sizes of the impact (calculated by the IAM) to generate a range of specific recovery plans which could include modified collection plans, production schedules and distribution plans in order to mitigate (minimise) the impact caused by a UD within the food supply chain under consideration. The information flow between the three actors within the DPSC and these two decision support simulation models are illustrated in (). The main aim of the recovery plans generated by RPM is to minimise the impact caused by UD through meeting a number of optimisation objectives set by the various actors within a food supply chain. Examples of such objectives are provided in the case study section below.
Figure 4 The information flow between the three actors within the dairy products supply chain based on the application of RFSC framework
4 The dairy product supply chain case study
A simple case study based on three farmers, one dairy product manufacturer, and two wholesalers has been used to demonstrate the applicability of RFSC framework. The specific UDs explored by this case study are Road Closure (RC) and Shortage of Ingredients (SoI) which are the most frequent disruptions associated with climate change events. The data used in this case study has been synthesised based on published actual industrial data by Agriculture and Horticulture Development Board (Agriculture and Horticulture Development Board (AHDB) Citation2020) in the United Kingdom. The three dairy farmers have been chosen with different milk production capability, namely a small (25,000 hectoliters annually or 68.5 hectoliters daily), a medium (50,000 hectoliters annually or 136.4 hectoliters daily) and a large farmer (100,000 hectoliters annually or 278.4 hectoliters daily). This would enable the modelling of a range of different scenarios based on the affected farmer. The dairy product manufacturer operation in this case study is based on two production lines, one for processing and packaging drinking milk bottles and the other one for the production of yogurt pots. The production lines for these two dairy products have been chosen due to the social importance of processed milk (contributing to daily diet of most consumers) and financial importance of yogurt (due to higher profit margin associated to this product) for the manufacturer. It is assumed that the dairy product manufacturer utilises 60% of raw milk received from famers for drinking milk processing and packaging line and 40% for yogurt production line. Finally, a large wholesaler (receiving 60–85% of total daily production) and a small wholesaler (receiving 40–25% of total daily production) have also been included in the case study as the recipients of products produced by the dairy product manufacturer.
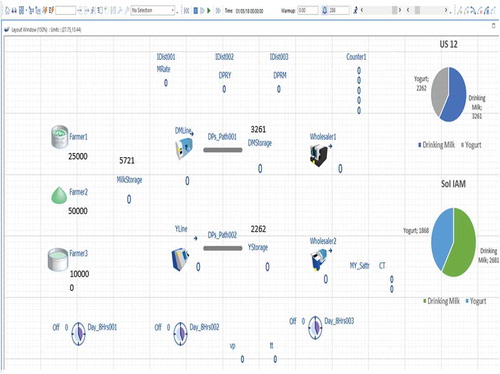
() illustrates a screenshot of the simulation model generated for this DPSC case study. The ability to include various statistical distributions within these models offers the opportunity to represent probabilities and randomness to reflect varying level of raw milk and dairy product productions caused by SoI and RC disruptions. Thus, they can be used to conduct a series of ‘what if’ analysis, to assess the impacts of UDs in a range of different scenarios and to generate a suitable recovery plans to mitigate these impacts. The functionality of the simulation model is validated using the industrial data published by Agriculture and Horticulture Development Board (AHDB) in the United Kingdom, before conducting the further ‘what-if’ analysis.
The initial AS-IS simulation model has been developed to represent the daily operation of this DPSC without any disruption, namely the Uninterrupted Scenario (US). In the case of DPSC, a number of statistical distributions, including Normal, Logistic, Lognormal, Uniform, Triangular, Binomial, Poisson and Geometric were considered to represent the randomness in daily milk production (Spiegel Citation1972) and Kolmogorov-Smirnov test (Hastings Citation1993) was utilised to select the Normal (also known as Gaussian) distribution as the most appropriate one to use in this study. Furthermore, since each of the dairy farmers in this case study must have more than 30 milk producing cows to be able to produce the total daily milk assumed for each farmer and using the guideline regarding selection of statistical distribution for cases with more than 30 samples (Triola Citation2019), the Normal distribution was again identified as the most suitable distribution to be used within IAM and RPM models in this case study to reflect the variability in milk-production levels. In this context, the AS-IS model is modified using this statistical distribution to represent the two aforementioned UD scenarios, namely RC and SoI, within IAM and RPM, as depicted in (). The first rows in () summarise the typical values for raw milk, drinking milk and yogurt pots inputs in the scenario representing ‘US versus SoI’ (with disruption duration of 12 days) as well as the scenario representing ‘US versus RC’ (with disruption duration of 6 days). These durations for SoI (12 days) and RC (6 days) represent typical reported period for such disruptions (Dartmouth Flood Observatory Citation2020). In each of these two scenarios, the IAM is used initially to measure the size of impacts of the UD on the flow of raw milk and dairy products, and if the threshold values are exceeded, then the RPM is utilised to generate recovery plans for various actors in the case study. The first rows of () also include a range of raw milk allocation onto the two dairy products production lines and distribution of dairy products quantity to the two wholesalers. These raw milk allocation and dairy product distribution values are used in the IAM and RPM models. When the supply of raw milk drops below a set limit (i.e. the threshold value), and with the assumption that additional raw milk cannot be sourced from other farmers in the required timeframe, these models are used to develop recovery plans through adjusting (a) the quantities of the dairy products produced in each production line and (b) the quantities of dairy products sent to each wholesaler. In the case where the need for a recovery plan is established (due to occurrence of a UD and impact threshold values exceeded), the dairy products manufacturer requests from its wholesalers, information regarding stock levels for each of their products. The data related to these actual stock levels and raw milk availability is then used to set the ratios for raw milk allocation to production lines referred to as Raw Milk Ratio (RMR), and distribution of dairy products among wholesalers referred to as Dairy Product Ratio (DPR).
Figure 5 WITNESS Horizon Simulation Model overview with all its elements
If the IAM results indicate that the threshold values have not been exceeded, then the standard RMR and DPR used in the uninterrupted scenario will continue to be adopted. In cases where the threshold values have been exceeded, the recovery plans are generated based on predefined optimisation objectives to meet the specific requirements of dairy products manufacturer, wholesalers, or both of these actors. The RPM model developed for this case study is capable of generating a recovery plan based on the following objectives:
Manufacturer Objective (MO) which aims to minimise the financial impact of raw milk availability on DP manufacturer by allocating raw milk to yogurt production line due to higher profit margin associated to this product.
Wholesaler Objective (WO) which aims to minimise the impact of raw milk availability on wholesaler to ensure that it receives quantities of bottled drinking milk close to those of uninterrupted scenario due to both the social importance (key part of public daily diets) as well as financial importance (potential loss of retail customers to competitors due to not meeting contractual requirements) associated with continuous availability of this product.
Hybrid Objective (HO) which aims to meet a combination of the above two objectives by adopting a multi-criteria decision support approach (Banasik et al. Citation2016).
In one of the experiments within this case study, it is assumed that the production rate of the largest farmer (farmer 3) is reduced by 30% during the 12 days representing SoI scenario and by 100% during the RC scenario for a duration of 6 days. () highlights the RMR and DPR values during the SoI and RC scenarios to ensure the achievement of each of the three aforementioned objectives. These ratios are used within IAM and RPM models to generate the simulated results for the allocation of raw milk to the production lines and distribution of dairy products to the wholesalers during the SoI and RC scenarios, as summarised in (). It should be noted that during the processing of the raw milk to produce drinking bottled milk, 2% of the total volume is typically removed as fat content in the milk.
Table 3 Summary of RMRs and DPRs for all scenarios based on simulated results
Table 4 Raw milk per farmer, dairy products produced by manufacturer, and dairy products distributed to wholesalers for US, IAM and RPMs for SoI scenario
show the total amount of drinking milk and yogurt produced in the five scenarios under consideration for the SoI. These includes the values for uninterrupted scenario for 12 days (i.e. US12), impact sizes by SoI calculated by IAM based on 30% reduction of milk production by farmer 3, and three recovery plans generated by RPM for each of the three defined optimisation objectives. These figures clearly highlight that the recovery plan generated for manufacturer objective (i.e. RPM(MO)) meets the requirements by producing close to total number of yogurt pots as in in the US12. Likewise, the recovery plan generated for wholesaler objective (i.e. RPM(WO)) meets the requirements by receiving the same amount of drinking milk as in the US12. Finally, the recovery plan generated based on hybrid objective (i.e. RPM(HO)) achieve a balance of production for milk and yogurt pots.
Figure 6 Drinking Milk and Yogurt distribution to wholesalers in US12, IAM SoI and RPM (WO), (MO) and (HO) for SoI Scenario
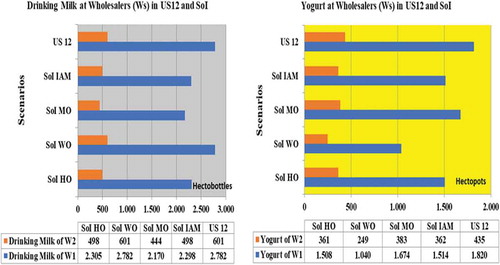
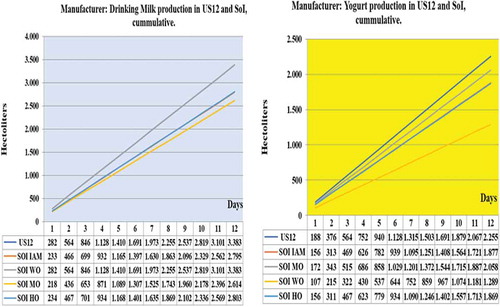
Figure 7 Drinking Milk and Yogurt production in US12, IAM SoI and RPM (WSO), (MO) and (HO) for SoI Scenario
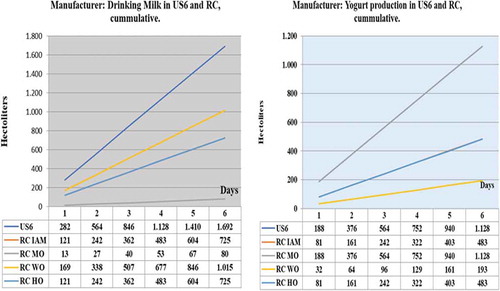
Similarly, show the total amount of drinking milk and yogurt produced in these 5 scenarios for the RC. These include the values for uninterrupted scenario for 6 days (i.e. US6), impact sizes by RC calculated by IAM based on 100% reduction of milk production by farmer 3, and recovery plans generated by RPM for the three defined optimisation objectives. These figures highlight that the recovery plan generated for manufacturer objective, namely RPM (MO) meets the requirements by producing close to total number of yogurt pots as in in the US6 and the recovery plan generated for wholesaler objective, namely RPM (WO) meets the requirements by receiving the same amount of drinking milk as in the US6. Finally, the recovery plan generated based on hybrid objective, namely i.e. RPM (HO) achieves a balance of production for milk and yogurt pots for the RC.
Figure 8 Drinking Milk and Yogurt distribution to wholesalers in US12, IAM SoI and RPM (WO), (MO) and (HO) for SoI Scenario
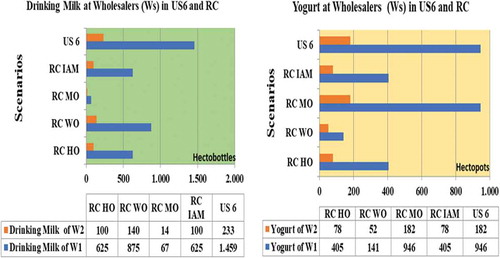
Figure 9 Drinking Milk and Yogurt production in US12, IAM SoI and RPM (WSO), (MO) and (HO) for SoI Scenario
5. Conclusions
Due to impact of global warming, climate change and more recently the COVID-19 pandemic, the long-term resilience of food supply chains is under closer scrutiny. Food manufacturers are increasingly asked to deal with a range of unanticipated disruptions which necessitates the development of bespoke and complex recovery plans that take into account the objectives by various actors within their supply chain.
The framework and associated simulation-based models presented in this paper provide an efficient, systematic and simple approach to improve the resilience of the food supply chains. In addition, the case studies based on the dairy product supply chain has highlighted the flexibility of simulation technique to assess the impact of a range unanticipated disruptions through what-if analysis capabilities and to develop bespoke recovery plans base on complex multi-criteria optimisation objectives. It should be noted that although in this demonstrative case study a limited number of farmers, production lines, and wholesalers were included, the comprehensive range of modelling capabilities embedded within the modern simulation software packages, enable the representation of complex relationships and inclusion of a wide range of actors involved within contemporary food supply chains.
Table 5 Raw milk per farmer, dairy products produced by manufacturer, and dairy products distributed to wholesalers for US, IAM and RPMs for RC scenario
The improvement in resilience of supply chain is dependent on identifying the potential vulnerabilities as well as new capabilities required to mitigate the impact of unanticipated disruptions. This novel framework can be used by supply chain managers within various food manufacturing companies to establish new capabilities among their suppliers and distributors to improve overall resilience of their supply chain. It is believed that the RFSC framework, with appropriate adjustments, could also be applied with other industry sectors since supply chain elements that are included and investigated in this research are common in other manufacturing supply chains.
Finally, the future of this research would explore the implementation of such decision support approach as part of research on digital manufacturing, industrial Internet of things and supply chain integration proposed by Industry 4.0 standards being investigated to support future resilient food supply chains.
Disclosure statement
No potential conflict of interest was reported by the author(s).
Additional information
Funding
References
- Agriculture and Horticulture Development Board (AHDB). 2020. “GB Milk Production Could Hit 29 – Year High” Accessed 28 March 2020. https://dairy.ahdb.org.uk/news/news-articles/march-2019/201920-gb-milk-production-could-hit-29-year-high/#.XqGXCMhKiUk
- Al- Aomar, R., et al. 2015. Process Simulation Using WITNESS. Wiley: Publisher.
- Al- Talib, M., Y., . W. Melhem, A. Anosike I., A. J. Reyes G., P. S. Nadeem, and A. Kumar. 2020. “Achieving Resilience in the Supply Chain by Applying IoT Technology, CIRP Design 2020.”
- Banasik, A., A. Kanellopoulos, J. Bloemhof- Ruwaard, and G. D. H. Claassen. 2016. “Multi - Criteria Decision Making Approaches for Green Supply Chains: A Review.” Flexible Services and Manufacturing Journal, 30: 366-396.
- Behzadi, G., J. M. O’Sullivan, T. L. Olsen, and A. Zhang. 2018. “Agribusiness Supply Chain Risk Management: A Review of Quantitative Decision Models.” Omega 79: 21–42. doi:https://doi.org/10.1016/j.omega.2017.07.005
- Bhatia, G., C. Lane, and A. Wain. 2013. “Building Resilience in Supply Chains, World Economic Forum.”
- Biedermann, L., H. Kotzab, and T. Pettit. 2018. “Theory Landscape and Research Perspectives in Current Supply Chain Resilience Research.” In Dynamics in Logistics. Proceedings of the 6th International Conference on Dynamics in Logistics (LDIC) 2018, edited by M. Freitag, H. Kotzab, and J. Pannek, 26–33. Cham, Switzerland: Springer International Publishing.
- Christopher, M., and H. Peck. 2004. “Building the Resilient Supply Chain.” The International Journal of Logistics Management 15 (2): 1–14. doi:https://doi.org/10.1108/09574090410700275.
- Cigolini, R., M. Pero, T. Rossi, A. Sianesi et al. 2014. “Linking Supply Chain Configuration to Supply Chain Performance: A Discrete Event Simulation Model.” Simulation Modelling Practice and Theory 40 (1): 1–11. DOI:https://doi.org/10.1016/j.simpat.2013.08.002.
- Craighead, C. W., J. Blackhurst, J. M. Rungtusanatham, and R. B. Handfield. 2007. “The Severity of Supply Chain Disruptions: Design Characteristics and Mitigation Capabilities.” Decision Sciences 38 (1): 131–156. doi:https://doi.org/10.1111/j.1540-5915.2007.00151.x.
- Dartmouth Flood Observatory (DFO). 2020. “Interannual Evolution of Flood Duration.” University of Colorado.
- Datta, P. M., . C., P. Allen, and P. Allen. 2007. “Agent-based Modelling of Complex Production/Distribution Systems to Improve Resilience.” International Journal of Logistics: Research and Applications 10 (3): 187–203. doi:https://doi.org/10.1080/13675560701467144.
- Dillingham, G. 2018. “How Climate Change Is Messing with Your Supply Chain” Accessed 15 March 2020. https://medium.com/thoughts-economics-politics-sustainability/how-climate-change-is-messing-with-your-supply-chain-2b9f1c079449
- Gimenez-Escalante, P., G. Garcia-Garcia, and S. Rahimifard. 2020. “A Method to Assess the Feasibility of Implementing Distributed Localised Manufacturing Strategies in the Food Sector.” Journal of Cleaner Production 266: 121934. doi:https://doi.org/10.1016/j.jclepro.2020.121934.
- Habermann, M. 2009. “Identifying and Mitigating the Antecedents of Supply Chain Disruptions – 3 Essays.” PhD diss., University of Minnesota.
- Hastings, A., and B. Peacock. 1993. Statistical Distributions, Publisher. New ed. New York: John Wiley & Sons . 1 Sept. 1979.
- Herrera, A., and L. Janczewski. 2016. Cloud Supply chain resilience model: development and validation, HICSS 49th Hawaii International Conference on System Sciences.
- Ivanov, D. 2018. “Revealing Interfaces of Supply Chain Resilience and Sustainability: A Simulation Study.” International Journal of Production Research 56 (10): 3507–3523. doi:https://doi.org/10.1080/00207543.2017.1343507.
- Ivanov, D., and A. Dolgui. 2020. “A Digital Supply Twin for Managing the Disruption Risks and Resilience in the Era of Industry 4.0.” International Journal of Production Planning and Control, 32: 775-788.
- Ivanov, D. B., .Sokolov, B., and A. Dolgui. 2014. “The Ripple Effect in Supply Chains: Trade- off Efficiency – Flexibility – Resilience in Disruption Management.” International Journal of Production Research 52 (7): 2154–2172. doi:https://doi.org/10.1080/00207543.2013.858836.
- Jagtap, S., G. Skouteris, V. Choundari, S. Rahimifard, and L. N. K. Duong. 2021. “An Internet of Things Approach for Water Efficiency: A Case Study of the Beverage Factory.” Sustainability 13 (6): 3343. doi:https://doi.org/10.3390/su13063343.
- Johnson, N., D. Elliott, and P. Drake. 2013. “Exploring the Role of Social Capital in Facilitating Supply Chain Resilience.” Supply Chain Management: An International Journal 18 (3): 324–336. doi:https://doi.org/10.1108/SCM-06-2012-0203.
- Lanner Group Ltd. 2016. “Learning WITNESS Book One, Manufacturing Performance Edition.”
- Leithner, M., and C. Fikar. 2019. “A Simulation Model to Investigate Impact of Facilitating Quality Data within Organic Fresh Food Supply Chains.” Annals of Operations Research. doi:https://doi.org/10.1007/s10479-019-03455-0.
- Lenort, R., P. Wicher, M. Karkula, and D. Stas. 2014. “A Computer Simulation – Based Analysis of Supply Chains Resilience in Industrial Environment”. Metalurgija – Sisak Then Zagreb – (Metalurgija), 703–706. Vol. 54.
- Levesque, P. 2012. “Book Highlight Building Resilience and Sustainability into the Chinese Supply Chain.” Global Business and Organisational Excellence 31 (3): 69–83. doi:https://doi.org/10.1002/joe.21427.
- Longo, F., and T. Oren. 2008. “Supply Chain Vulnerability and Resilience: A State-of-the-Art Overview.” In Proceedings of European Modeling & Simulation Symposium, edited by C. S. Giovanni, September 17–19, Italy.
- Macdonald, J. R., C. W. Zobel, S. A. Melnyk, and S. E. Griffis. 2018. “Supply Chain Risk and Resilience: Theory Building through Structured Experiments and Simulation.” International Journal of Production Research 56 (12): 4337–4355. doi:https://doi.org/10.1080/00207543.2017.1421787.
- Manners Bell, J. 2014. Supply Chain Risk: Understanding Emerging Threats to Global Supply Chains. London: Kogan Page Limited.
- Mascaritolo, J., and C. Holcomb. 2008. “Moving Towards a Resilient Supply Chain.” Journal of Transportation Management 19 (2): 71–83. doi:https://doi.org/10.22237/jotm/1220227560.
- Oxford dictionary. 1989. “Publisher.” Oxford: Clarendon Press.
- Pettit, T. J., Croxton, K. and Fiksel, J. 2011. Ensuring Supply Chain Resilience: Development and Implementation of an Assessment Tool. Journal of Business Logistics 34 (1) pp.46–76
- Ponomarov, S. Y. and Holcomb, C. M. 2009. Understanding the concept of supply chain resilience, The International Journal of Logistics Management, vol. 20
- Pricewaterhouse Coopers (PWC). 2020. “Climate Change and Resource Scarcity” Accessed at 5 April 2020. https://www.pwc.co.uk/issues/megatrends/climate-change-and-resource-scarcity.html
- Ramanathan, U. 2014. “Performance of Supply Chain Collaboration – A Simulation Study.” Expert Systems with Application 41 (1): 210–220. doi:https://doi.org/10.1016/j.eswa.2013.07.022.
- Rice, J., and F. Caniato. 2003. “Building a Secure and Resilient Supply Network.” Supply Chain Management Review 7 (5): 22–30.
- Rose, A. 2011. “Resilience and Sustainability in the Face of Disasters.” Environmental Innovation and Societal Transitions 1 (1): 96–100. doi:https://doi.org/10.1016/j.eist.2011.04.003.
- Saenz, J., and E. Revilla. 2014. “Creating More Resilient Supply Chains.” MIT Sloan Management Review Summer 2014: 22–24.
- Sandhue, M. A., P. Helo, and Y. Kristianto. 2013. “Steel Supply Chain Management by Simulation Modelling.” Benchmarking: An International Journal 20 (1): 45–61. doi:https://doi.org/10.1108/14635771311299489.
- Schulze, P. 1996. “Engineering within Ecological Constraints, Ed: National Academy of Engineering.”
- Sheffi, Y. 2005. “Building a Resilient Supply Chain.” Harvard Business Review 1 (8): 1–11.
- Singh, S., R. Kumar, R. Panchal, and M. K. Tiwari. 2020. “Impact of COVID-19 on Logistics Systems and Disruptions in Food Supply Chain.” International Journal of Production Research 59 (7): 1993–2008. doi:https://doi.org/10.1080/00207543.2020.1792000.
- Spiegel, R. M. 1972. Theory and Problems of Statistics, Schaum’s Outline Series, SI. metric ed. London: Murray R SPIEGEL, Mc Graw Hill Book Company, New York, co-published with Mc Graw Hill Book Company (UK), Limited.
- Stone, J. 2018. “Ingredients of a Resilient Supply Chain.” Loughborough University.
- Stone, J., and S. Rahimifard. 2018. “Resilience in Agri-food Supply Chains: A Critical Analysis of the Literature and Synthesis of a Framework.” Supply Chain Management: An International Journal 23 (3): 207–238. doi:https://doi.org/10.1108/SCM-06-2017-0201.
- Tan, J. W., W. Cai, and A. N. Zhang. 2019. “Structural – Aware Simulation Analysis of Supply Chain Resilience.” International Journal of Production Research 58 (17): 5175–5195. doi:https://doi.org/10.1080/00207543.2019.1705421.
- Triola, F. M. 2019. Essentials of Statistics 6th ed. Pearson: , Publisher.
- Vlachos, D. E., I. K. Papapanagiotou, D. Partsch., and D. Partsch. 2012. “Building Robust Supply Chains by Reducing Vulnerability and Improving Resilience.” International Journal of Agile Systems and Management 5 (1): 59–81. doi:https://doi.org/10.1504/IJASM.2012.045899.
- Vorst, J. D. A., S. P. Tromp, and D. J. Zee. 2009. “Simulation Modelling for Food Supply Chain Redesign; Integrated Decision Making on Product Quality.” Sustainability and Logistics, International Journal of Production Research 47 (23): 661–6631.
- White, M. 2018. “Worst Storms of 2018: The Extreme Weather that Battered Britain” Accessed 23 February 2020. https://www.standard.co.uk/news/uk/worst-storms-of-2018-the-extreme-weather-that-battered-britain-a4026346.html
- Wu, T., S. Huang, J. Blackhurst, X. Zhang, S. Wang, et al. 2013. “Supply Chain Risk Management: An Agent-Based Simulation to Study the Impact of Retail Stockouts.” IEEE Transactions on Engineering Management 60 (4): 676–686 (10) (PDF) Model for simulation of supply chain resilience. doi:https://doi.org/10.1109/TEM.2012.2190986.
- Zhu, Q., and H. Krikke. 2020. “Managing a Sustainable and Resilient Perishable Food Supply Chain (PFSC) after an Outbreak.” Sustainability 12 (12): 5004. doi:https://doi.org/10.3390/su12125004.