
 ?Mathematical formulae have been encoded as MathML and are displayed in this HTML version using MathJax in order to improve their display. Uncheck the box to turn MathJax off. This feature requires Javascript. Click on a formula to zoom.
ABSTRACT
This study solved a practical problem in a case in the sheet metal industry using machine learning and deep learning algorithms. The problem in the case company was related to detecting the minimum gaps between components, which were produced after the punching operation of a metal sheet. Due to the narrow gaps between the components, an automated sheer machine could not grip the rest of the sheet skeleton properly after the punching operation. This resulted in some of the scraped sheet on the worktable being left behind, which needed a human operator to intervene. This caused an extra trigger to the production line that resulted in a break in production. To solve this critical problem, the relevant images of the components and the gaps between them were analyzed using machine learning and deep learning techniques. The outcome of this study contributed to eliminating the production bottleneck by optimizing the gaps between the punched components. This optimization process facilitated the easy and safe movement of the gripper machine and contributed to minimizing the sheet waste.
1. Introduction
The advance of technological trends has driven the rapid diffusion of machine learning across industries (Sarkar et al. Citation2016; O’Donovan et al. Citation2019; Gottsegan, Citation2020; Cakir, Guvenc, and Mistikoglu Citation2021). Today’s growth of technological, societal, and competitive pressures is pushing companies to transform and innovate. Due to the rapid progress of machine-learning technologies with their added benefits, organizational managers at all levels need to familiarize themselves with these techniques. Such organizational changes contribute to ensure creating maximum value for companies. However, there is a common challenge to the usability of machine-learning methods in companies, where a trade-off between interpretability and accuracy is needed (Srdoc et al., Citation2007; Sarkar et al. Citation2016). It is important to understand the decisions made by machine-learning-based techniques, which should also be transparent and interpretable.
Machine learning is a technique that is concerned with enabling computer programs automatically with the objective of improving the performance of some tasks through experience. The application of machine learning in the area of manufacturing can be very fruitful (Sung Citation2018; Sharp, Ak, and Hedberg Citation2018; Dutta, Kaliannan, and Subramaniam Citation2021). In today’s business, the application of machine learning is considered to be one of the most disruptive innovations and can be a strong enabler of competitive advantage (Ren Citation2021; Cakir, Guvenc, and Mistikoglu Citation2021). The application of machine learning has been around for more than 60 years; however, only in recent time has it showed significant potential for enhancing economies and societies (Lee and Shin Citation2020).
There are various applications of machine learning methods that have been applied in different industrial sectors in recent years. These methods have been applied in various industrial segments such as healthcare, banking, manufacturing, transportation, etc (Li, Wang, and Wang Citation2019; Xie Citation2020; Gupta et al. Citation2020; Danton et al. Citation2020). Studies have shown that the adoption of machine learning algorithms can contribute to reducing costs by between 20%–25% across banking, IT operations, infrastructure, and maintenance, improve customer retention and acquisition, etc. (Accenture, Citation2018). By transforming business processes into intelligent and automated processes, companies can more effectively utilize their resources for higher-value activities and be able to offer better products and services to their customers.
This study is focused on maintaining the punching operation of a sheet metal company in Finland. This company operates on a global scale to deliver customized components produced from sheets. It currently has problems in sheet material handling after the necessary punching operations. The company has noticed that frequently after punching operations waste sheets are stuck over the worktable because the automated grippers fail to grip the sheets completely and human operators are needed to remove the remaining parts of the sheets and put them into trash bins. This often creates a halt in production and thus a loss in production for the company. This problem occurs mostly due to too narrow gaps being produced between the components following the punching operation. To overcome this problem, machine learning and deep learning algorithms were used to study the gaps between components with the objective of optimizing the gaps.
The rest of the article is organized as follows: Section 2 comprises a literature review on machine learning, and the methodology of the study is presented in Section 3. A description of the case company follows in in Section 4, and the overall study results are analyzed and presented in Section 5. Various practical outcomes are elaborated in terms of managerial implications at Section 6. The study concludes in Section 7 by presenting its contributions and limitations its and suggestions for future research.
2. Literature review
2.1 Digitalization of industries and machine learning
Digitalization means the incorporation of digital technology into all aspects of everyday life of industrial communities. Today’s digital era emphasizes the importance of integrating digital transformation in industries in order to improve the overall efficiency of the business processes. The digital transformation of business processes provides an unprecedented flow of high-quality information to industries by using automated real-time data analytics and process analysis. Because of the digitalization of manufacturing industries, it is essential nowadays to introduce digital tools and technologies into this segment. This digitalization process results in an enormous amount of valuable data, which needs to be analyzed in order to improve production processes and to detect the causes of problems. In this environment, machine learning and deep learning can be useful in saving energy, time, and resources, and avoiding waste (Tsai and Chang Citation2018; Weichert et al. Citation2019). Machine learning, which is a branch of artificial intelligence, is used to progressively enhance the performance of tasks based on big data collected in the digitalized world (Bianconi et al. Citation2014; Li, Wang, and Wang Citation2019; Carbo-Valverde, Cuadros-Solas, and Rodríguez-Fernández Citation2020).
It is a new go-to strategy to add value in business processes through the digitalization of workflows using machine learning and advanced analytics (Li, Wang, and Wang Citation2019; Hajizadeh Citation2019; Kang, Catal, and Tekinerdogan Citation2020). Companies are striving to embrace the new digital technologies, but find it challenging to put their models into production in order to achieve tangible outputs and gain favorable benefits. Due to the rapid growth in digitalization, machine-learning algorithms offer high potential for the business process optimization domain. Nowadays, machine-learning algorithms are widely implemented in the production environment (Zhang, Wang, and Gao Citation2019). The application of machine learning is encouraged by industrial communities due to its additional capabilities to save on resources, machining time and energy, and increase yield in areas where traditional methods such as six sigma strategies have reached their limits (Köksal, Batmaz, and Testik Citation2011; Golkarnareji et al., Citation2019; Ren Citation2021; Xu et al., Citation2021).
The emergence of digitalization in manufacturing processes has attracted industries and evolved over recent decades. The traditional concept of computer-integrated manufacturing is transferred to digital manufacturing, where the technologies and tools facilitate the integration of product and process design before starting actual production and support the ramp-up phases . In digital manufacturing, particular emphasis is given to the optimization of networked production facilities, where real time data is necessary for the decision-making process. Machine learning, which is a diverse field of artificial intelligence, has the ability to automatically learn from data and make predictions based on data. This technique has been widely used in digital manufacturing for various purposes, such as predictive maintenance (Joseph et al. Citation2014; Dalzochio et al., 2020), demand forecasting (Huber and Stuckenschmidt Citation2020; Jayant, Agarwal, and Gupta Citation2021) to process monitoring (Cakir, Guvenc, and Mistikoglu Citation2021), and optimization (Weichert et al. Citation2019; Min et al. Citation2019).
The term machine learning describes algorithms used to identify and extract valuable data patterns to improve quality. The implementation of machine learning is not a new field. However, with the recent growth of computational power, many industries have been considering employing artificial intelligence solutions to improve production processes (Weichert et al. Citation2019; Ademujimi, Brundage, and Prabhu Citation2017). The development of machine learning has been very successful at tackling complex tasks (Gottsegan, Citation2020). It is also noticeable that although machine learning and many deep-learning methods are known to create highly accurate outcomes, they often lack interpretability owing to their black-box nature (Lee and Shin Citation2020). It is therefore critical, and often challenging, to identify the most appropriate machine-learning method for specific applications. There are other challenges also for organizational managers when deploying machine learning, such as ethical issues, a shortage of machine-learning engineers, and issues of data-quality cost-benefit (Lee and Shin Citation2020).
Although machine learning provides new opportunities in terms of supporting a data-rich digital manufacturing environment, it often gives rise to additional challenges. The machine learning algorithm requires compliance with defined standards, which is required for data science and optimization techniques (Parkes, Özcan, and Karapetyan Citation2015). In addition, there is also a challenge in finding expertise related to data science and optimization areas, which requires an inherently different skill set (Baumers and Özcan Citation2016). Moreover, there are challenges to implementing machine learning such as the selection of the right algorithm, the right set of data, data processing, data labelling, etc. Furthermore, there are several other challenges during the implementation process such as managing the model version, redeveloping the models, managing data versions, etc. (Gupta Citation2017). Problems associated with machine learning methodology need to be addressed at regular intervals.
2.2 Application of machine learning in various industrial segments
Machine learning methodology is applied in various fields of research work. Yeh and Deng (Yeh and Deng Citation2012) applied machine-learning methodology in cost estimation of the product life cycle. They used two machine-learning methods, namely back-propagation neural networks (BPNs) and least squares support vector machines (LS-SVMs) in order to solve product life cycle cost estimation problems. Carbonneau, Laframboise, and Vahidov (Citation2008) used advanced machine learning to investigate the applicability of forecasting distorted demand at the end of a supply chain (bullwhip effect). The authors compared this method with other available methods, such as naïve forecasting, trend, moving average, and linear regression, and showed that the machine learning method produced a better performance than the regression model. Machine learning-based algorithms have also been applied to manage the human resource systems of intelligent manufacturing industry. The application of machine learning in human resource management in enterprises has been investigated by matching, screening and filtering the user’s job characteristics and the employee’s requirements with the objective of improving the effective pursuit of the most suitable goals for both users and enterprises (Xie Citation2020; Garg et al. Citation2021).
The application of machine learning algorithms can significantly improve the operation and development of manufacturing industries (Sung Citation2018). The automotive industry is a leading user of machine learning to assess and minimize risk. Such risk assessments are conducted by identifying the risks first, which is successfully performed by adopting machine-learning algorithms (Hegde and Rokseth Citation2020). Financial businesses such as banks adopt machine learning in order to analyze various transaction scenarios, to enable the processing of large data sets faster, and to mak accurate forecasts for various automated trading functionalities (Lee Citation2017: Rizzi, Wang, and Zielinski Citation2020). Weichert et al. (Citation2019) reviewed the application of machine learning in industries to optimize methods on the shop floor in order to improve production processes in the manufacturing industry. Additionally, they also discussed how the machine-learning approach used in industries saves energy, time, and resources, and avoids waste.
In the case of service industry, machine-learning algorithms have also been successfully applied. applied machine learning in the healthcare industry to identify ethical considerations, while Gupta and Sedamkar (Citation2020) deployed machine learning to correctly identify the percentage of sick versus healthy people. For the tourism and hospitality industry, machine learning has shown significant potential. Sun et al. (Citation2019) used a machine learning algorithm to forecast the number of tourists arriving in a certain period. They proposed a forecasting framework that applies a combination of machine learning and internet search, with the aim of improving the overall forecasting performance with respect to both forecasting accuracy and robustness analysis. Sanchez-Medina and C-Sanchez (Citation2020) used machine learning to successfully forecast hotel booking cancellations. Other areas of machine learning applications can be seen in transportation (Huang and Zhu Citation2021), flood prediction (Motta et al., Citation2021), telecommunications (de Andres, Citation2020), smart city (Zekić-Sušac, Mitrović, and Has Citation2021), amongst others.
Machine learning algorithms are used in industries for various purposes such as clustering, classification, forecasting, etc. In the case of clustering, objects are grouped in order to reveal patterns, such as feedback from groups of customers to improve customer satisfaction. Unsupervised machine learning is used in clustering due to the class labels of some objects not being known beforehand (Najafabadi, Citation2017). For classification processes, all the observations are already categorized or classed for purposes of training and testing. Machine learning is helpful in classifying the business operations. Chandran (Citation2018) studied a brewing company using a machine-learning classifier to determine better routes for its drivers. Musani (Citation2018) deployed a machine learning based freshness algorithm to prioritize the flow of perishable goods worldwide. In addition to clustering and classification, machine learning is also deployed to identify data patterns that are used to predict future events. For instance, machine learning can be used to scrutinize data to detect market signals that will affect future market performance (Chandran Citation2018). The JP Morgan trading team has developed a proprietary machine-learning model in order to find the best execution strategy for trading orders (McDowell Citation2018). highlights the application of machine learning in some important industrial sectors.
Table 1. Application of machine learning algorithms in various industrial sectors
2.3 Application of machine learning in sheet metal industries
There are only a few applications of machine learning in sheet metal industries. Machine learning and deep learning algorithms are successfully applied to sheet metal industries to select a suitable manufacturing process and to achieve the final geometry of a metal part that is unstructured and heavily reliant on human expertise (Hamouche and Loukaides Citation2018; Chiu, Tsai, and T-l Citation2020). Stoerke et al. (Citation2016) proposed a new methodology to increase the geometric accuracy forming of sheet metal work pieces. They proposed the use of a machine learning model, which applies reinforcement learning as a flexible and promising solution to increase the geometric accuracy in incremental sheet forming processes.
Machine learning is also used to predict the defects of sheet metal forming processes (Deb, Ribeiro, and Prates Citation2018; Tsai and Chang Citation2018). Kwitek (Citation2016) demonstrated how sheet metal fabrication machines can use machine learning in order to gain competitive advantage. He used machine learning to focus on predictive maintenance, which contributed to improving operations management. Hamouche and Loukaides (Citation2018) applied machine learning to sheet metal forming, which is considered a critical component of modern manufacturing. In their study, a machine learning approach was used for the first time with the objective of identifying the manufacturing process, which formed a part solely from the final geometry. By implementing a mapping of the mean and Gaussian curvatures through machine learning, a high accuracy rate was established that automated the operational processes from the initial stage as design to manufacture, thus eliminating the requirement for human experts in matching each product with a suitable forming method.
Kashid and Kumar Citation2012) performed a review of the applications of artificial neural networks to sheet metal work. Zwierzycki, Nicholas, and Thomsen (Citation2018) applied pre-process supervised machine learning to predict and improve sheet-forming tolerance and generate corrected fabrication models. Lin and Chang Citation1995) proposed a model using machine learning from neural networks in an expert system of sheet metal bending tooling. In this study, the authors developed a learning model with conditional attributes to develop an expert system of sheet metal bending tooling selection. Wu et al. (Citation1999) deployed a combination of artificial neural network and machine learning methods for investigating surface defects in sheet metal forming.
2.4 Related challenges to implementing machine-learning methods in industries
There are several challenges in deploying a machine-learning approach in industries, such as data privacy, data accessibility, and data sharing. In addition, there are other related challenges such as the quality of data, ethical issues, shortage of experts, cost benefit analysis etc. In terms of ethical challenges, the application of machine learning is concerned with data privacy and protection rules (e.g. personal medical record data). During algorithm development for machine learning, training data is needed, which may exhibit an inevitable bias if there are any latent biases in that data (e.g. bias accompanied with gender, age, race) (Sharp, Ak, and Hedberg Citation2018). In order to develop an ethical machine learning algorithm, cooperation between researchers, developers and policy makers is needed. Turilli Citation2020)recommended that machine-learning algorithms should reflect the same ethical principles as human workers to ensure consistency with an organization’s ethical standards.
In addition to the ethical challenge, there is a shortage of machine learning engineers. The demand for artificial intelligence (AI) talents has increased fast in recent years, resulting in a high number of AI-related vacancies (Culbertson, 2018). In the American job market, machine-learning engineers are listed as one of the top emerging professions (LinkedIn, Citation2017). It will take years to adequately meet the demand for machine learning engineers in industry (Woolf and McIntyre Citation2018).
The challenge related to data quality refers to the fitness of data for specific applications of machine learning. It is important to have high-quality data for the successful application of machine learning to solve problems. The performance of machine learning or deep learning highly depends on the data quality (Greenspan, van Ginneken, and Summers Citation2016). If the study data are collected from various sources in an unstructured format, the quality of the data deteriorates quickly. Machine learning algorithms demand structured data, although the majority of data are unstructured (e.g. voice, text, image data, etc.), which are often difficult to process (Lee Citation2017). To get fruitful outcomes from machine learning algorithms, companies need to establish a data-quality control process to develop quality metrics, collect new data, evaluate data quality, remove inaccurate data from the training data set, and assess the trade-off between quality-assurance costs and gains (Lee and Shin Citation2020).
The final challenge of applying machine learning is to analyze the relevant costs and benefits. Although the relevant benefits for using machine learning are huge, it can still be difficult to proving the value of the investment to stakeholders owing to the delay between investment and reward (Deloitte Technology, 2018). Organizational managers need to keep in mind that machine learning cannot solve all the business problems; therefore, it is necessary to investigate the investment analysis with all stakeholders, including top management and users, before its deployment. In the case of a risky and irreversible project, traditional investment-evaluation techniques may not be suitable to capture the value of machine learning projects. It is therefore advisable to adopt a real-option approach to investment justification, which offers managers the opportunity to optimize the planning of machine learning projects (Lee and Lee Citation2015).
3. Study methodology
This study was conducted in a case company, engaged in sheet metal work, where the problem was to identify the optimal gaps between components in order to more easily handle the waste sheet after the punching operation. To identify and visualize the gaps, both machine learning and deep learning algorithms were adopted to analyze images of the sheets provided by the company. These algorithms were deployed as part of the image processing technique to visualize the gaps clearly. The provided images were converted to suitable ones, which could easily be analyzed by using machine and deep learning algorithms.
In order to study the gaps, all images of the components over the sheet were analyzed. The study of these images helps to identify which parts of the images are actual components, and which parts are waste materials to trash. This gap optimization process also helps the case company to maintain its operational schedule between the day and night production lines by employing the most critical, and non-critical components based on the gaps. This study analyzes the gaps between components by converting the components’ images from vector to pixel images through a machine learning algorithm. This image conversion process facilitates the study and contributes to the company by analyzing the design of the components and the gaps necessary for a stable and optimal production process.
The input of the machine-learning algorithm was an image of a metal sheet, which contains the components’ drawings and their corresponding thresholds. This image is used to identify the acceptable distance between any two components. In addition, the given image is a .svg file and a gray scale image. The output of the algorithm is the same image as the input with the location of a too narrow gap (less than the given threshold) between components, and it is marked by a circle. The output image should show all the possible narrow areas between components.
This study uses Python 3.7.0 to program the necessary stages of the machine-learning algorithm. During this project, there were several library files used, which are listed and briefly described in . These library files were used to achieve better images of the gaps between components. In order to solve the problems related to the gaps, it is essential to obtain better visibility of the images.
Table 2. List of library files used during the study
The most direct way to measure the distances of components in an image is by measuring the coordinates of these in a pixel image. Since the input is not a pixel image (it is an svg image), it should be converted into pixel. By doing that, the input can now be handled as a 2D matrix with
rows and
columns (m, n are known as the size of the converted image, which we can adjust in the converting process). Each entry in row
(
1) and column
(
) of this matrix,
, is proportional to the brightness of the image at that point. Because the input is a gray scale image, each entry
takes a value between 0 to 255 (0 is taken to be black, 255 is taken to be white).
3.1 Justification for using machine-learning algorithm in this study
Sheet metal companies demand a high level of knowledge and expertise from the competent designers. To achieve such expertise in this industrial sector, various artificial intelligence techniques are being deployed with the objective of reducing complexity, minimizing the human work force as well as improving operational excellence. The machine learning algorithm as part of artificial intelligence is one of the most powerful techniques for solving engineering problems and reducing complexity and minimizing the use of human expertise and time taken for production processes.
There are several successful applications of ML in manufacturing industries. The major application of ML is monitoring (Chinnam Citation2002), especially in the areas of quality monitoring, machine condition monitoring, fault diagnosis, tool wear, optimization, etc.(Wuest eal.Citation2016).In addition, ML is also used in manufacturing in image recognition, where the images are used to identify damaged products. These applications of ML in different manufacturing and optimization problems demonstrate the vast adaptability and applicability of the ML algorithm.
Component quality is an essential parameter for the sheet metal industry, where it is a tedious job to manually inspect for component defects caused by the punching operation. In order to avoid this, it is useful to use an image-based component investigation strategy. This vision-based investigation system is considered a powerful and lasting solution (Ghatnekar Citation2018). Using computer vision and machine learning can provide a robust and effective approach to overcome the challenge of detecting and classifying component defects. Image recognition is considered an important strategy, where an image is used to detect which type of defect the components or parts have. In real-time applications, the image recognition technique is widely used in industries (Ghatnekar Citation2018). The machine-learning algorithm also helps to predict the occurrence of defects in sheet metal forming processes (Dib, Oliveira, and Marques et al. Citation2020), and in the identificationof parts (Sheu et al. Citation2020). These unique characteristics of the ML algorithm influenced and justified the authors in deploy this methodology in the study.
Other than machine learning algorithm, other algorithms are used in sheet metal industries for various purposes. For instance, linear programming can be used to minimize the cost of sheet metal punching when batching orders (Herrmann and Delalio Citation2001). Kakandikar, Darade, and Nandedkar (Citation2009) deployed genetic algorithm to optimize the geometry parameters (e.g. die design, hammering sequence, blank holder pressure, etc.) in the sheet metal industry. Ashokkumar et al. (Citation2020) proposed the use of ranking algorithm to optimize the quality of parts produced in sheet metal forming. Jiao and Xing (Citation2018) used heuristic algorithm in analyzing the assembly deformation of parts, clamps and supporting locators in the sheet metal industry.
3.2 Description of the machine learning algorithm
• Step 1: Convert input image from .svg file (vector image) to .jpg or .png file (pixel image)
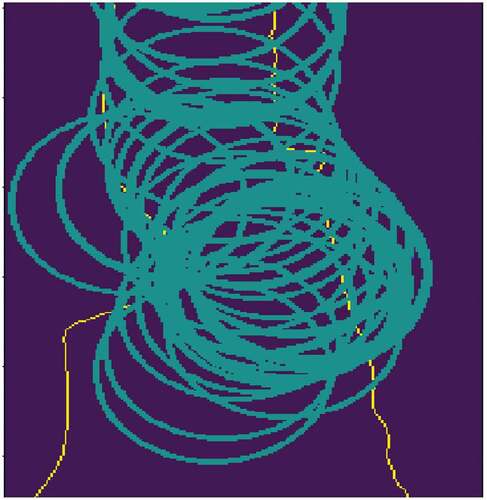
• Step 2: From the pixel image input, obtain the coordinates of the components. displays the necessary program for conversion of vector image to pixel image. visualizes the converted image from vector to pixel image.
Figure 1. Function to obtain the coordinates of components.
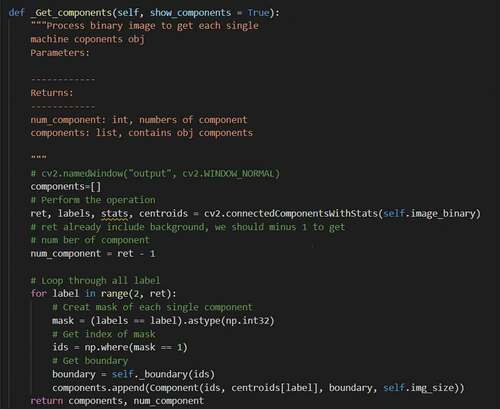
Figure 2. Transformation of vector image to pixel image.

• Step 3: Get rid of the body of the component.
The main purpose of this algorithm is computing the distance between components. In particular, the distance between the boundaries of those components needs to be measured. Therefore, there is no need to take care of the body. Furthermore, getting rid of the body also helps to reduce the running time of the algorithm.
• Step 4: Perform the detection
Let us assume that the threshold (minimum acceptable distance) is d (pixels). On every pixel p in the boundary, we plot a circle center p and radius d/2. Therefore, if any 2 circles which come from different components are overlapping each other, then this is the location we need to mark (because at this location, the distance of the 2 components is less than d). shows various circles over the components needed to find the gaps between them.
Figure 3. Various boundary circles over a single component.(a) The sample input image with (b) The corresponding graph white components.
3.3 Coordinates of components
As mentioned earlier, the most direct way to measure the distance dab between point a and point b in 2D dimension is from its coordinates: (xa, ya) and (xb, yb) respectively, using the formula:
However, how do we obtain the coordinates of the components in an image? The image basically contains two parts: components and background. The color of the background is completely different from the components. In our case, the background is black, while the component is not, which means in the matrix that if any entry takes the value of 0, it must belong to the background. Based on that, we have two approaches to solve this problem.
3.4 Algorithm used for the detection of narrow gaps
To detect the narrow gaps (less than a given threshold d), the authors performed the following steps:
Segment and identify the components in images.
Separate the components from each other. For each component, detect whether the gap between it and the others is larger than d or not.
Mark the area where the gap is less than d.
3.4.1 Segmentation and separation of the components
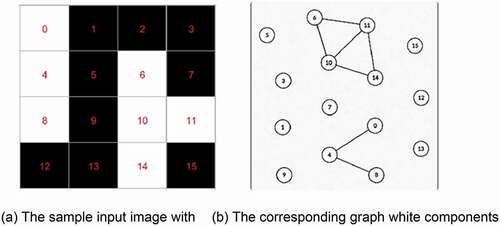
An input image has two parts: components (white) and background (black). It can be represented as an m × n matrix W, whose entries range from 0 (black) to 255 (white). Since the background is black, the components can be extracted by removing all the ‘0ʹ entries in the matrix. Furthermore, it is easy to see that the entries, which represent a component, can be formed in a set of vertices in an undirected graph G as shown in . Any vertex (also an entry of matrix W) ‘u’ in G has at most 8 adjacent nodes, which are entries around ‘u’. To detect a component in the image, firstly iterating over entries in W, if there is an entry Wij 6 = 0, consider it as a root, then reach other nodes. If it is reaching a node such that at least one of its adjacent nodes has non-zero value, then this node would be a part of the components. The process terminates if we reach the background i.e. entry that has ‘0ʹ value. Algorithm 1 below shows the pseudocode of the implementation of the above algorithm in order to obtain the coordinates of the components as well as their boundary.
Figure 4. The sample input image and its corresponding graph.
3.4.2 Detection of narrow gap
The information in is used to explain the detection of narrow gaps between two components in a worksheet. The gaps between components P and Q, as shown in , need to be identified. In order to identify the gaps, let us assume two arbitrary points, A and B, on components P and Q respectively. The distance between point A and point B is assumed as ‘d’. In order to detect the gaps between components P and Q, let us consider two circles, OA and OB, on components P and Q with centers at points A and B respectively with equal radius r = d/2. Based on this idea, the authors suggest an algorithm to identify the narrow gaps between components P and Q. According to the proposed algorithm, the narrow gaps between two circles OA and OB are not overlapping if the distance between points A and B is satisfied as:
Figure 5. Two overlapping circles of different components.
Algorithm:
Function Main (W):
for each entry u in W do
if u has value/= 0 and u has not been visited, then
Get – components (W, u)
Function Get- components (W, u):
Declare B as a set of boundary points
Declare P as a set of points of a component, including the boundary points. Initialize an empty queue Q
Insert u to B and Q
Mark u as visited entry while Q is not empty do
v = Q.back()
for each entry a around v do
if a has value = 0 and a has not been visited, then
Mark a as visited point
Insert a to Q
If a is a boundary point, then
Insert a to B
The pseudocode of this algorithm is described as below.
Function Detection(W):
for all components P in image do
for all points A in boundary of P do
Draw a circle OA, center in A, radius d
if there exists a point B in another component with P, in which the circle OB overlaps with OA
then
Output A and B as error points
3.4.3 Polygonization
To generate a polygon to visualize the error ”zones”, the authors applied Grahm’s Scan algorithm to find the convex hull of finite set of error points in the plane. Given the error points, this algorithm allows for the construction of a convex hull in O(n log n) time using only comparison, addition and multiplication operations. The details of Grahm’s Scan algorithm can be found in (Kong, Everett, and Toussaint Citation1990).
4. Study of a sheet metal company: an exploratory case example
4.1 Description of the case company
The case company operates in the sheet metal forming industry and is a manufacturer of sophisticated sheet metal forming machines. The company has a line of machines/solutions with various levels of automation available. One of the most sophisticated ones is fully automated and requires little human interaction. It has several product lines such as TheBEND – sheet metal bending, TheCOMBI – multifunctional systems, e.g. punching and laser cutting, TheLASER – sheet metal cutting with a laser with some products providing also welding and drilling capabilities, ThePUNCH – sheet metal punching, TheSYSTEM – a versatile range of solutions, which combines functionalities of the case company’s machines in one automated production line, TheSOFTWARE – a number of additional software solutions, which further optimize machine operations. In addition, With the Tulus® software family the company is capable of parts order and inventory handling, work scheduling and machine capacity monitoring, control and monitoring of machines’ tasks, control of material storage, production reports, integration with ERP (enterprise resource planning), and acting as MES (manufacturing execution system). The case company’s products are used in many industries: aerospace, agricultural, automotive, domestic appliances, elevators, HVAC, hospital and lab equipment, to list just a few. The case company is an innovative company that always searches for and is open to new ideas and close cooperation at different levels.
There are many facilities of the company in Italy, Finland, the USA and China, from which the company delivers machines and systems all over the world. The company’s sales and service network is active in over 80 countries, with direct presence or through a network of specialized dealers. The company’s product family offers highly advanced servo-electric solutions for punching, bending and integrated processes and is the widest in the world. All the products from the company are developed according to the ‘green means’ concept, combining sustainability and productivity.
Nesting applications are very advanced in the sheet metal industry. The initial target for the nesting algorithms is to reduce waste and optimize the utilization of the metal sheet process in the case company. However, once the components to be nested are organized too close to each other there is a risk that parts or the metal sheet frame that finally will be waste material will drop to the table. In the case of fully automated nesting like Libellula for SI Engineering (https://www.libellula.eu/media/sicam-tutorial/?lang=en), there is a risk that the nesting is too tight and the scrap that is supposed to stay on the frame of the metal sheet scrap will drop out. In case of manual operations, this is not a big issue – the operator simply removes the extra scrap from the worktable between loading a new metal sheet to the machine. However, in the case of fully automated work, like running the machine station unmanned during the night shift, the scrap material will cause a much bigger problem.
Once the scrap component drops on the worktable, the whole production process stops and waits for the morning for the operator to fix the error triggering situation. The simplest solution for this kind of problem is to organize the work queue so that the nesting that historically has not caused this kind of problem will be entered to a separate job queue to be manufactured during the unmanned working shift. In addition, a human operator can pre-check the nesting and estimate whether the nest will cause extra scrap. The most optimal solution would be a machine learning solution to automatically find the weak points from the nest and organize the job queue in order to optimize the throughput during the unmanned working shift.
4.2 Case definition and assumptions
This research focused on the problem of estimating the gaps between components for the sheet metal industry. We suppose all structural parts of the sheets are made with the same kinds of materials and fabricated by conventional machining processes. After analyzing the component punching problem, the gaps between the components are decided. These include the image of the components, weight of the sheets from which components were produced, punching rate, number of sheets punched, and cutting tool changes in the punching operation. To simplify the punching operation and increase its production rate in general, we considered the speed of punching rate, number of sheets in the process, and the number of changes of cutting tools in the process. In this case, we divided the punching complexity to four different levels (simple, medium, complex, and very complex). The study suggests that punched components can be categorized into two different levels for every geometric complexity of the structural components. The new punching problem contains two input variables (gap and complexity of the sheets) and one output (production rates). We try to find the relationship between inputs and outputs through machine learning methods.
This research study was conducted using machine and deep learning techniques to identify the weak points from the metal sheet. The process was as lean as possible and the images of the nesting results were used as input. The result ended with two job queues: one that needs operator presence and one that can be run unmanned. Besides the input images, the operator should be able to fine tune the settings of the validation process of the nests by specifying how wide the gap can be with various materials to keep the metal sheet scrap frame in one piece. The source images were in vector graphic format, which were converted to pixel graphics. After being able to operate the images in pixel graphic format, the machine learning algorithm was developed in order to identify the boundaries of the components on the sheet. After identifying the components, the actual gaps between the parts were measured.
5. Analysis of results
After applying input image as shown in (a) with the parameter threshold of 1.5 pixels, the output image is obtained as in (b). From the output, it can be seen that the algorithm works quiet well. It detects exactly the narrow locations of less than 1.5 pixels (the circles in )). In addition, it also returns the boundary exactly and removes the body of components.
Figure 6. Input and output images of the worksheet.(a) Input Image (b) Output Image.
5.1 Sensitivity to noise
The proposed algorithm goes through every single pixel in the input; therefore, it is very sensitive to noise, which could be the variation of brightness or color information in the image input. This problem can be solved by preprocessing the input image.
5.2 Running time
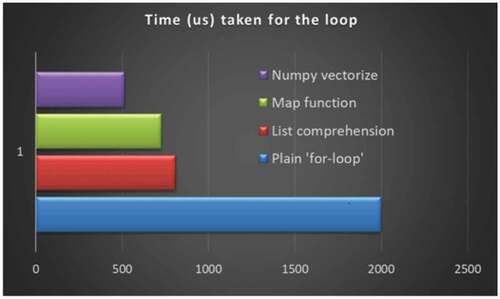
As mentioned earlier, this algorithm takes O (m ✕ n). In general, this is quite good for an application. For more complicated input (more noise, more components), this algorithm takes a little more time time to run. This problem can be solved by vectorizing the operations in the algorithm. This can produce a better running time by forgetting to use for-loop and using vectorized arithmetic instead, as shown in .
Figure 7. Comparative speeds of execution for conditional loop-based code block.
5.3 Gap detection
The gaps between each of the components are critical in order to punch the components after punching on the metal sheet. If the gaps between the components are too narrow, this creates a problem over the worktable by leaving some of the sections of the sheet on it. The rest of the parts stick on the worktable and trigger a stop of the automated grippers responsible for moving away the waste sheet to the trash bin. This also causes a complete shutdown of the punching operation and consequent production loss. The target of the case company was therefore to optimize the gaps between the components so that waste metal sheet does not stay on the worktable.
In order to optimize the gaps between the punched components, some pictures attached with the design of the components over the sheet metal were used to analyze the gaps. These pictures were in vector image format, and were converted to pixel images. This conversion makes the pictures more visible in order to optimize the gaps between the components. In addition, the authors emphasize here that the input image shows the components in white color and the background in black.
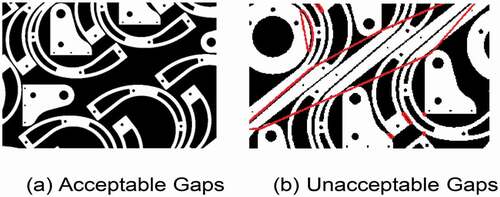
) visualizes the gaps between several components which are more than 5 pixels. They satisfy the design requirement, and as can be seen, no error is noticed. On the other hand, ) displays the gaps between components of more than 5 pixels which are not acceptable in terms of the design requirement and create problems on the worktable. Due to such inconsistencies with the design requirements, several errors are noticed after analysis, as are also shown in ).
Figure 8. Image and its pixel matrix.(a) Acceptable Gaps (b) Unacceptable Gaps.
5.4 Analysis of the gaps between the components
In order to optimize the gaps between punched components, some pictures attached with the design of the components over the sheet metal were taken into consideration to analyze the gaps. These pictures were in vector image format, which were converted to pixel image by machine learning algorithm. This conversion makes the pictures more visible to optimize the gaps between the components.
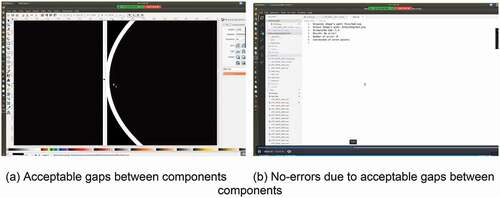
(a) visualizes the gaps between two adjacent components; it is 1.5 pixels and satisfies the design requirement with no error being noticed, as displayed in (b).
Figure 9. Visualization of acceptable gap between components and associated no-errors.(a) Acceptable gaps between components (b) No-errors due to acceptable gaps between components.
On the other hand, ) displays the gaps between components of more than 1.5 pixels: it is not acceptable in terms of design requirement and creates a problem on the worktable. Due to such inconsistencies with the design requirements, several errors are noticed after analysis and visualized in ).
Figure 10. Visualization of non-tolerable gap between components and associated errors.(a) Non-tolerable gap between components (b) Errors due to non-tolerable gap between components.
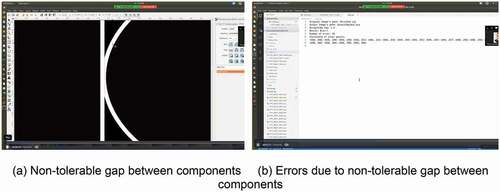
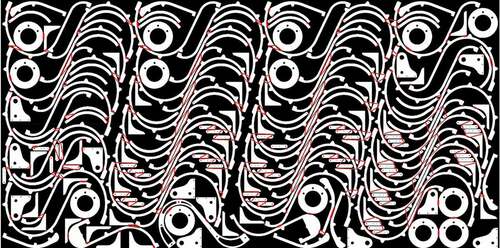
Such errors continue to increase as long as the optimum gaps between the components are not achieved. This optimization is done by computer vision algorithm, which is essentially a part of machine learning, as explained earlier. This optimization process facilitates the waste sheet management process after the necessary operations. visualizes the unacceptable gaps between the components as red polygons.
Figure 11. Red polygons show the too narrow gaps between components.
6. Managerial implications
Operational excellence is a key criterion for organizations to be profitable with higher customer satisfaction. Organizations are striving to achieve operational excellence within their limited resources. Any complexities or bottlenecks represent a heavy cost to organizational success and negatively affect customer goodwill. Organizational managers therefore always need to be careful to avoid such negative impacts on their organizations. Managers need to be capable of developing their situational awareness, which might evolve from their operational processes.
In this research, the overall objective was to bring about operational excellence by overcoming problems existing in an organization. The studied case company was suffering an operational problem, which was solved by applying an up-to-date technique known as computer vision. This computer vision, which is a branch of machine learning, helped to solve the existing problem in the company. This technique involved image processing which is deployed to detect the gaps between punched components. This image processing can be applied to other operational processes within organizations to solve other related problems.
The study results highlighted in this research provide a guideline for organizational managers to deploy state-of the-art technologies and tools for mutual benefit. In deploying such technologies and tools, managers also need to trade off their benefits with the associated costs involved. In using the deployed image processing technique within machine learning algorithm, managers would be able to avoid limitations to their operational processes and optimize the processes for competitive advantage.
7. Discussion and conclusions
During the study, a component analysis technique was used to create and narrow gap detection between components from images. It was observed from this study that the proposed algorithm works well, except for the fact that there are some problems that still need to be solved to obtain better results such as sensitivity to noise and speeding up the running time. The component analysis technique was adopted through image processing, where the computer vision principle was used. This image processing technique, which is an integral part of machine learning, is used to make the gaps between components clearly visible. It is critical to maintain the gaps between components during the drawing stage that supports the punching operation.
This study clearly identifies and contributes to improving the operation limitations of a case sheet metal company in Finland. The application of the component analysis technique, which was formulated through machine learning, helps the company’s operational flexibility and minimizes the production time. It ensures the maintaining of the shifts at the company during both day and night. For instance, in the case of complex components, where the gaps between them was critical, they were separated and allocated to the day shift when human operators can remove the waste sheet after the punching operation if blocked by the automated gripper. On the other hand, less complicated components, where there are sufficient gaps between the components, are allocated to the night shift, where automated grippers comfortably remove the waste sheets after operation. In this way, this gap optimization technique through machine learning application contributes to maintaining production stability and quality at the same time.
This study includes some limitations that can be improved in a future study. For instance, the runtime was not fast enough to execute the system within a reasonable time. The image processing can also be made noise free to produce faster image conversion, which is necessary to detect the gaps between components. Moreover, this study experienced many coordinate points during the error recognition process that can be minimized through optimization of the gaps between components as much as possible. In addition, a future study might continue to investigate and compare the study findings with other available algorithms and techniques such as genetic algorithm, heuristic algorithm, computer vision, simulation, etc. with the objective of solving the operational bottlenecks of the case company. Moreover, further study also can be initiated to investigate the component gaps through partial least square regression and popular feature extraction method.
Disclosure statement
No potential conflict of interest was reported by the author(s).
References
- Acceure. 2018. “Redefine Banking with Artificial Intelligence.” Retrieved 2 July 2020, from https://www.accenture.com/_acnmedia/pdf-68/accenture-redefine-banking.pdf
- Ademujimi T.T., M.P. Brundage, and V.V. Prabhu.“A Review of Current Machine Learning Techniques Used in Manufacturing Diagnosis.„ In: Lödding H., Riedel R., Thoben KD., von Cieminski G., Kiritsis D. (eds) Advances in Production Management Systems. The Path to Intelligent, Collaborative and Sustainable Manufacturing. APMS 2017. IFIP Advances in Information and Communication Technology, vol 513. Springer, Cham. 2017.https://doi.org/https://doi.org/10.1007/978-3-319-66923-6_48
- Anglisano, A., L. Casas, M. Anglisano, and I. Queralt. 2020. “Application of Supervised Machine-learning Methods for Attesting Provenance in Catalan Traditional Pottery Industry.” Minerals 10: 8. doi:https://doi.org/10.3390/min10010008.
- Ashokkumar, S. P., S. S. Sivam, S. Balasubramanian, and R. V. Nanditta. 2020. “Effects of Process Variables Optimization on the Quality of Parts Processed in High Speed Single Point Incremental Sheet Metal Forming by Ranking Algorithm.” Materials Today: Proceedings. https://doi.org/10.1016/j.matpr.2020.08.614.
- Backman, J., V. Kyllönen, and H. Helaakoski. 2019. “Methods and Tools of Improving Steel Manufacturing Processes: Current State and Future Methods.” IFAC-PapersOnLine 52: 1174–1179. doi:https://doi.org/10.1016/j.ifacol.2019.11.355.
- Baumers, M., and E. Özcan. 2016. “Scope for Machine Learning in Digital Manufacturing, Short Position Paper.” Royal Society Workshop, July 2016: “Realising the Benefits of Machine Learning in Manufacturing”, University of Nottingham, UK
- Bianconi, F., L. Ceccarelli, A. Fernández, and S. A. Saetta. 2014. “A Sequential Machine Vision Procedure for Assessing Paper Impurities.” Computers in Industry 65: 325–332. doi:https://doi.org/10.1016/j.compind.2013.12.001.
- Cakir, M., M. A. Guvenc, and S. Mistikoglu. 2021. “The Experimental Application of Popular Machine Learning Algorithms on Predictive Maintenance and the Design of IIoT Based Condition Monitoring System.” Computers & Industrial Engineering 151: 106948. doi:https://doi.org/10.1016/j.cie.2020.106948.
- Carbonneau, R., K. Laframboise, and R. Vahidov. 2008. “Application of Machine Learning Techniques for Supply Chain Demand Forecasting.” European Journal of Operations Research 184: 1140–1154. doi:https://doi.org/10.1016/j.ejor.2006.12.004.
- Carbo-Valverde, S., P. Cuadros-Solas, and F. Rodríguez-Fernández. 2020. “A Machine Learning Approach to the Digitalization of Bank Customers: Evidence from Random and Causal Forests.” PLoS ONE 15 (10): e0240362. doi:https://doi.org/10.1371/journal.pone.0240362.
- Chandran, P. 2018. “Disruption in Retail: AI, Machine Learning, and Big Data”, Medium (2018, July 23), Retrieved 20 June 2020, from https://towardsdatascience.com/disruption-in-retail-ai-machine-learning-big-data-7e9687f69b8f
- Chinnam, R. B. 2002. “Support Vector Machines for Recognizing Shifts in Correlated and Other Manufacturing Processes.” International Journal of Production Research 40: 4449–4466. doi:https://doi.org/10.1080/00207540210152920.
- Chiu, M.-C., C.-D. Tsai, and L. T-l T-L. 2020. “An Integrative Machine Learning Method to Improve Fault Detection and Productivity Performance in a Cyber-physical System.” Journal of Computer Information Science and Engineering 20(2): 12. pages. https://doi.org/https://doi.org/10.1115/1.4045663
- Danton, S., M. D. Char, A. Feudtner, and C. Feudtner. 2020. “Identifying Ethical Considerations for Machine Learning Healthcare Applications.” The American Journal of Bioethics 20 (11): 7–17. doi:https://doi.org/10.1080/15265161.2020.1819469.
- de Andrés, M. L. O., A. Poniszewska-Marańda, and L. A. Hernández Gómez. 2020. “Towards the Machine Learning Algorithms in Telecommunications Business Environment.” In Information Systems. EMCIS 2020. Lecture Notes in Business Information Processing, 402, edited by M. Themistocleous, M. Papadaki, and M. M. Kamal. Cham: Springer. 79-96.
- “Deloitte Technology, Media, and Telecommunications Predictions.” 2018. Retrieved 23 June 2020, from https://www2.deloitte.com/content/dam/Deloitte/global/Images/infographics/technologymediatelecommunications/gx-deloitte-tmt-2018-predictions-full-report.pdf
- Dib, M., B. Ribeiro, and P. Prates. 2018. “Model Prediction of Defects in Sheet Metal Forming Processes.” In: Pimenidis E., Jayne C. (eds) Engineering Applications of Neural Networks. EANN 2018. Communications in Computer and Information Science, vol 893. Springer, Cham. https://doi.org/https://doi.org/10.1007/978-3-319-98204-5_14
- Dib, M. A., N. J. Oliveira, A. E. Marques, et al. 2020. “Single and Ensemble Classifiers for Defect Prediction in Sheet Metal Forming under Variability.” Neural Computing & Applications 32:12335–12349. https://doi.org/10.1007/s00521-019-04651-6.
- Dutta, N., P. Kaliannan, and U. Subramaniam. 2021. “Application of Machine Learning Algorithm for Anomaly Detection for Industrial Pumps.” In Machine Learning Algorithms for Industrial Applications. Studies in Computational Intelligence, edited by S. Das, S. Das, N. Dey, and A. E. Hassanien, 237–263. Cham, 907: Springer.
- Garg, S., S. Sinha, A. K. Kar, and M. Mani. 2021. “A Review of Machine Learning Applications in Human Resource Management.” International Journal of Productivity and Performance Management. ahead-of-print No. https://doi.org/10.1108/IJPPM-08-2020-0427.
- Garre, A., M. C. Ruiz, and E. Hontoria. 2020. “Application of Machine Learning to Support Production Planning of a Food Industry in the Context of Waste Generation under Uncertainty.” Operations Research Perspectives 7: 100147. doi:https://doi.org/10.1016/j.orp.2020.100147.
- Ge, Z., Z. Song, S. X. Ding, and B. Huang. 2017. “”Data Mining and Analytics in the Process Industry: The Role of Machine Learning.”.” IEEE Access 5: 20590–20616. doi:https://doi.org/10.1109/ACCESS.2017.2756872.
- Ghatnekar, S. 2018. “Use Machine Learning to Detect Defects on the Steel Surface.” Available at: https://software.intel.com/content/www/us/en/develop/articles/use-machine-learning-to-detect-defects-on-the-steel-surface.html, accessed on 11 April 2021
- Golkarnarenji, G., M. Naebe, K. Badii, A. S. Milani, R. N. Jazar, and H. Khayyam. 2019. “A Machine Learning Case Study with Limited Data for Prediction of Carbon Fiber Mechanical Properties.” Computers in Industry 105: 123–132. doi:https://doi.org/10.1016/j.compind.2018.11.004.
- Gottsegen, G. 2020. “Machine Learning Is Changing the Way Retailers Do Business.” Built In. Retrieved 3 July 2020, from https://builtin.com/artificial-intelligence/machine-learning-ecommerce-retail
- Greenspan, H., B. van Ginneken, and R. M. Summers. 2016. “Deep Learning in Medical Imaging: Overview and Future Promise of an Exciting New Technique.” IEEE Transactions, Medical Imaging 35: 1153–1159. doi:https://doi.org/10.1109/TMI.2016.2553401.
- Gupta, A. 2017. “Machine Learning Challenges in the Implementation of Industrial Internet of Things.” available at: https://iiot-world.com/artificial-intelligence-ml/artificial-intelligence/machine-learning-challenges-in-the-implementation-of-industrial-internet-of-things/, accessed on 13 April 2021.
- Gupta, S., and R. R. Sedamkar. 2020. “Machine Learning for Healthcare: Introduction.” In Machine Learning with Health Care Perspective. Learning and Analytics in Intelligent Systems, 13, edited by V. Jain and J. Chatterjee. Cham: Springer.1-25.
- Hajizadeh, Y. 2019. “Machine Learning in Oil and Gas: SWOT Analyses Approach.” Journal of Petroleum Science and Engineering 176: 661–663. doi:https://doi.org/10.1016/j.petrol.2019.01.113.
- Hamouche, E., and E. G. Loukaides. 2018. “Classification and Selection of Sheet Forming Processes with Machine Learning.” International Journal of Computer Integrated Manufacturing 31: 921–932. doi:https://doi.org/10.1080/0951192X.2018.1429668.
- Hegde, J., and B. Rokseth. 2020. “Applications of machine learning methods for engineering risk assessment – A review.” Safety Science, 122, 104492, https://doi.org/https://doi.org/10.1016/j.ssci.2019.09.015.
- Herrmann, J. W., and D. R. Delalio. 2001. “Algorithms for Sheet Metal Nesting.” IEEE Transactions on Robotics and Automation 17: 183–190. doi:https://doi.org/10.1109/70.928563.
- Huang, H., and J. Zhu. 2021. “A Short Review of the Application of Machine Learning Methods in Smart Airports.” Journal of Physics: Conference Series 1769: 012010.
- Huber, J., and H. Stuckenschmidt. 2020. “Daily Retail Demand Forecasting Using Machine Learning with Emphasis on Calendric Special Days.” International Journal of Forecasting 36: 1420–1438. doi:https://doi.org/10.1016/j.ijforecast.2020.02.005.
- Jayant, A., A. Agarwal, and V. Gupta. 2021. “Application of Machine Learning Technique for Demand Forecasting: A Case Study of the Manufacturing Industry.” In: Pandey P.M., Kumar P., Sharma V. (eds) Advances in Production and Industrial Engineering. Lecture Notes in Mechanical Engineering 403–421, Springer, Singapore. https://doi.org/https://doi.org/10.1007/978-981-15-5519-0_31
- Jiao, Z., and Y. Xing. 2018. “Clamping-sequence Optimisation Based on Heuristic Algorithm for Sheet-metal Components.” International Journal of Production Research 56: 7190–7200. doi:https://doi.org/10.1080/00207543.2017.1410245.
- Joseph, J., O. Sharif, A. Kumar, S. Gadkari, and A. Mohan. 2014. “Using Big Data for Machine Learning, Analytics in Manufacturing, Manufacturing Innovation and Transformation Group.” White Paper available at: http://tinyurl.com/zfpvzau, Accessed on 07 April 2021.
- Kakandikar, G. M., P. D. Darade, and V. M. Nandedkar. 2009. “Applications of Evolutionary Algorithms to Sheet Metal Forming Processes: A Review.” International Journal of Machine Intelligence 1: 47–49. doi:https://doi.org/10.9735/0975-2927.1.2.47-49.
- Kang, Z., C. Catal, and B. Tekinerdogan. 2020. “Machine Learning Applications in Production Lines: A Systematic Literature Review.” Computers & Industrial Engineering 149: 106773. doi:https://doi.org/10.1016/j.cie.2020.106773.
- Kashid, S., and S. Kumar. 2012. “Applications of Artificial Neural Network to Sheet Metal Work - A Review.” American Journal of Intelligent System 2: 168–176. doi:https://doi.org/10.5923/j.ajis.20120207.03.
- Kim, D.-H., T. J. Y. J. Y. Kim, X. Wang, M. Kim, Y.-J. Quan, J. W. Oh, J. S.-H. Min, H. Kim, B. Bhandari, I. Yang, and S.-H. Ahn. 2018. “Smart Machining Process Using Machine Learning: A Review and Perspective on Machining Industry.” International Journal of Precision Engineering and Manufacturing-Green Technology 5: 555–568. doi:https://doi.org/10.1007/s40684-018-0057-y.
- Köksal, G., İ. Batmaz, and M. C. Testik. 2011. “A Review of Data Mining Applications for Quality Improvement in Manufacturing Industry.” Expert Systems and Applications 38: 448–467. doi:https://doi.org/10.1016/j.eswa.2011.04.063.
- Kong, X., H. Everett, and G. Toussaint. 1990. “The Graham Scan Triangulates Simple Polygons.” Pattern Recognition Letters 11: 713–716. doi:https://doi.org/10.1016/0167-8655(90)90089-K.
- Kwitek, M. 2016. “A Feasibility Study of Azure Machine Learning for Sheet Metal Fabrication.” Master’s thesis, Industrial Management Unit, University of Vaasa, Finland.
- Lee, I. 2017. “Big Data: Dimensions, Evolution, Impacts, and Challenges.” Business Horizons 60: 293–303. doi:https://doi.org/10.1016/j.bushor.2017.01.004.
- Lee, I., and K. Lee. 2015. “The Internet of Things (Iot): Applications, Investments, and Challenges for Enterprises.” Business Horizons 58: 431–440. doi:https://doi.org/10.1016/j.bushor.2015.03.008.
- Lee, I., and Y. J. Shin. 2020. “Machine Learning for Enterprises: Applications, Algorithm Selection, and Challenges.” Business Horizons 63: 157–170. doi:https://doi.org/10.1016/j.bushor.2019.10.005.
- Li, Z., Y. Wang, and K. Wang. 2019. “A Deep Learning Driven Method for Fault Classification and Degradation Assessment in Mechanical Equipment.” Computers in Industry 104: 1–10. doi:https://doi.org/10.1016/j.compind.2018.07.002.
- Lin, Z. C., and D. Y. Chang. 1995. “Application of a Neural Network Machine Learning Model in the Selection System of Sheet Metal Bending Tooling.” Artificial Intelligence and Engineering 10: 21–37. doi:https://doi.org/10.1016/0954-1810(95)00013-5.
- LinkedIn’s. 2017. “U.S. Emerging Jobs Report.” Retrieved 26 June 2020, from https://economicgraph.linkedin.com/research/LinkedIns-2017-US-Emerging-Jobs-Report
- Massel, L. V., O. M. Gerget, A. G. Massel, and T. G. Mamedov. 2019. “The Use of Machine Learning in Situational Management in Relation to the Tasks of the Power Industry.” EPJ Web of Conferences 217, 01010. Irkutsk, Baikal Lake, Russia.
- McCoy, J. T., and L. Auret. 2019. “Machine-learning Applications in Minerals Processing: A Review.” Minerals Engineering 132: 95–109. doi:https://doi.org/10.1016/j.mineng.2018.12.004.
- McDowell, H. 2018. “JP Morgan Trading Team Develops Machine Learning Model for Equity Desk.” The Trade (2018, April 12), Retrieved 20 June 2020, from https://www.thetradenews.com/jp-morgans-trading-team-develop-machine-learning-model-equity-desk/
- Min, Q., Y. Lu, Z. Liu, C. Su, and B. Wang. 2019. “Machine Learning Based Digital Twin Framework for Production Optimization in Petrochemical Industry.” International Journal of Information Management 49: 502–519. doi:https://doi.org/10.1016/j.ijinfomgt.2019.05.020.
- Motta, M., M. C. Neto, and P. Sarmento. 2021. “A Mixed Approach for Urban Flood Prediction Using Machine Learning and GIS.” International Journal of Disaster Risk Reduction 56: 102154. doi:https://doi.org/10.1016/j.ijdrr.2021.102154.
- Musani, P. 2018. “Eden: The Tech That’s Bringing Fresher Groceries to You.” Walmart. Available at https://corporate.walmart.com/newsroom/community/20180301/eden-the-tech-thats-bringing-fresher-groceries-to-you, 1 March 2018.
- Najafabadi, M. K., M. N. Mahrin, S. Chuprat, and H. M. Sarkan. 2017. “Improving the Accuracy of Collaborative Filtering Recommendations Using Clustering and Association Rules Mining on Implicit Data.” Computer and Human Behavior 67: 113–128. doi:https://doi.org/10.1016/j.chb.2016.11.010.
- Nithya, B., and V. Ilango. 2017. “Predictive Analytics in Health Care Using Machine Learning Tools and Techniques.” International Conference on Intelligent Computing and Control Systems (ICICCS), Madurai, India, 492–499.
- O’Donovan, P., C. Gallagher, K. Leahy, and D. T. J. O’Sullivan. 2019. “A Comparison of Fog and Cloud Computing Cyber-physical Interfaces for Industry 4.0 Real-time Embedded Machine Learning Engineering Applications.” Computers in Industry 110: 12–35. doi:https://doi.org/10.1016/j.compind.2019.04.016.
- Parkes, A. J., E. Özcan, and D. Karapetyan. 2015. “A Software Interface for Supporting the Application of Data Science to Optimisation.” LION 9, LNCS 8994: 306–311.
- Ren, Y. 2021. “Optimizing Predictive Maintenance with Machine Learning for Reliability Improvement.” ASME J . Risk Uncertainty Part B . https://doi.org/10.1115/1.4049525.
- Rizzi, W., Z. M. Wang, and K. Zielinski. 2020. “How Machine Learning Can Improve Pricing Performance.” McKinsey & Company (2018, September), Retrieved 3 July 2020, from https://www.mckinsey.com/industries/financial-services/our-insights/how-machine-learning-can-improve-pricing-performance
- Sánchez-Medina, A. J., and E. C-Sánchez. 2020. “Using Machine Learning and Big Data for Efficient Forecasting of Hotel Booking Cancellations.” International Journal of Hospitality Management 89: 102546. doi:https://doi.org/10.1016/j.ijhm.2020.102546.
- Sarkar, S., T. Weyde, A. d’Avila, G. Garcez, S. Slabaugh, and C. P. Dragicevic. 2016. “Accuracy and Interpretability Trade-offs in Machine Learning Applied to Safer Gambling.” Retrieved 3 July 2020, from https://pdfs.semanticscholar.org/8f67/7a206e647c1a0bddf2d54175801633d5a5ec.pdf
- Sharp, M., R. Ak, and T. Hedberg. 2018. “A Survey of the Advancing Use and Development of Machine Learning in Smart Manufacturing.” Journal of Manufacturing Systems? 48: 170–179. doi:https://doi.org/10.1016/j.jmsy.2018.02.004.
- Sheu, R., Y. Lin, C. Huang, L. Chen, M. S. Pardeshi, and H. Tseng. 2020. “IDS-DLA: Sheet Metal Part Identification System for Process Automation Using Deep Learning Algorithms.” IEEE Access 8: 127329–127342. doi:https://doi.org/10.1109/ACCESS.2020.3007257.
- Srdoč, A., I. Bratko, and A. Sluga. 2007. “Machine Learning Applied to Quality Management - A Study in Ship Repair Domain.” Computers in Industry 58: 464–473. doi:https://doi.org/10.1016/j.compind.2006.09.013.
- Stoerkle, D. D., P. Seim, L. Thyssen, and B. Kuhlenkoetter. 2016. “Machine Learning in Incremental Sheet Forming.” Proceedings of 47th International Symposium on Robotics, Munich, Germany, Germany, 667–673, 21–22 June.
- Sun, S., Y. Wei, K.-L. Tsui, and S. Wang. 2019. “Forecasting Tourist Arrivals with Machine Learning and Internet Search Index.” Tourism Management 70: 1–10. doi:https://doi.org/10.1016/j.tourman.2018.07.010.
- Sung, T. K. 2018. “Industry 4.0: A Korea Perspective.” Technology Forecasting and Social Change 132: 40–45. doi:https://doi.org/10.1016/j.techfore.2017.11.005.
- Tsai, S.-Y., and J.-Y. Chang. 2018. “Parametric Study and Design of Deep Learning on Leveling System for Smart Manufacturing.” 2018 IEEE International Conference on Smart Manufacturing, Hsinchu, Taiwan, 8–9 February.
- Turilli, M. 2020 . “Ethical Protocols Design.” Ethics in Information Technology 9: 49–62. doi:https://doi.org/10.1007/s10676-006-9128-9.
- Weichert, D., P. Link, A. Stoll, S. Ruping, S. Ihlenfeldt, and S. Wrobel. 2019. “A Review of Machine Learning for the Optimization of Production Processes.” The International Journal of Advanced Manufacturing Technology 104: 1889–1902. doi:https://doi.org/10.1007/s00170-019-03988-5.
- Woolf, A., and A. McIntyre. 2018. “Realizing the Full Value of AI in Banking.” Accenture (2018, April 4), Retrieved 26 June 2020, from https://www.accenture.com/us-en/insights/banking/future-workforce-banking-survey
- Wu, X., J. Wang, A. Flitman, and P. Thomson. 1999. “Neural and Machine Learning to the Surface Defect Investigation in Sheet Metal Forming.” Proceedings of 6th International Conference on Neural Information Process Perth, Australia, November 16-20, 1088–1093.
- Wuest, T., D. Weimer, C. Irgens, and K.-D. Thoben. 2016. “Machine Learning in Manufacturing: Advantages, Challenges, and Applications.” Production & Manufacturing Research: An Open Access Journal 23–45. doi:https://doi.org/10.1080/21693277.2016.1192517.
- Xie, Q. 2020. “Machine learning in human resource system of intelligent manufacturing industry.” Enterprise Information Systems, Taylor and Francis, London, UK.https://doi.org/10.1080/17517575.2019.1710862
- Xu, Z., and J. H. Saleh. 2021. “Machine Learning for Reliability Engineering and Safety Applications: Review of Current Status and Future Opportunities.” Reliability Engineering & System Safety 211: 107530. doi:https://doi.org/10.1016/j.ress.2021.107530.
- Yeh, T.-H., and S. Deng. 2012. “Application of Machine Learning Methods to Cost Estimation of Product Life Cycle.” International Journal of Computer Integrated Manufacturing 25: 340–352. doi:https://doi.org/10.1080/0951192X.2011.645381.
- Yildirim, P., D. Birant, and T. Alpyildiz. 2018. “Data Mining and Machine Learning in Textile Industry.” WIREs Data Mining and Knowledge Discovery 8 (1): e1228. doi:https://doi.org/10.1002/widm.1228.
- Zekić-Sušac, M., S. Mitrović, and A. Has. 2021. ““Machine Learning Based System for Managing Energy Efficiency of Public Sector as an Approach Towards Smart Cities”. International.” Journal of Information Management 58: 102074.
- Zhang, J., P. Wang, and R. X. Gao. 2019. “Deep Learning-based Tensile Strength Prediction in Fused Deposition Modeling.” Computers in Industry 107: 11–21. doi:https://doi.org/10.1016/j.compind.2019.01.011.
- Zhu, R., X. Hu, J. Hou, and X. Li. 2020. “Application of Machine Learning Techniques for Predicting the Consequences of Construction Accidents in China.” Process Safety and Environmental Protection 145: 293–302. doi:https://doi.org/10.1016/j.psep.2020.08.006.
- Zwierzycki, M., P. Nicholas, and M. Ramsgaard Thomsen. 2018. “Localised and Learnt Applications of Machine Learning for Robotic Incremental Sheet Forming.” In: De Rycke K. et al.(eds) Humanizing Digital Reality. Springer, Singapore. 382, https://doi.org/https://doi.org/10.1007/978-981-10-6611-5_32