
Abstract
Objective
To explore the correlation of triglyceride-glucose index (TyG) index with metabolic syndrome (MetS) and metabolic risk factors, and to assess the predictive value of TyG for MetS in women with PCOS.
Methods
This is a retrospective cross-sectional study that included 819 women diagnosed with PCOS and 3122 women without PCOS from January 2018 to December 2021. The definition of MetS adopted in this study was the International Diabetes Federation (IDF) criteria. The TyG index was calculated as the ln (fasting triglyceride level [mg/dL] × fasting glucose level [mg/dL]/2).
Results
MetS was diagnosed in 266 women (32.5%) among 819 subjects with PCOS, and in 287 women (9.2%) among 3122 subjects without PCOS. Logistic regression analysis showed that women in the highest tertile of TyG index had the highest prevalence of MetS (OR = 3.66, 95%CI: 1.28–10.49) after adjusting for confounding factors. Compared with the lowest tertile, PCOS women in the highest tertile showed the highest odds ratio of hypertension, obesity, central obesity, hyperglycemia and dyslipidemia. Furthermore, TyG index was able to identify MetS in women with PCOS, and the optimal cutoff values were 8.65 (Youden index = 0.65).
Conclusion
TyG index was positively and independently correlated with the prevalence of MetS, which also indicated a good predictive ability in women with PCOS.
Introduction
Polycystic ovary syndrome (PCOS) is a common reproductive and endocrine disorder characterized by hyperandrogenism, oligo-anovulation and polycystic ovarian morphology, which affects 4%–21% of reproductive-aged females [Citation1]. Most women with PCOS are firstly diagnosed during their outpatient visit in gynecology or reproductive center with the chief complaint of irregular menstruation or infertility [Citation2]. However, irrespective of these reproductive disorders in women of childbearing age, PCOS is also closely related to the long-term metabolic consequences, including impaired glucose tolerance, type-2 diabetes, and cardiovascular and cerebrovascular diseases [Citation3, Citation4]. So far, the underlying metabolic pathogenesis in women with PCOS has not been clarified yet, which adds difficulties in intervening with precautions at a metabolic level.
Metabolic syndrome (MetS) is a constellation of various metabolic disorders, including excessive abdominal fat accumulation, hyperlipidemia, high blood pressure, and hyperglycemia, which shares a lot of similarities with PCOS in terms of metabolism. Insulin resistance has been reported to be one of the potential mechanisms and the central links in the pathogenesis of PCOS and various metabolic diseases [Citation5, Citation6]. Triglyceride-glucose (TyG) index was firstly introduced in 2008 as a specific and reliable parameter for insulin resistance among apparently healthy subjects and could be an alternative to the expensive and complicated standard insulin test (hyperinsulinemic-euglycemic clamp test) in undeveloped areas [Citation7]. It has been reported that in Iranian women with PCOS, the TyG index is closely related to insulin resistance [Citation8]. Moreover, elevated TyG index was significantly correlated with a higher prevalence of type II diabetes, contrast-induced nephropathy and poorer prognosis of cardiovascular diseases [Citation9–11]. However, studies focusing on the association between TyG index and MetS with in women with PCOS are scarce. Therefore, the aim of this study was to investigate the correlation between TyG index and MetS as well as to compare the predictive value of TyG index for MetS in women with PCOS.
Patients and methods
Participants
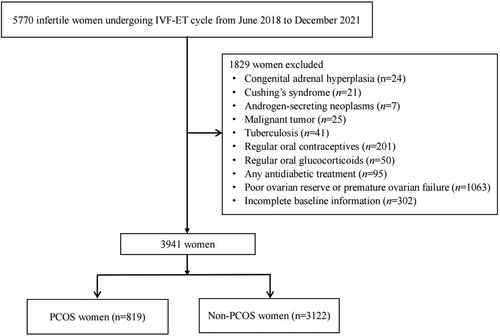
This retrospective cross-sectional study was conducted at the reproductive center of the First Affiliated Hospital of Wenzhou Medical University from June 2018 to December 2021. Initially, a total of 5770 women were included in this study. The exclusion criteria were women with a history of congenital adrenal hyperplasia, androgen-secreting neoplasms, Cushing's syndrome, tuberculosis, malignant tumor, regular oral glucocorticoids, oral contraceptives or any antidiabetic treatment, women with premature ovarian failure or poor ovarian reserve, or incomplete baseline information. Finally, a total of 3941 women were included for further analysis, of which 819 women were diagnosed with PCOS. The flow chart of this study design is shown in . This study was approved by the Ethics Committee of the First Affiliated Hospital of Wenzhou Medical University (2022R035). Written informed consent for the whole procedure was obtained from all participating patients.
Figure 1. Flow chart of the study design.
Definitions
After ruling out endocrinopathies that mimic PCOS, the diagnostic criteria of PCOS should include two out of three following features according to the 2003 Rotterdam diagnostic criteria [Citation12]: 1) abnormal menstruation (amenorrhea or oligomenorrhea); 2) biochemical and/or clinical hyperandrogenism, including hirsutism (Ferriman–Gallwey score > 6) or testosterone concentration > 2.81 nmol/L; and 3) polycystic ovarian morphology under B-ultrasound, as detailed in our previous study [Citation13]. The definition of MetS in this study was in accordance with the International Diabetes Federation (IDF) criteria, and at least three of the following factors should be included to make a definite diagnosis of MetS: (1) central obesity (waist circumference≥80 cm for Chinese female population) [Citation14]; (2) elevated blood pressure (systolic blood pressure≥130 or diastolic blood pressure≥85 mmHg); (3) hyperglycemia (fasting blood glucose≥5.60 mmol/L) [Citation15]; (4) increased triglycerides (TG≥1.69 mmol/L); (5) decreased high-density lipoprotein (HDL < 1.29 mmol/L). The prevalence of MetS was calculated as the number of women diagnosed with MetS divided by the total number of PCOS or non-PCOS women. The definitions of obesity (body mass index (BMI)≥25 kg/m2), hypertension (systolic blood pressure (SBP)≥140 mmHg or diastolic blood pressure (DBP)≥90 mmHg, or use of any antihypertensive medication within 2 weeks), and dyslipidemia (total cholesterol (TC)≥6.22 mmol/L or TG≥2.26 mmol/L or HDL <1.04 mmol/L, or low-density lipoprotein (LDL)≥4.14 mmol/L) have been detailed in our previous study [Citation13]. Insulin resistance and pancreatic β-cell function were estimated by the homeostasis model assessment of insulin resistance (HOMA-IR; calculated as FBG (mmol/L) x fasting insulin (FINS, mIU/L)/22.5) and HOMA of β-cell function (HOMA-β, calculated as (20 × FINS)/(FBG-3.5)) index, respectively. The TyG index was calculated as the ln (fasting triglyceride level [mg/dL] × fasting glucose level [mg/dL]/2).
Anthropometric measurement and laboratory measurements
The calculation of BMI was the body weight in kilograms divided by the height in meters squared [Citation16]. Waist circumference (WC) was measured at the midpoint between the lowest rib and the iliac crest [Citation17]. Blood pressure was measured in the sitting position with an electronic sphygmomanometer after 10 min rest. All the anthropometric measurements were completed by one qualified nurse in our center. Metabolic and hormonal parameters were obtained by analyzing the fasting blood samples after an overnight fast of at least 8 h during the menstrual period. The assay methods of all the laboratory testing in this study have been detailed in our previous study [Citation18]. The inter-assay and the intra-assay variations were less than 10% for all the assay methods.
Statistical analysis
SPSS 23.0 software (IBM Corporation) and MedCalc Application 19.0.4 software were adopted for the statistical analysis. Baseline data with skewed distributions were presented as the medians (interquartile ranges), otherwise were presented as mean ± standard deviation. The Student's t-test or Kruskal–Wallis test was used for analyzing the differences of baseline characteristics between PCOS and non-PCOS women. Women with or without PCOS were divided into three frequency groups according to the TyG index. The value lied below one third of the value was denoted by tertile 1 (T1). The other two tertiles were denoted as T2 and T3, respectively. For continuous variables, p values for trends across tertiles were calculated by linear regression analysis. Abnormally distributed data were logarithmically transformed prior to linear regression analysis. Logistic regression analysis was performed to obtain the prevalence ratios and 95% confidence interval (CI) of TyG index for MetS based on tertiles of TyG index. Model 1 was unadjusted. Age and BMI were adjusted in model 2. In model 3, SBP, WC, LH/FSH ratio (log-transformed), T (log-transformed), FINS (log-transformed), TC, HDL and LDL were further adjusted. Logistic regression analysis was performed to obtain the odds ratios for each metabolic risk factors based on the tertiles of TyG index after adjusting for relevant variables. Meanwhile, p values for trends across the tertiles were calculated by the Cochran–Mantel–Haenszel method. Receiver operating characteristic (ROC) curves were used to compare the predictive ability of TyG index, FBG, TG, HDL, LDL and HOMA-IR for MetS by calculating the area under the curve (AUC). The Youden index, defined as sensitivity + specificity − 1, was calculated to identify the optimal cutoff points. All the p values lower than 0.05 were considered statistically significant.
Results
Comparison of baseline characteristics in PCOS and non-PCOS women
The comparison of general demographic and metabolic characteristics between PCOS and non-PCOS women is shown in . The values of BMI, WC, SBP, DBP, basal LH, LH/FSH ratio, basal T, AMH, TyG index, FBG, FINS, HOMA-IR, HOMA-β, TC, TG and LDL were significantly higher in PCOS group, while the basal FSH and HDL in PCOS group were significantly lower than that in non-PCOS group (p < 0.05). No significant differences were observed in age, basal E2 and thyroid stimulating hormone (TSH) levels between the groups (p > 0.05). Of the 819 subjects with PCOS, 266 (32.5%) were diagnosed with MetS. Hypertension, obesity, central obesity, hyperglycemia, and dyslipidemia were diagnosed in 61 (7.4%), 277 (33.8%), 401 (49.0%), 171 (20.9%) and 271 (33.1%) women, respectively. In 3122 women without PCOS, the prevalence of MetS was 9.2%. Hypertension, obesity, central obesity, hyperglycemia, and dyslipidemia were diagnosed in 62 (2.0%), 395 (12.7%), 729 (23.4%), 319 (10.2%) and 451 (14.4%) women, respectively. Compared with non-PCOS women, the prevalence of MetS, hypertension, obesity, central obesity, hyperglycemia, and dyslipidemia was significantly higher in women with PCOS (p < 0.001).
Table 1. Baseline characteristics in PCOS and non-PCOS women.
Prevalence ratios for MetS according to the tertiles of TyG index in PCOS and non-PCOS women
The prevalence ratios of MetS according to the tertiles of TyG index in women with and without PCOS were shown in . Compared with the lowest tertile, women with PCOS in the highest tertile showed the highest prevalence ratio of MetS (OR = 9.45, 95% CI: 6.11–14.61). After adjusting for traditional confounding factors of age and BMI in model 2, the ORs for the prevalence of MetS, as compared with T1, were 2.79 (95% CI, 1.40–5.55) for T2, and 7.97 (95% CI, 4.00–15.85) for T3, respectively (p for trend <0.001). Following further adjustment in model 3, an 55% and 266% increase in prevalence ratios for MetS was found in the T2 and T3, respectively, compared with those in the first tertile (p for trend <0.001). Likewise, in women without PCOS, there was a similar trend of the prevalence ratio for MetS in model 1 and model 2 as compared with PCOS women (p for trend =0.02). However, after further adjustment in model 3, no significant difference was detected in the prevalence ratio of MetS in T2 and T3 when compared with T1 (p for trend =0.06).
Table 2. Prevalence ratios for MetS according to the tertiles of TyG index.
Odds ratios for metabolic risk factors based on the tertiles of TyG index
The odds ratios for metabolic risk factors based on the tertiles of TyG index are shown in . In women with PCOS, after adjusting for certain variables, the odds ratios of hypertension, obesity, central obesity, hyperglycemia and dyslipidemia increased significantly from the lowest tertile of TyG index to the highest (P for trend< 0.001). Compared with the lowest tertile, PCOS women in the highest tertile showed the highest odds ratio of hypertension (OR = 3.14, 95%CI: 1.14–8.62), obesity (OR = 12.52, 95%CI: 4.55–34.43), central obesity (OR = 3.90, 95%CI: 2.17–7.00), hyperglycemia (OR = 7.51, 95%CI: 3.87–14.61) and dyslipidemia (OR = 2.48, 95%CI: 1.69–3.65). However, in women without PCOS, only the odds ratios of obesity and hyperglycemia increased significantly from the lowest tertile to the highest (P for trend< 0.05) Compared with the lowest tertile, non-PCOS women in the highest tertile showed the highest odds ratio of obesity (OR = 1.94, 95%CI: 1.39–2.70) and hyperglycemia (OR = 1.39, 95%CI: 1.04–1.87).
Table 3. Odds ratios for metabolic risk factors based on tertiles of TyG index in PCOS and non-PCOS.
The ROC curves of TyG index and other biochemical indicators for MetS
The ROC curves constructed to compare the predictive values of TyG index and other biochemical indicators for MetS are shown in . In women with PCOS, the cutoff value of TyG index was 8.65 when identifying MetS in women with PCOS (). The AUC (95% CI) for TyG index was 0.88, which was significantly larger than that for FBG, LDL and HOMA-IR (p < 0.001). The AUC of TyG index in identifying MetS was larger than those of TG and HDL. However, there were no significant differences between those AUCs. In women without PCOS, the trends of all the ROC curves were similar ().
Figure 2. Receiver operating characteristic curves for the detection of MetS using various metabolic parameters.
Abbreviations: TyG index, triglyceride-glucose index; FBG, fasting blood glucose; TG, triglycerides; HDL, high-density lipoprotein; LDL, low-density lipoprotein; HOMA-IR, homeostasis model assessment of insulin resistance
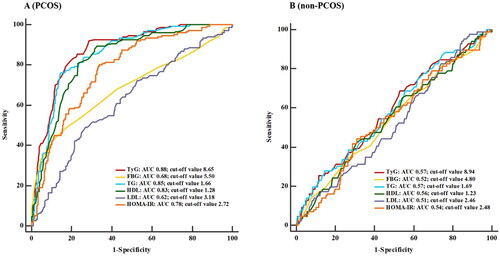
The cutoff points, sensitivities, specificities, positive and negative predictive values of various biochemical indicators mentioned above are shown in . The optimal cutoff points of TyG index, FBG, TG, HDL, LDL and HOMA-IR in predicting MetS were 8.65 (Youden index= 0.65), 5.50 mmol/L (Youden index= 0.33), 1.66 mmol/L (Youden index= 0.63), 1.28 mmol/L (Youden index= 0.55), 3.18 mmol/L (Youden index= 0.20) and 2.72 (Youden index= 0.46), respectively. The positive predictive value (PPV) and negative predictive value (NPV) of TyG index were 68.33% and 91.11%, respectively.
Table 4. AUC, Cutoff points, sensitivities, specificities, positive and negative predictive values of various biomarkers for MetS.
In non-PCOS women, the AUC of TyG index was 0.57, which was comparable to that of FBG, TG, HDL, LDL and HOMA-IR (p > 0.05). The optimal cutoff points of TyG index, FBG, TG, HDL, LDL and HOMA-IR in predicting MetS were 8.94 (Youden index= 0.11), 4.80 mmol/L (Youden index= 0.04), 1.69 mmol/L (Youden index= 0.10), 1.23 mmol/L (Youden index= 0.11), 2.46 mmol/L (Youden index= 0.06) and 2.48 (Youden index= 0.13), respectively. All the biochemical indicators showed low PPV and high NPV.
Discussion
The current study aimed at assessing the association between TyG index and metabolic syndrome in women with PCOS compared to the controls. In the present study, we found that TyG index was strongly and independently associated with MetS in women with PCOS. The prevalence of MetS and metabolic risk factors was also much higher in women with PCOS than non-PCOS women. Additionally, TyG index was independently associated with risk factors for MetS including hypertension, obesity, central obesity, hyperglycemia and dyslipidemia women with PCOS, while in women without PCOS, TyG index was only independently associated with obesity and hyperglycemia.
It has been reported that the prevalence of MetS in women with PCOS ranged between11.7%-46% according to different regions around the world [Citation19–21]. Moreover, the prevalence of MetS in PCOS women is almost 3.3-fold higher compared with non-PCOS women [Citation22], which is in accordance with our findings. A randomized controlled study conducted in 1508 women with PCOS undergoing IVF-ET has shown that MetS is independently and negatively associated with the cumulative live birth rate [Citation23]. Therefore, it is of great importance to find a cost-effective and easy-to-measure biomarker to early identify MetS in women with PCOS, for the purposes of both the improvement of IVF outcome as well as the guidance for long-term management.
Insulin resistance is prevalent in women with PCOS, which is also critically associated with both metabolic and reproductive complications. Compared with the time-consuming and complicated hyperinsulinemic-euglycemic glucose clamp technique, deemed as the gold standard for the diagnosis of IR, HOMA-IR has been considered as a surrogate biomarker of IR. However, fasting insulin levels are not routinely measured in clinical practice, which might miss the best time to intervene with various metabolic risk factors [Citation24]. Although insulin resistance is not an essential component for the diagnosis of MetS, it actually plays a vital role in the pathophysiology of MetS [Citation25]. In recent years, TyG index, with the advantages of simplicity, convenience, low cost and accuracy, has been considered as a novel biomarker of IR, which is expected to be widely applied in primary hospitals to predict various diseases including diabetes mellitus, gastric malignancy, metabolism-related lung disease, cardiovascular events and fatty liver disease [Citation26–29]. A previous study has shown that TyG index might be a good indicator of insulin resistance in women with PCOS [Citation8], indicating a relationship between TyG index and metabolic disorders. In this study, we found that the TyG index in women with PCOS was significantly higher than in women without PCOS, which resulted in higher prevalence of MetS and other metabolic risk factors in women with PCOS. After mutual adjusting for confounding variables, we found that the TyG index was independently correlated with hypertension, obesity, central obesity, hyperglycemia and dyslipidemia in women with PCOS. Compared with the lowest tertile of TyG index (T1), the prevalence of hypertension, obesity, central obesity, hyperglycemia and dyslipidemia tends to be 3.1-, 12.5-, 3.9-, 7.5-, 2.5-fold higher in T3, respectively. While in women without PCOS, TyG index was only independently correlated with obesity and hyperglycemia, which might indicate that the TyG index was more applicable in women in PCOS. A recent study conducted in 227 general female women found that the AUC of TyG index for predicting MetS is 0.56, which was relatively low and was in line with the non-PCOS women in this study (AUC = 0.57) [Citation30]. Compared with the non-PCOS women in this study, the AUC of TyG index for predicting MetS in PCOS women was 0.88, which might indicate a predictive value of TyG index in the progression of MetS in those population. When the TyG index was higher than 8.65, women with PCOS were at a higher risk of MetS.
Several potential mechanisms contribute to the higher prevalence of MetS in women with PCOS with higher values of TyG index. First, women with PCOS are more predisposed to abnormal lipid metabolism [Citation31]. It has also been reported that there is a pleiotropic association between hepatic lipase variants rs1800588 and TyG index, which consequently leads to decreased HDL levels and elevated cholesterol level, thus promoting the development of metabolic abnormalities in women with PCOS [Citation32]. In addition, previous studies have revealed that hyperuricemia is one of the risk factors for MetS and insulin resistance is closely associated with hyperuricemia. Our previous findings have also indicated that the serum uric acid levels in women with PCOS were significantly higher than in non-PCOS women [Citation33]. Shi et al. found that each standard deviation increment of TyG index would result in a 12.53 μmol/L elevation of serum uric acid and a 54.1% additional risk for hyperuricemia, thus improving the predictive ability for MetS in subjects with various serum uric acid stratifications [Citation34].
To the best of our knowledge, this is the first study that comprehensively assessed the correlations between TyG index and MetS in both PCOS and non-PCOS women. A large number of infertile women with PCOS are prone to ignore the importance of long-term management after successfully giving birth to a child. In this study, the TyG index, used to emphasize the important role of insulin resistance in the occurrence of MetS in women with PCOS, provides a new way to indicate metabolic disorders in those population in the early stage. However, several limitations should be taken into consideration. First, due to the retrospective design, the dynamic changes in blood glucose and serum lipid in subjects included in this study were unable to be monitored. The blood glucose and serum lipid levels could be affected by dietary patterns and lifestyles, which might consequently lead to a change in the results. Second, it is difficult to exclude selection bias in this study as all the subjects included were infertile women seeking ART assistance in our reproductive center. Therefore, the association of MetS and TyG index in women who conceived naturally still remains to be elucidated. Thus, prospectively designed studies with multidisciplinary co-operations are suggested to strengthen our findings.
Conclusion
In summary, we found a positive and independent correlation between TyG index and the prevalence of MetS in women with PCOS. The best cutoff value of TyG index for detecting MetS was 8.65. Therefore, TyG index might present as a cost-effective, simple and informative screening method for MetS in women with PCOS.
Authors' contributions
Conception and design: C Liu and HY Yang; analysis and interpretation: C Liu and HY Yang; data collection: C Liu; writing of the manuscript: HY Yang; critical revision: C Liu; approval and accountability: all coauthors approve and agree to be accountable for the manuscript; statistical analysis: HY Yang and YF Chen; obtaining funding: HY Yang.
Disclosure statement
None of the authors have any potential conflicts of interest associated with this research. This work has not previously been published in any other form.
Data availability statement
Some or all datasets generated during and/or analyzed during current study are not publicly available but are available from the corresponding author on reasonable request
Additional information
Funding
References
- Lizneva D, Suturina L, Walker W, et al. Criteria, prevalence, and phenotypes of polycystic ovary syndrome. Fertil Steril. 2016;106:1–7.
- Cooney LG, Dokras A. Beyond fertility: polycystic ovary syndrome and long-term health. Fertil Steril. 2018;110(5):794–809.
- Paschou SA, Polyzos SA, Anagnostis P, et al. Nonalcoholic fatty liver disease in women with polycystic ovary syndrome. Endocrine. 2020;67(1):1–8.
- Anagnostis P, Tarlatzis BC, Kauffman RP. Polycystic Ovarian Syndrome (PCOS): long-term metabolic consequences. Metabol Clinic Exper. 2017:86:33–43.
- Yaribeygi H, Farrokhi FR, Butler AE, et al. Insulin resistance: review of the underlying molecular mechanisms. J Cell Physiol. 2019;234(6):8152–8161.
- Moghetti P, Tosi F. Insulin resistance and PCOS: chicken or egg? J Endocrinol Invest. 2021;44(2):233–244.
- Simental-Mendía LE, Rodríguez-Morán M, Guerrero-Romero F. The product of fasting glucose and triglycerides as surrogate for identifying insulin resistance in apparently healthy subjects. Metab Syndr Relat Disord. 2008;6(4):299–304.
- Kheirollahi A, Teimouri M, Karimi M, et al. Evaluation of lipid ratios and triglyceride-glucose index as risk markers of insulin resistance in Iranian polycystic ovary syndrome women. Lipids Health Dis. 2020;19:235.
- Li M, Li L, Qin Y, et al. Elevated TyG index predicts incidence of contrast-induced nephropathy: a retrospective cohort study in NSTE-ACS patients implanted with DESs. Front Endocrinol (Lausanne). 2022;13:817176.
- Huang R, Wang Z, Chen J, et al. Prognostic value of triglyceride glucose (TyG) index in patients with acute decompensated heart failure. Cardiovasc Diabetol. 2022;21(1):88.
- Steven S, Frenis K, Oelze M, et al. Vascular Inflammation and oxidative stress: major triggers for cardiovascular disease. Oxid Med Cell Longev. 2019;2019:7092151.
- The R E. Revised 2003 consensus on diagnostic criteria and long-term health risks related to polycystic ovary syndrome. Fertil Steril. 2004;81:19–25.
- Liu C, Ding L, Yang H, et al. Neck circumference is independently associated with metabolic syndrome in women with polycystic ovary syndrome. Endocrine J. 2022;69(7):809–818.
- Alberti KG, Zimmet P, Shaw J, The metabolic syndrome–a new worldwide definition. Lancet. 2005;366(9491):1059–1062.
- Alberti KG, Zimmet P, Shaw J. Metabolic syndrome–a new world-wide definition. A consensus statement from the international diabetes federation. Diabet Med. 2006;23(5):469–480.
- Flegal KM. Body-mass index and all-cause mortality. Lancet. 2017;389(10086):2284–2285.
- Cameron AJ, Magliano DJ, Shaw JE, et al. The influence of hip circumference on the relationship between abdominal obesity and mortality. Int J Epidemiol. 2012;41(2):484–494.
- Yang H, Liu C, Jin C, et al. Neck circumference is associated with hyperuricemia in women with polycystic ovary syndrome. Front Endocrinol. 2021;12:712855.
- Bahadur A, Mundhra R, Kashibhatla J, et al. Prevalence of metabolic syndrome among women with different PCOS phenotypes – a prospective study. Gynecol Endocrinol. 2021;37(1):21–25.
- Kar S. Anthropometric, clinical, and metabolic comparisons of the four Rotterdam PCOS phenotypes: a prospective study of PCOS women. J Hum Reprod Sci. 2013;6(3):194–200.
- Dokras A, Bochner M, Hollinrake E, et al. Screening women with polycystic ovary syndrome for metabolic syndrome. Obstet Gynecol. 2005;106(1):131–137.
- Lim SS, Kakoly NS, Tan JWJ, et al. Metabolic syndrome in polycystic ovary syndrome: a systematic review, meta-analysis and meta-regression. Obes Rev. 2019;20(2):339–352.
- He Y, Lu Y, Zhu Q, et al. Influence of metabolic syndrome on female fertility and in vitro fertilization outcomes in PCOS women. Am J Obstet Gynecol. 2019;221(2):138.e131–138.e112.
- Cai Y, Chen B, Zeng X, et al. The triglyceride glucose index is a risk factor for enlarged perivascular space. Front Neurol. 2022;13:782286.
- Gluvic Z, Zaric B, Resanovic I, et al. Link between metabolic syndrome and insulin resistance. Curr Vasc Pharmacol. 2017;15(1):30–39.
- Park B, Lee HS, Lee YJ. Triglyceride glucose (TyG) index as a predictor of incident type 2 diabetes among nonobese adults: a 12-year longitudinal study of the Korean genome and epidemiology study cohort. Transl Res. 2021;228:42–51.
- Wu TD, Fawzy A, Brigham E, et al. Association of triglyceride-glucose index and lung health: a population-based study. Chest. 2021;160:1026–1034.
- Yang K, Liu W. Triglyceride and glucose index and sex differences in relation to major adverse cardiovascular events in hypertensive patients without diabetes. Front Endocrinol (Lausanne). 2021;12:761397.
- Zhang S, Du T, Zhang J, et al. The triglyceride and glucose index (TyG) is an effective biomarker to identify nonalcoholic fatty liver disease. Lipids Health Dis. 2017;16(1):15.
- Zhang X, Zhang T, He S, et al. Association of metabolic syndrome with TyG index and TyG-related parameters in an urban Chinese population: a 15-year prospective study. Diabetol Metab Syndr. 2022;14:84.
- Diamanti-Kandarakis E, Papavassiliou AG, Kandarakis SA, et al. Pathophysiology and types of dyslipidemia in PCOS. Trends Endocrinol Metab. 2007;18(7):280–285.
- Teng MS, Wu S, Er LK, et al. LIPC variants as genetic determinants of adiposity status, visceral adiposity indicators, and triglyceride-glucose (TyG) index-related parameters mediated by serum triglyceride levels. Diabetol Metab Syndr. 2018;10:79.
- Yang H, Liu C, Jin C, et al. Neck circumference is associated with hyperuricemia in women with polycystic ovary syndrome. Front Endocrinol (Lausanne). 2021;12:712855.
- Shi W, Xing L, Jing L, et al. Usefulness of triglyceride-glucose index for estimating hyperuricemia risk: insights from a general population. Postgrad Med. 2019;131(5):348–356.