
Abstract
Introduction The purpose of this study was to determine the association between kisspeptin levels and obesity in patients with polycystic ovary syndrome (PCOS) or in healthy controls and to explore the correlation between levels of kisspeptin and various endocrine and metabolic indices in each group.
Methods From August 2020 to December 2021, the clinical data of 78 patients with polycystic ovary syndrome and 78 healthy individuals were collected. The two groups were further divided into obese and non-obese groups based on a BMI cutoff of 25. Serum kisspeptin levels were measured using enzyme linked immunosorbent assay (ELISA). Pearson’s correlation analysis was used to determine the correlation between PCOS and kisspeptin levels.
Results The weight, body mass index (BMI), and waist circumference (WC), estradiol (E2), and testosterone (T) of the obese PCOS group were significantly higher than those of the study group (p < .05). WC, kisspeptin, triglycerides (TG), glucose (GLU), alanine amiotransferase (ALT), blood urea nitrogen (BUN), uric acid (UA), E2, luteinizing hormone (LH), prolactin (PRL), and T in the non-obese PCOS group were higher than those in the control group, and the difference was statistically significant (p < .05). Levels of E2 and TG in the obese PCOS group were significantly higher than those in the non-obese PCOS group (p < .05). Kisspeptin levels in the PCOS group exhibited a significant positive correlation with LH, T, and AMH levels; kisspeptin level positively correlated with T in the non-obese PCOS group and with anti-Müllerian hormone (AMH) in the obese PCOS group.
Conclusion Serum kisspeptin levels are associated with hormone levels in patients with PCOS. Kisspeptin correlates with distinct biochemical indices in obese versus non-obese groups, indicating that kisspeptin may play a role in the prognostication, treatment, and clinical evaluation of patients with varying BMI.
Polycystic ovary syndrome (PCOS) is a common gynecological endocrine disorder in women of childbearing age, with a prevalence of 6–10% [Citation1,Citation2]. Its main features are high androgen levels, insulin resistance, and abnormal blood lipid levels, which often manifest as obesity, infertility, abnormal menstruation, etc. Long-term risks include diabetes, cardiovascular disease, and endometrial cancer [Citation3], which may significantly affect the physical and mental health of women. Genetic, environmental, and inflammatory factors play a role in the development of PCOS. Obesity is known to be closely related to PCOS and affects 6–12% of women of childbearing age [Citation4]. In addition, obese and overweight women of childbearing age are more prone to PCOS, with an incidence of 28.3% [Citation5], which is much higher than that in non-obese women.
Kisspeptin is a peptide encoded by the KISS-1 gene, which participates in the regulation of the hypothalamus-pituitary-gonadal (HPG) axis and is a natural ligand of G-protein coupled receptor 54 (GPR54) [Citation6]. In recent years, there has been increasing research interest in the role of kisspeptin in reproductive functions. Studies in animals and humans have shown that kisspeptin is an important switch of the reproductive system and a necessary factor in initiating puberty and maintaining reproductive function; therefore, it is a key regulatory factor of the HPG axis [Citation7]. Animal model studies have shown that kisspeptin can stimulate the HPG axis [Citation8], and a small dose of kisspeptin in the ventricle can significantly increase the secretion of LH and FSH [Citation9,Citation10], indicating that kisspeptin can regulate the secretion of hormones. To date, there is no clear consensus regarding PCOS status and the level of kisspeptin.
In this study, the PCOS and control groups were divided into obese and non-obese groups based on BMI ≥ 25 or < 25, respectively, to characterize inter-group differences in clinical indicators and kisspeptin levels. The correlation between kisspeptin and clinical indicators in the PCOS, control, obesity, and non-obesity groups were statistically analyzed to provide a reference for the pathogenesis, clinical diagnosis, and treatment of PCOS.
Materials and methods
Participants
From August 2020 to December 2021, 78 patients in Yunnan who were diagnosed with PCOS were selected as the research group, and 78 healthy women who visited our hospital during the study selection period were selected as the control group. Regarding the diagnosis of PCOS, we mainly adopted the Rotterdam diagnostic criteria recommended by the European Society of Human Reproduction and Embryology and American Reproductive Medicine in 2003 [16]. PCOS can be diagnosed if the patient has two of the following three items: ① rare ovulation or anovulation; ② clinical manifestations of hyperandrogenism, such as acne and hirsutism and/or hyperandrogenism; and ③ ultrasonographical evidence of polycystic ovarian changes. Other diseases causing hyperandrogenism were excluded. Healthy controls were all healthy people who had undergone gynecological ultrasound to exclude polycystic ovary and other gynecological tumors, and had undergone relevant hormone and blood tests to exclude other endocrine diseases (such as hyperandrogenism, hyperprolactinemia, and ovarian insufficiency). All participants signed an informed consent form. This study was approved by the Ethics Committee of the First People’s Hospital of Yunnan Province (ethics number: 2017YY182).
Patient medical history
The clinical manifestations, past medical history, and reproductive history of all participants were collected. We also collected information pertaining to menstruation, menarche, menstrual cycle, menstrual period, menstrual flow, and dysmenorrhea.
Laboratory examination
Levels of serum luteinizing hormone (LH), follicle-stimulating hormone (FSH), estradiol (E2), prolactin (PRL), total testosterone (T), progesterone (P), blood lipid, blood sugar, the LH/FSH value, and measures of liver and kidney function were collected on the third day of menstruation. The insulin resistance index (HOMA-IR) was calculated using the formula HOMA-IR = fasting blood glucose (MMO)/L × fasting insulin (MIU/mL)/22.5.
Kisspeptin quantification using ELISA
Venous blood was obtained from all participants at 8:00 am on day 3 of menstruation to ensure an accurate measurement of the level of reproductive hormones, which fluctuate with the number of days in the menstrual cycle. Blood was drawn with a common serum tube with a red cover, and it was left at room temperature for 2 h, with the longest time not exceeding 4 h. After centrifugation at 4 °C for 15 min with a centrifuge, 5 mL of serum was taken, subpackaged and stored at −80 °C until analysis. Kisspeptin levels were determined using an enzyme-linked immunosorbent assay (ELISA) kit (Fankewei Company).
Grouping by BMI
Based on BMI, all women in the study were divided into four groups: the obese PCOS group (BMI ≥ 25 kg/m2); the non-obese PCOS group (BMI < 25 kg/m2); the obese control group (BMI ≥ 25 kg/m2); and the non-obese control group (BMI < 25 kg/m2).
Statistical treatment
The measurement data were expressed as x, and comparisons between groups were made using the t-test. The data were expressed as rates or composition ratios, and the χ2 test was used. Pearson’s correlation analysis was used to analyze the relationship between serum kisspeptin levels and clinical indices. Statistical significance was set at p < .05.
Results
Comparison of baseline characteristics between groups
In this study, 78 PCOS patients were recruited as the study group, of which 40 were obese PCOS patients with BMI ≥ 25. The non-obese PCOS group consisted of 38 participants with a BMI of < 25 kg/m2. In the control group, 78 healthy individuals were recruited, of which 33 individuals were placed in the obesity control group, and 45 people in the non-obese control group. The mean age (standard deviation in years) in the obese PCOS group was 25.26 (5.70), that of the obese control group was 27.40 (5.22), that of the non-obese PCOS group was 24.52 (4.70), and that of the non-obese control group was 25.48 (4.39). There were no statistically significant differences among the four groups (p > .05). When comparing both the obese and non-obese PCOS groups with their healthy counterparts, we found no significant difference in BMI, height, weight, or waist circumference (p > .05) ().
Table 1. Comparison of baseline characteristics between the study group (obese and non-obese) and the control group (obese and non-obese).
Comparison of biochemical indices between the study group (obese and non-obese) and control group (obese and non-obese)
First, the levels of kisspeptin were compared. The mean (SD) concentration of kisspeptin was 2.66 (0.51) ng/mL in the obese PCOS group, which is significantly higher than the concentration of 2.26 (0.58) ng/mL seen in the obese control group (p = .038). The kisspeptin concentration in the non-obese PCOS group was 2.84 (0.52) ng/mL, which is significantly higher than the concentration of 2.52 (0.63) ng/mL seen in the control group (p = .014) (Data A, ). Compared with other biochemical indices, E2, T, and FSH were higher in the PCOS group than in the control group (p < .05) (Data B–D, ). LH, PRL, TG, GLU, AST, ALT, BUN, UA, FINS, and levels in the non-obese PCOS group were significantly higher than those in the non-obese control group (p < .05) (Data E and F; Data A–G, ) ().
Figure 1. (A) Comparison of kisspeptin level in obese PCOS, obese Controls, nonobese PCOS and nonobese Controls; (B) Comparison of E2 level in obese PCOS, obese Controls, nonobese PCOS and nonobese Controls; (C) Comparison of FSH level in obese PCOS, obese Controls, nonobese PCOS and nonobese Controls; (D) Comparison of T level in obese PCOS, obese Controls, nonobese PCOS and nonobese Controls; (E) Comparison of LH level between nonobese PCOS and nonobese Controls; (F) Comparison of PRL level between nonobese PCOS and nonobese Controls.
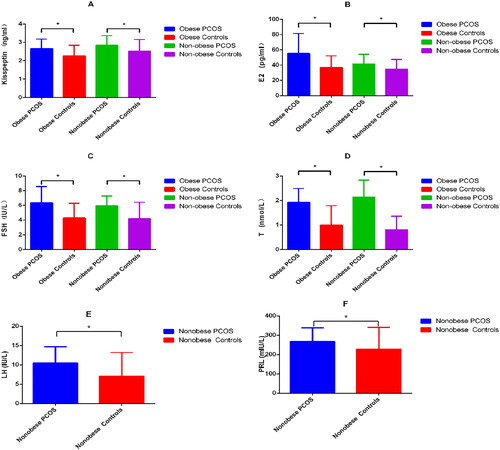
Figure 2. (A) Comparison of TG level between nonobese PCOS and nonobese Controls; (B) Comparison of GLU level between nonobese PCOS and nonobese Controls; (C) Comparison of AST level between nonobese PCOS and nonobese Controls; (D) Comparison of ALT level between nonobese PCOS and nonobese Controls; (E) Comparison of BUN level between nonobese PCOS and nonobese Controls; (F) Comparison of UA level between nonobese PCOS and nonobese Controls; (G) Comparison of FINS level between nonobese PCOS and nonobese Controls.
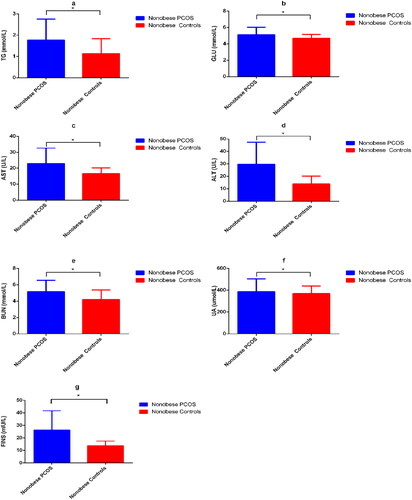
Table 2. Comparison of biochemical indices between the study group (obese and non-obese) and control group (obese and non-obese).
Comparison of biochemical indices between obese and non-obese PCOS patients
There were 40 cases in obese PCOS group, and 38 cases in nonobese PCOS group. Among various biochemical indices, only the level of E2 was significantly higher in the obese PCOS group than in the control group (p < .05) (, ).
Figure 3. Comparison of E2 level between obese PCOS and non-obese PCOS.
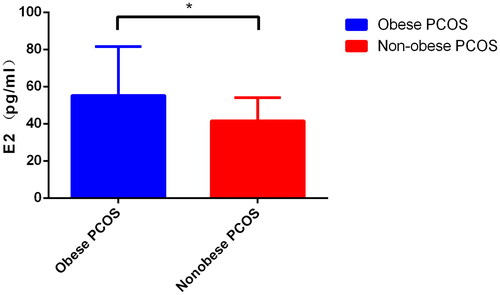
Table 3. Comparison of biochemical indexes between the obese PCOS group and the non-obese PCOS group.
Correlation analysis between kisspeptin and clinical indicators in the total PCOS group, obese PCOS group, and non-obese PCOS group
The kisspeptin level in the PCOS group was positively correlated with LH, T, and AMH (r = 0.382, 0.354, 0.422; p = .031, .047, .005) (Data A–F). The level of kisspeptin in the non-obese PCOS group was positively correlated with T and AMH (r = 0.378, 0.441, p = .039, .035) (Data 4), and that in the obese PCOS group was positively correlated with AMH (r = 0.476, p = .040) ().
Figure 4. (A) In the total PCOS group, kisspeptin levels positively correlated with AMH; (B) In the total PCOS group, kisspeptin levels positively correlated with LH; (C) In the total PCOS group, kisspeptin levels were positively correlated with T; (D) In the obese PCOS group, kisspeptin levels were positively correlated with AMH; (E) In the obese PCOS group, kisspeptin levels positively correlated with T; (F) In the non-obese PCOS group, kisspeptin levels positively correlated with AMH.
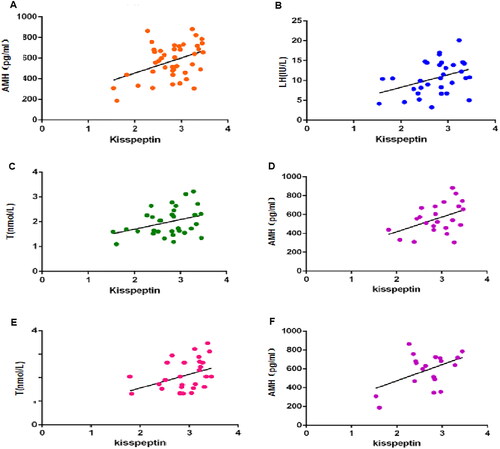
Table 4. Correlation analysis between kisspeptin and clinical indicators in the total PCOS group, obese PCOS group, and non-obese PCOS group.
Correlation analysis between kisspeptin and clinical indicators in the total controls group, obese controls group, and non-obese controls group
The kisspeptin level in the controls group was nopositively correlated with clinical indicators ().
Table 5. Correlation analysis between kisspeptin and clinical indicators in the total controls group, obese controls group, and non-obese controls group.
Discussion
This study aimed to evaluate the differences in clinical indices based on obesity status among patients with PCOS and healthy individuals to elucidate the impact of PCOS on patients with varying BMI. We controlled for age, height, weight, and BMI without obvious differences between study group and control group and compared the clinical indicators , when we compare the kisspeptin value, we find that the kisspeptin value of the study group is higher than that of the control group, whether the patient is obese or not. Moreover, there was no significant difference in kisspeptin levels between the obese PCOS and non-obese PCOS groups, indicating that kisspeptin is expressed in greater levels in PCOS patients versus healthy individuals, but that there is no significant correlation between the level of kisspeptin and obesity status. These results are consistent with those of multiple previous studies [Citation12–15], although one study has shown that kisspeptin expression is lower in the PCOS group compared to healthy control [Citation8]. Despite these differences, based on our findings and those in the existing literature, it appears that kisspeptin plays a regulatory role in PCOS; however, the specific mechanism requires further investigation. A correlation analysis between levels of kisspeptin and sex hormones in PCOS showed that kisspeptin is positively correlated with LH, T, and AMH in the total PCOS group, and kisspeptin is positively correlated with T in the non-obese PCOS group. As shown by foreign researchers, kisspeptin positively correlated with T [Citation12,Citation13], and Umit Gorkem and other researchers have shown that kisspeptin negatively correlates with FSH [Citation14]. Domestic studies have also shown that kisspeptin positively correlates with LH [Citation15]. Zarei et al. [Citation11] found that kisspeptin levels were significantly positively correlated with LH and E2 levels, whereas our results suggested that there was no significant correlation between kisspeptin and E2. This discrepancy may be explained by differences in race, lifestyle, geographical location, etc.
Through this study, it is found that the E2 level of PCOS patients is higher than that of the control group with the same weight level, and the E2 value of obese PCOS patients is also higher than that of non-obese PCOS patients, which indicates that the occurrence of PCOS is accompanied by the increase of E2 level, and obesity has a certain influence on the increase of E2. This may be due to a dysfunction of the HPG axis, inability to form dominant follicles, inability of the ovaries to ovulate, and excessive secretion of estrogen leading to increased estrogen expression. Therefore, the level of E2 in PCOS patients is higher than that in the control group. Studies have shown that estrogen receptor α can lead to obesity and metabolic dysfunction [Citation17], so obesity may also lead to increased secretion of E2. Notably, the increase in LH caused by ovulation failure was only observed when comparing non-obese PCOS versus the non-obese control group. Furthermore, there was no significant difference between obese patients and the obese control group, indicating that LH is more obvious in the comparison between non-obese patients and non-obese healthy people, and obesity may have some impact on the regulation of LH. The primary manifestation of PCOS is hyperandrogenism. The results of this study showed that the mean T-value was higher in patients with obesity than in the control group. Previous studies have shown [Citation18] that kisspeptin can increase PRL secretion by inhibiting estradiol-dependent nodular funnel dopamine (TIDA) neurons. The results of this study showed that the PRL of the non-obese PCOS group was significantly higher than that of the non-obese control group. However, in our results (), the PRL value of the obese PCOS group is also higher than that of the same weight control group, but the difference is not statistically significant, which means that the PRL of the PCOS group is higher, but the difference is more significant when non-obese PCOS patients are compared with the same weight control group.
Metabolic indices showed that the TG, GLU, and FINS values of the non-obese PCOS group were significantly higher than those of the non-obese control group, which may be related to the frequent occurrence of insulin resistance (IR) in PCOS patients. Studies show that PCOS is often accompanied by hyperlipidemia, hyperglycemia, and insulin resistance. Among those with PCOS, 75% of non-obese individuals and 95% of obese individuals have IR [Citation19]. IR is the main cause of abnormal glucose metabolism in PCOS patients, and the associated abnormal lipid metabolism frequently results in further increase in blood lipid levels. Clinical work also shows that thin patients with PCOS are often found to have increased visceral fat and decreased muscle content.
Some studies have found that [Citation20] metabolic syndrome and hyperandrogenism are the main risk factors for nonalcoholic fatty liver disease, and AST elevation does not appear until the late stage of liver injury. In the present study, we found that there was no significant difference in AST and ALT between the obese PCOS group and the obese control group, while the blood AST and ALT in the non-obese PCOS group were significantly higher than those in the control group, so the liver function damage of PCOS may be more obvious in the non-PCOS patients. However, there was no definite liver function abnormality in the subjects included in this study, only the increase of AST and ALT indexes. At the same time, we can conclude that the liver function of thin PCOS is more susceptible. Studies have shown that the ALT level of patients with non-alcoholic fatty liver complicated by PCOS is higher than that of patients with non-alcoholic fatty liver alone [Citation21]. Therefore, early monitoring of liver function is critical in patients with PCOS. Similarly, the values of Cr and UA in non-obese PCOS patients were higher than those in the non-obese control group, suggesting that PCOS patients have different degrees of renal impairment that hinder the excretion of creatinine and uric acid. Haiyan et al. [Citation22] examined diabetic patients and found that with an increase in BMI and abdominal visceral fat area (VFA), UA levels increased. Therefore, we suspect that the increase in uric acid levels seen in our study is related to obesity. There was no significant difference between obese patients and controls; it may be that some degree of impairment of renal function is related to obesity. PCOS can affect liver and kidney function, but obesity can also cause changes in liver and kidney function, which is in line with our results. The related indices in obese patients were not statistically significant.
AMH has been found to reduce the sensitivity of follicles to FSH, thus inhibiting follicle growth [Citation23]. AMH can regulate the production of sex hormones, and changes in sex hormone levels are related to the occurrence of puberty in both sexes [Citation24]. Past studies have shown that AMH levels in those with PCOS are three times higher than in healthy women [Citation25]. In the present study, the level of kisspeptin was positively correlated with AMH. We also found that kisspeptin levels positively correlated with AMH, irrespective of obesity. Since this study only studied non-pregnant women and pregnant women were not included in the study, we can explain that serum kisspeptin was positively correlated with AMH in non-pregnant women, and the correlation between kisspeptin and AMH in pregnant women needs further study. AMH has previously been shown to negatively correlate with BMI, waist circumference, and WHR [Citation26]. In contrast, there was no obvious correlation between kisspeptin and BMI in this study; however, the insufficient sample size in the present study may have influenced the experimental results, and further research is needed to understand the correlation between kisspeptin and BMI. Moreover, while we found that the level of kisspeptin was related to AMH, few researchers have studied this association or the mechanism underlying their interaction. The correlation between these factors will be the subject of our future research.
In conclusion, we found that kisspeptin levels were significantly increased in PCOS patients, regardless of obesity status. However, the level of kisspeptin in non-obese PCOS patients was higher than that in obese PCOS patients, and there was a significant difference in the metabolic indices between non-obese PCOS versus control groups; based on these results, non-obese patients are more likely to diagnose PCOS, which may be due to the influence of kisspeptin. Through correlation analysis, we found that there was no significant correlation between kisspeptin and metabolic indexes, hormone indexes and other indexes in the control group, while in the comparison of PCOS patients, it was found that kisspeptin in the total PCOS group was positively correlated with LH, T and AMH, and with AMH in the obese PCOS and non-obese PCOS groups. This further shows that when PCOS occurs, the change of kisspeptin level will affect the level of some hormones in the body, so kisspeptin is closely related to PCOS. AMH has been widely studied in the field of fertility and ovulation research, and has been used as an index to evaluate ovarian function. This is an area that we hope to further investigate in future studies. By exploring the mechanism by which kisspeptin affects the occurrence and development of PCOS, we hope to promote the prevention, diagnosis, and treatment of PCOS, and improve quality of life. The advantage of this study is that it comprehensively evaluates the differences of biochemical indexes and hormone levels between PCOS patients and healthy controls, and understands the impact of PCOS on the body. At the same time, it studies the differences of related indexes between PCOS patients and healthy controls under obesity and non-obesity, and understands the impact of obesity on PCOS patients and non-PCOS people. Most importantly, we studied the correlation between kisspeptin and obesity, non-obesity, PCOS and non-PCOS, and further clarified that kisspeptin is closely related to PCOS, especially non-obesity PCOS, which provided a new idea for the diagnosis and treatment of PCOS. However, the sample size of this study may not be enough, and due to various factors, the evaluation of insulin level is not enough, only the basic insulin level can be compared. The following research, when conditions permit, hopes to collect enough data to evaluate the insulin level, islet resistance index, and insulin sensitivity index measured by insulin release test, so as to further study the effect of kisspeptin on insulin level.
Ethics approval and consent to participate
This study was approved by the Ethical Research Committee at the First People’s Hospital of Yunnan Province (approval number: 2018FE117). Written informed consent was obtained from the participants and in the case of minors, informed consent was granted from their legally authorized representatives with the option to withdraw them from the study at any time.
| Abbreviations | ||
| ALT | = | Alanine aminotransferase |
| AMH | = | Anti-Müllerian hormone |
| AST | = | Aspartate transaminase |
| BMI | = | Body mass index |
| BUN | = | Blood urea nitrogen |
| CHOL | = | Total cholesterol |
| Cr | = | Creatinine |
| E2 | = | Estradiol |
| FINS | = | Fasting insulin |
| FSH | = | follicle stimulating hormone |
| HDL-C | = | High-density lipoprotein |
| HOMA-IR | = | Insulin resistance index |
| LDL-C | = | Low-density lipoprotein |
| LH | = | luteinizing hormone |
| P | = | Progesterone |
| PCOS | = | polycystic ovary syndrome |
| PRL | = | Prolactin |
| T | = | Testosterone |
| TG | = | Triglycerides |
| UA | = | Uric acid |
Disclosure statement
None of the authors have any potential conflicts of interest associated with this research.
Author disclosure statement: No competing financial interests exist.
Additional information
Funding
References
- Yingying Y, Junli Z. Epidemiological characteristics of polycystic ovary syndrome. Chin J Appl Gynecol Obstet. 2019;35(03):1–9.
- Wenming Z, Lingli N, Xiaojuan L. Investigation and analysis of risk factors of polycystic ovary syndrome among women of childbearing age. China Hosp Stat. 2016;23(3):186–189.
- Goodarzi MO, Dumesic DA, Chazenbalk G, et al. Polycystic ovary syndrome: etiology, pathogenesis and diagnosis. Nat Rev Endocrinol. 2011;7(4):219–231.
- Bozdag G, Mumusoglu S, Zengin D, et al. The prevalence and phenotypic features of polycystic ovary syndrome: a systematic review and meta-analysis. Hum Reprod. 2016;31(12):2841–2855.
- Liu Y, Chen Y. Fat mass and obesity associated gene polymorphism and the risk of polycystic ovary syndrome: a meta-analysis. Iran J Public Health. 2017;46(1):4–11.
- Muir AI, Chamberlain L, Elshourbagy NA, et al. AXOR12, a novel human G protein-coupled receptor, activated by the peptide KiSS-1. J Biol Chem. 2001;276(31):28969–28975.
- Trevisan CM, Montagna E, de Oliveira R, et al. Kisspeptin/GPR54 system: what do we know about its role in human reproduction? Cell Physiol Biochem. 2018;49(4):1259–1276.
- Haiyun G, Wei Z. Standardized diagnosis and treatment of polycystic ovary syndrome. Shanghai Med. 2019;40(21):3–6.
- Gottsch ML, Cunningham MJ, Smith JT, et al. A role for kisspeptins in the regulation of gonadotropin secretion in the mouse. Endocrinology. 2004;145(9):4073–4077.
- Navarro VM, Castellano JM, Fernández-Fernández R, et al. Characterization of the potent luteinizing hormone-releasing activity of KiSS-1 peptide, the natural ligand of GPR54. Endocrinology. 2005;146(1):156–163.
- Zarei E, Binabaj MM, Zadeh FM, et al. Kisspeptin levels in relation to sex hormone profile among PCOS patients. Irish J Med Sci. 2022;191(4):1711–1716.
- Jeon YE, Lee KE, Jung JA, et al. Kisspeptin, leptin, and retinol-binding protein 4 in women with polycystic ovary syndrome. Gynecol Obstet Invest. 2013;75(4):268–274.
- Ibrahim RO, Omer SH, Fattah CN. The correlation between hormonal disturbance in PCOS women and serum level of kisspeptin. Int J Endocrinol. 2020;2020:6237141.
- Gorkem U, Togrul C, Arslan E, et al. Is there a role for kisspeptin in pathogenesis ofpolycystic ovary syndrome? Gynecol Endocrinol. 2018;34(2):157–160.
- Wang T, Han S, Tian W, et al. Effects of kisspeptin on pathogenesis and energy metabolism in polycystic ovarian syndrome (PCOS). Gynecol Endocrinol. 2019;35(9):807–810.
- Broekmans FJ, Knauff EA, Valkenburg O, et al. PCOS according to the rotterdam consensus criteria: challenge in prevalence among WHO—II anovulation and association with metabolic factors. BJOG. 2006;113(10):1210–1217.
- Porter JW, Barnas JL, Welly R, et al. Age, sex, and depot-specific differences in adipose-tissue estrogen receptors in individuals with obesity. Obesity (Silver Spring). 2020;28(9):1698–1707.
- Ribeiro AB, Leite CM, Kalil B, et al. Kisspeptin regulates tuberoinfundibular dopaminergic neurones and prolactin secretion in an oestradiol-dependent manner in male and female rats. J Neuroendocrinol. 2015;27(2):88–99.
- Stepto NK, Cassar S, Joham AE, et al. Women with polycystic ovary syndrome have intrinsic insulin resistance on euglycaemic-hyperinsulaemic clamp. Hum Reprod. 2013;28(3):777–784.
- Won YB, Seo SK, Yun BH, et al. Non-alcoholic fatty liver disease in polycystic ovary syndrome women. Sci Rep. 2021;11(1):7085.
- Salva-Pastor N, Chávez-Tapia NC, Uribe M, et al. Understanding the association of polycystic ovary syndrome and non-alcoholic fatty liver disease. J Steroid Biochem Mol Biol. 2019;194:105445.
- Lei H, Lei T, Xiaoyong B, et al. Study on the distribution characteristics of abdominal fat in elderly patients with type 2 diabetes and its correlation with metabolic factors. Pract Geriatr. 2018;9:852–855.
- La Marca A, Broekmans FJ, Volpe A, et al. Anti-Mullerian hormone (AMH): what do we still need to know?. Hum Reprod. 2009;24(9):2264–2275.
- Edelsztein NY, Grinspon RP, Schteingart HF, et al. Anti-Mullerian hormone as a marker of steroid and gonadotropin action in the testis of children and adolescents with disorders of the gonadal axis. Int J Pediatr Endocrinol. 2016;2016:20.
- Pellatt L, Rice S, Mason HD. Anti-müllerian hormone and polycystic ovary syndrome: a Mountain too high? Reproduction. 2010;139(5):825–833.
- Huang Chunyue H, Lihui Y, Guang W, et al. Correlation analysis between anti-Miller’s hormone level and metabolic indexes of patients with polycystic ovary syndrome. World Trad Chin Med. 2021;16(14):2171–2176.