
Abstract
Objective
To investigate the effect of exenatide treatment on the composition of intestinal flora and metabolic pathways in patients with obesity with polycystic ovary syndrome.
Methods
Patients with obesity with polycystic ovary syndrome (PCOS) were distributed to two groups: one received exenatide combined with metformin (COM group, n = 14) and the other used metformin alone (MF group, n = 15). Fresh fecal specimens from the participants, including 29 patients with obesity with PCOS and 6 healthy controls, were collected for metagenomic sequencing. The effect of exenatide combination with metformin or metformin alone on the composition and function of intestinal flora in patients with obesity with PCOS were compared by bioinformatics analysis.
Results
The level of BMI, TT, HbA1c, and HDL-c was significantly improved in both groups. The MF and COM groups were abundant in Firmicutes, Bacteroidetes, Uroviricota, Actinobacteria, and Proteobacteria. Abundance of Bacteroidetes, Proteobacteria, Hungatella, and certain probiotics like Phocaeicola and Anaerobutyricum significantly increased in both groups after treatment. Enriched microbial species in the MF and COM group were different. Clostridium, Fusobacterium, and Oxalobacter were the main bacteria in the post-MF group, while Lactococcus_garvieae, Clostridium_perfringens, and Coprococcus_sp_AF16_5 were the main bacteria in the post-COM group. The post-COM group had more probiotic species including Bifidobacterium, Prevotella, and Anaerobutyricum after treatment.
Conclusion
Both exenatide combined with metformin and metformin monotherapy can improve metabolic and endocrine markers, and the diversity and abundance of gut microbiota in patients with obesity with PCOS. The effects of the combination and monotherapy agents on intestinal flora were consistent to some extent but also unique respectively.
Introduction
Polycystic ovary syndrome (PCOS) is the most common endocrine-metabolic disorder in premenopausal women, manifested as hyperandrogenism (HA), ovulatory dysfunction, and polycystic ovary, frequently associated with abdominal adiposity, insulin resistance (IR), metabolic disorders, and high cardiovascular risk [Citation1]. The prevalence of PCOS in reproductive-aged women ranges from 6% to 20% depending on different diagnosis criteria [Citation2]. Lifestyle management is mainly recommended. Except improving diet and exercise habits, the guidelines recommended that short-acting oral contraceptives (OCPs) should be the first choice to relieve hyper-androgen symptoms and metformin can be used for treatment of patients with PCOS with metabolic abnormalities [Citation3,Citation4]. Metformin can improve insulin sensitivity, reduce androgen levels and enhance ovulation [Citation5]. Although with great benefits, it is not particularly significant for weight reduction [Citation6]. The effects of some anti-diabetic drugs on weight loss and improving insulin resistance offer other possibilities for patients with PCOS. Exenatide is a glucagon-like peptide-1 (GLP-1) receptor agonist (GLP-1 RA), which can improve IR, and impaired glucose tolerance, and can also achieve weight loss by delaying gastric emptying and increasing safety [Citation7–10], therefore, it is likely to correct abnormal ovulation, reduce complications like obesity in patients with PCOS.
The gut microbiota is composed of more than 100 trillion species of microorganisms, which is the largest number and variety of symbiotic microorganisms in mammals [Citation11]. They play a pivotal role in human physiological functions, such as restricting other pathogen infection [Citation12], participating in metabolism [Citation13], oxidative phosphorylation [Citation14], and immunologic activity [Citation15]. Imbalances in the composition and function of the gut microbiota are related to various diseases including metabolic, neurologic, immunological, and cardiovascular diseases [Citation16,Citation17]. The gut microbiota has been identified as an important environmental component in energy balance and host immunity. An increasing body of research demonstrated that the gut bacteria affected host metabolism through interacting with adipose tissues. It not only promotes energy expenditure but also creates certain metabolites and structural components that may play an important role in the development of inflammation, IR, and obesity. As a therapeutic agent, exenatide may improve IR by inhibiting adipokines. Understanding the link between gut microbiota and adipose tissues could lead to new therapeutic options for treating obesity and related disorders [Citation18].
As an obesity-related disorder, people with PCOS had altered adipose tissue expression profiles [Citation19]. These altered expression profiles led adipocytes to produce an imbalanced amount of adipokines, which had a negative impact on the endocrine and reproductive systems [Citation19,Citation20]. Besides, gut microbiota dysbiosis can cause IR, chronic inflammation, androgens excess, and metabolic disorder, involving in follicular dysplasia and the genesis of PCOS thereby [Citation1,Citation21–25]. So based on the aforementioned studies, studies that question the relationship between adipose tissue and intestinal microbiota in PCOS are promising.
Animal studies have shown that the weight loss effect of GLP-1 RA is related to the regulation of intestinal flora composition [Citation26]. We conducted a randomized controlled trial to investigate the effect of exenatide and/or metformin in the changes in the composition and function of the gut microbiota in women with PCOS with obesity through metagenomic analysis.
Materials and methods
Study Participants and design
The 29 patients with PCOS in this study were a subset of patients from a randomized single-center controlled trial (ClinicalTrials.gov, NCT04029272) conducted from July 2019 to December 2020 in the Department of Obstetrics and Gynecology, Peking Union Medical College Hospital. This study was approved by the Ethics Committee of Peking Union Medical College Hospital, and all subjects signed the informed consent form. This clinical trial has also been registered on the clinical trial (registration number: NCT04029272).
Inclusion criteria were stated as follows: (1) PCOS females aged 18–40 fulfilled the Rotterdam criteria [Citation27]; (2) overweight or obese (body mass index ≥ 25 kg/m2); (3) No fertility plans within 6 months
Exclusion criteria were stated as follows: Anyone who meets any of the following conditions cannot participate in the study. (1) Combined with other endocrine diseases, such as diabetes, adrenal hyperplasia or tumor, Cushing’s syndrome, clinical thyroid disease, acromegaly, hyperprolactinemia, androgen-secreting tumor, etc.; (2) Medullary thyroid disease patients with personal or family history of cancer (MTC) or patients with multiple endocrine neoplasia type 2 (MEN2); (3) combined with severe or unstable diseases, including liver, kidney, cardiovascular, respiratory, neurological, and blood system dysfunction; (4) with a history of thromboembolic disease or thrombosis; (5) heavy smoking or alcoholism women; (6) lactating or pregnant women; (7) women with a history of other malignant tumors; (8) Use of statins or other drugs known or suspected to affect reproductive or metabolic function within the past 3 months; (9) Drug allergy; (10) Participating in other clinical trials.
According to the method of random number table, the patients were randomly divided into two treatment groups according to the ratio of 1:1. The patients in the COM group (14 cases) were given metformin (China-US Shanghai Squibb, SFDA Approval No. H20023371) 500 mg orally, three times a day, combined with exenatide (AstraZeneca, USA, SFDA Approval No. H20170389) 2 mg subcutaneously, once a week; the patients in the MF group (15 cases) were given the same metformin 500 mg Ter in die. All patients and healthy controls did not use antibiotics within 1 month before collecting stool samples, and did not drink yogurt within the first 7 days.
Age-matched healthy controls whose BMI < 18–23 kg/m2 were recruited from volunteers of Peking Union Medical College Hospital. They did not meet the Rotterdam criteria for PCOS and any of the exclusion criteria.
Laboratory measurements
Both groups of patients were measured waist circumference and body weight before and after 12 weeks of treatment, and calculated body mass index (BMI). A standard 75 g oral glucose tolerance test (OGTT) was performed in the morning after overnight fasting for 12 h, and blood glucose and insulin levels were measured at 0, 30, 60, 120 min, respectively. Fasting blood samples were collected from the patients at baseline and 3 months after treatment. The levels of sex hormones were collected during the 2nd and 3rd days of the menstrual cycle from women who showed regular menstruation or on any day for amenorrheic patients. Fasting blood samples were also used to measure the level of glycated hemoglobin (HbA1c), and blood lipids during the menstrual period. Patients can record adverse reaction events in the patient diary.
DNA extraction, library construction, and metagenomic sequencing
Total genomic DNA was extracted from fecal samples using the E.Z.N.A.® Soil DNA Kit (Omega Bio-tek, Norcross, GA, USA) according to manufacturer’s instructions. Concentration and purity of extracted DNA was determined with TBS-380 and DNA extract quality was checked on 1% agarose gel by NanoDrop2000. DNA extract was fragmented to an average size of about 400 bp using Covaris M220 (Gene Company Limited, China) for paired-end library construction, which was constructed using NEXTFLEX Rapid DNA-Seq (Bioo Scientific, Austin, TX, USA). Adapters containing the full complement of sequencing primer hybridization sites were ligated to the blunt-end of fragments. Paired-end sequencing was performed on Illumina NovaSeq (Illumina Inc., San Diego, CA, USA) at Majorbio Bio-Pharm Technology Co., Ltd. (Shanghai, China) using NovaSeq Reagent Kits according to the manufacturer’s instructions (www.illumina.com).
Gene prediction
Open reading frames (ORFs) from each assembled contig were predicted using MetaGene (http://metagene.cb.k.u-tokyo.ac.jp/). The predicted ORFs with length being or over 100 bp were retrieved and translated into amino acid sequences using the NCBI translation table (http://www.ncbi.nlm.nih.gov/Taxonomy/taxonomyhome.html/index.cgi?chapter=tgencodes#SG1).
Non-redundant gene catalog conduction
A non-redundant gene catalog was constructed using CD-HIT (http://www.bioinformatics.org/cd-hit/, version 4.6.1) with 90% sequence identity and 90% coverage. Reads after quality control were mapped to the non-redundant gene catalog with 95% identity using SOAPaligner (http://soap.genomics.org.cn/, version 2.21), and gene abundance in each sample were evaluated.
Functional annotation
Representative sequences of non-redundant gene catalog were aligned to NCBI NR (Non-Redundant Protein Sequence Database) database with e-value cutoff of 1 e–5 using Diamond (http://www.diamondsearch.org/index.php, version 0.8.35) for taxonomic annotations. The abundance of the germs was calculated using the sum of the gene abundances corresponding to the germs, and visualized through column charts in Phylum, Genus, and Species.
The KEGG annotation
The KEGG annotation was conducted using Diamond against the Kyoto Encyclopedia of Genes and Genomes database (http://www.genome.jp/keeg/) with an e-value cutoff of 1 e−5, aligning the non-redundant gene set sequences with KEGG’s gene database (GENES), and calculating the abundance of this functional category according to the sum of the gene abundances corresponding to the Pathway.
Statistical analyses
SPSS 25.0 software was used for statistical analysis of differences in serological and clinical indicators between the two groups. All data were tested for normality using Shapiro Wilk test together. Continuous variables with normal distribution and homogeneous variance were expressed as x ± s, and the independent sample t test was used for comparison between two groups, and the paired sample t test was used for intra-group comparison. p < .05 indicated statistical significance. Mann–Whitney U test was used to compare between two groups and within groups for continuous variables that did not meet the normal distribution or heterogeneity of variance, and p < .05 indicated statistical significance.
All sequenced data were analyzed in R language, and principal co-ordinate analysis (PCoA) was used to analyze the size of differences between groups in species composition and microbiota function. All statistical results were considered statistically significant at p < .05. The linear discriminant analysis effect size (LEfSe) analysis of the marker strains between groups was performed, and the nonparametric factor Kruskal–Wallis rank sum test was used to screen out the biomarker strains (p < .05), and then linear discriminant analysis (LDA) was used to evaluate the influence of different species on the biomarker strains (i.e. LDA score), and the strains with LDA > 2.0 were selected as the strains with statistically significant differences.
Results
Clinical, hormone, and metabolic variables of participants
Our results showed that BMI of the two groups decreased significantly after treatment (pCOM = .001, pMF = .007). In terms of hormone levels, androgen levels in the two groups were significantly decreased after 12 weeks of treatment without significant difference between groups (pCOM = .005, pMF = .008), and only the MF group had lower LH/FSH after treatment (p = .0047). We further assessed the effectiveness of different drug intervention on glucose and lipid metabolism. The glycosylated hemoglobin showed a marked downward trend in both groups (pCOM = .011, pMF = .038), and high-density lipoprotein (HDL) were also significantly increased in both groups after treatment (pCOM = .043, pMF < .01). Only the MF group had higher level of Lipoprotein A1 (ApoA1) after 12 weeks of management (pMF < .01). In addition, the level of HDL and ApoA1 improved better in the MF group compared to those in the COM group (p = .014 and .012 respectively). Surprisingly, the 2h-OGTT of the MF group after treatment showed an apparent upward-trend (p = .007) ().
Table 1. BMI, hormone, and metabolic parameters between the COM and MF group.
Microbial composition and diversity
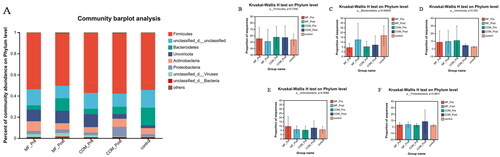
To find out the taxonomic changes of gut microbiota in the subjects with different drug intervention, we compared the composition and abundance of samples at the phylum, genus, and species levels respectively. At the phylum level, the three groups of flora are mainly composed of Firmicutes, Bacteroidetes, Uroviricota, Actinobacteria, and Proteobacteria ().
Figure 1. Relative abundance of microbes at the phylum level: (A) community Bar plot analysis of the patients with obesity with PCOS at the baseline and after treatment compared with the healthy subjects; (B) The percentage of Firmicutes in each group (p = .736); (C) The percentage of Bacteroidetes in each group (p = .069); (D) The percentage of Uroviricota in each group (p = .332); (E) The percentage of Actinobacteria in each group (p = .909); (F) The percentage of Proteobacteria in each group (p = .993).
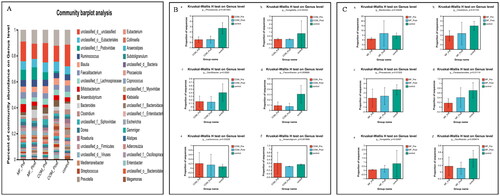
At the genus level, Phocaeicola and Hungatella were significantly increased after treatment in the COM group, whereas Oscillospira, Flavonifractor, Lactococcus, and Anaerotignum were significantly lower than baseline (). Although the levels of Bacteroides, Clostridium, Phocaeicola of Bacteroidetes, Parabacteroides, and Hungatella in the MF group at the baseline were lower than those in the control group, most of these were significantly improved after treatment, except Oscillospira, which was decreased compared to before treatment (). We also observed that probiotics like Anaerobutyricum were increased after treatment in both groups, however, more probiotics such as Bifidobacterium, Prevotella, Coprococcus increased only in the post-COM treatment. Clostridium was lower than the control group before treatment, but decreased after treatment ().
Figure 2. Relative abundance of microbes at the genus level: (A) community Bar plot analysis of the patients with obesity with PCOS at the baseline and after treatment compared with the healthy subjects; (B) Difference test bar charts of the top six species in abundance in the COM group: (a): The percentage of Phocaeicola in each group (p = .0016). (b): The percentage of Hungatella in each group (p = .043). (c): The percentage of Oscillospira in each group (p = .028). (d): The percentage of Flavonifractor in each group (p = .0057). (e): The percentage of Lactococcus in each group (p = .032). (f): The percentage of Anaerotignum in each group (p = .0019); (C) Difference test bar charts of the top six species in abundance in the MF group: (a): The percentage of Bacteroides in each group (p = .034). (b): The percentage of Clostridium in each group (p = .017). (c): The percentage of Phocaeicola in each group (p = .012). (d): The percentage of Parabacteroides in each group (p = .011). (e): The percentage of Hungatella in each group (p = .025). (f): The percentage of Oscillospira in each group (p = .0095).
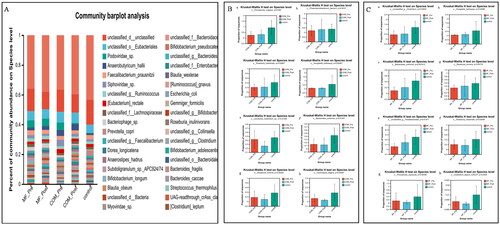
At the species level, Bacteroidales, Phocaeicola_vulgatus, Phascolarctobacterium, Roseburia_intestinalis, Hungatella hathewayi were enriched while certain Clostridium, Bacteroides_uniformis, Roseburia_hominis, and Lachnospira_eligens decreased in the post-COM group. In addition, certain Clostridium, Hungatella_hathewayi, Bacteroides_uniformis, Roseburia_hominis, Parabacteroides were also elevated whereas Roseburia_intestinalis, Phocaeicola_coprocola, Clostridium_leptum, Coprococcus_eutactus were decreased in the post-MF ().
Figure 3. Relative abundance of microbes at the species level: (A) community Bar plot analysis of the patients with obesity with PCOS at the baseline and after treatment compared with the healthy subjects; (B) Difference test bar charts of the top eight species in abundance in the COM group: (a): The percentage of Phocaeicola_vulgatus in each group (p = .036). (b): The percentage of Phascolarctobacterium in each group (p = .042). (c): The percentage of Roseburia_intestinalis in each group (p = .030). (d): The percentage of Hungatella hatheway in each group (p = .045). (e): The percentage of uncultured_Clostridium_sp. in each group (p = .014). (f): The percentage of Bacteroides_uniformis in each group (p = .013). (g): The percentage of Roseburia_hominis in each group (p = .044). (h): The percentage of Lachnospira_eligens in each group (p = .031); (C) Difference test bar charts of the top eight species in abundance in the MF group: (a): The percentage of unclassified_g_Clostridium in each group (p = .030). (b): The percentage of Hungatella_hathewayi in each group (p = .035). (c): The percentage of Bacteroides_uniformis in each group (p = .007). (d): The percentage of Roseburia_hominis in each group (p = .038). (e): The percentage of Parabacteroides in each group (p = .015). (f): The percentage of Roseburia_intestinalis in each group (p = .035). (g): The percentage of Phocaeicola_coprocola _uniformis in each group (p = .025). (h): The percentage of Clostridium_leptum in each group (p = .043).
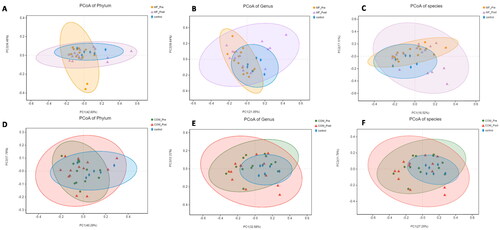
Next, we performed PCoA to assess the difference in the composition of intestinal flora among groups based on the gene sequences and species annotation at the phylum, genus, and species level. Each group formed a cluster and the clusters of the post-treatment MF and COM groups were closer to those of the control group compared to baseline, suggesting that exenatide combined with metformin or metformin monotherapy had a significant and diverse effect on the intestinal flora composition of women with obesity with PCOS ().
Figure 4. Principal-component-analysis (PCoA) score plots for participants with obesity with PCOS and healthy people. A: PCoA score plots at the phylum level before and after 12-week intervention in the MF and control group; B: PCoA score plots at the genus level before and after 12-week intervention in the MF and control group; C: PCoA score plots at the species level before and after 12-week intervention in the MF and control group; D: PCoA score plots at the phylum level before and after 12-week intervention in the COM and control group; E: PCoA score plots at the genus level before and after 12-week intervention in the COM and control group; F: PCoA score plots at the species level before and after 12-week intervention in the MF and control group.
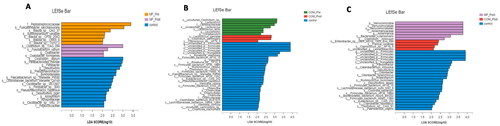
We also used LEfSe to screen for the key gut microbiotas in the patients with obesity with PCOS before and after treatment and control group. From the phylum-to-species level, the MF group had a greater abundance of Peptostreptococcaceae, Fusicatenibacter_saccharivorans, and Blautia at baseline, while Clostridium, Fusobacterium, and Oxalobacter were the main intestinal microbiotas after treated with metformin only. The COM group was enriched in Clostridium, Lactococcus, Lactobacillaceae, and Longibaculum at the baseline, whereas Lactococcus_garvieae, Clostridium_perfringens, and Coprococcus_sp_AF16_5 were superior after 12-week intervention. Besides, Clostridium_innocuum and Coprococcus_sp_AF16_5 was enriched in the post-treatment MF and COM group, respectively ().
Figure 5. Linear discriminant analysis (LDA) effect size in groups. The X-axis represents LDA score (Log10) and the Y-axis represents significantly different fecal bacterial species (LDA score > 2). The LDA discriminant histogram counts the microbial groups that have a significant effect in three groups. The larger the LDA score, the greater the effect of species abundance on the difference. (A) Histogram of the LDA scores computed for differentially abundant species between the control and MF group at baseline and week 12. (B) Histogram of the LDA scores computed for differentially abundant species between the control and COM group at baseline and week 12. (C) Histogram of the LDA scores computed for differentially abundant species between the control, MF, and COM group at week 12.
KEGG pathways differed between the groups
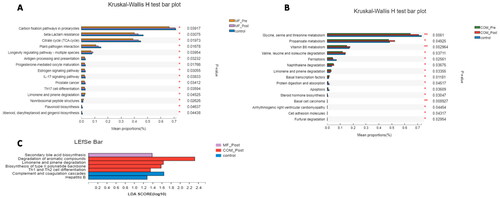
We compared the tertiary metabolic pathways of samples and found that the main metabolic pathways in the COM group including amino acid metabolism, such as glycine, serine and threonine, Valine, leucine and isoleucine metabolism, vitamin B6 metabolism, propionate metabolism, steroid hormone biosynthesis, and Limonene and pinene degradation. The MF group was particularly improved in citrate pyruvate cycle, inflammatory response processes like antigen processing and presentation, IL-17 signaling pathway, oocyte maturation, estrogen signaling pathway, and flavonoids biosynthesis ().
Figure 6. Kruskal–Wallis H test bar plot and linear discriminant analysis (LDA) effect size (LEfSe) of KEGG pathways in groups. (A) Kruskal–Wallis H test bar plot of metabolic pathways between the control and MF groups at baseline and week 12. (B) Kruskal–Wallis H test bar plot of NR between the control and COM groups at baseline and week 12. (C) LEfSe analysis of metabolic pathways between the control, MF and the COM groups at week 12.
Discussion
PCOS is a common endocrine and metabolic disorder that afflicts adolescent, child-bearing and perimenopausal women, often accompanied by obesity, insulin resistance, and altered pancreatic beta cell function [Citation3]. Lifestyle adjustment is the first-line treatment for patients with obesity with PCOS, and patients with metabolic disorders are often treated with drugs simultaneously. Glucagon-like peptide-1 (GLP-1) receptor agonist is an analogue of incretin. Previous studies have shown that GLP-1 receptor agonist combined with metformin is superior to GLP-1 receptor agonist combined with metformin alone in improving insulin sensitivity and reducing body weight [Citation28], hormonal and metabolic disturbances [Citation4,Citation29], remission rates for prediabetes [Citation30], especially in women with obesity/overweight or infertility [Citation4]. However, short-acting exenatide requires twice daily subcutaneous injection and long-acting liraglutide requires once daily subcutaneous injection, which is not convenient to use. In this study, we used long-acting injectable exenatide microspheres, a new once-a-week formulation that is more convenient to use. We conducted a randomized clinical trial to evaluate the effects of exenatide microspheres combined with metformin on body weight, metabolic and endocrine markers, and intestinal flora in women with obesity with PCOS for the first time, and explain the potential mechanism of combination therapy and monotherapy in improving PCOS with obesity.
In this study, significant improvements in BMI, TT, HbA1c, and HDL-c were observed in the MF and COM groups, although no statistical significance were observed in other metabolic and endocrine indicators, there was still an advanced trend. The comparison between the two groups did not differ significantly as reported in previous studies, which may due to the small sample size.
The gut microbiota is the largest number and variety of symbiotic microorganisms in mammals [Citation31]. The intricate interactions between these microorganisms and themselves with the body make the gut one of the important places to maintain the body’s physiological functions [Citation32,Citation33]. Lots of previous studies have confirmed that certain changes in gut microbiota interact with the occurrence and progression of PCOS [Citation1,Citation21–25], and PCOS can further aggravate microbial imbalance or dysbiosis [Citation34].Opportunistic pathogenic flora like Catenibacterium, Kandleria, Clostridium, Oscillibacter, Subdoligranulum, Streptococcus, Lactococcus, Finegoldia, Megamonas and Escherichia/Shigella, Lactobacillus were enriched in patients with PCOS, while microbiota playing key roles in maintaining health like Bifidobacterium, Blautia, prausnitzii Faecalibacterium, Ruminococcus, Akkermansia, Lachnospira, Alistipes obviously decreased [Citation35–37]. There was no consensus on the changes of some bacterial abundance in patients with PCOS, including Coprococcus, Bacteroides, Prevotella, Parabacteroides and so on.
Jobira et al. [Citation38] had reported that patients with obesity with PCOS had higher Actinobacteria, lower Bacteroidetes, and similar Firmicutes and Proteobacteria. In our study, we also found that Firmicutes, Bacteroidetes, Uroviricota, Actinobacteria, and Proteobacteria were the dominant phyla in all three groups. Among them, Firmicutes decreased in the MF and COM groups after 12-week treatment, and Bacteroidetes and Proteobacteria increased inversely. However, we found out that the changes of Uroviricota and Actinobacteria were opposite in the MF and COM groups, suggesting that the effects of the combination and monotherapy agent group on intestinal flora were consistent to some extent but also unique, respectively. Binda et al. [Citation39] suggested that actinomycetes, especially Bifidobacteria, play a pivotal role on decomposing various organic substances, widely used as probiotics. Little did scientists know about Uroviricota in the human gut, but it suggested that Uroviricota could affect the body’s metabolism or immune system [Citation40]. Our study revealed that the COM group probably stabilized the balance and function of human gut flora better by increasing Actinobacteria and reducing Uroviricota. Beneficial bacterial genera, such as Phocaeicola and Anaerobutyricum, increased after treatment in both groups. Anaerobutyricum can improve insulin sensitivity [Citation41], and Phocaeicola can help host to utilize complex nutrients, thereby alleviating disease [Citation42], inhibiting the colonization of pathogenic bacteria [Citation43], and enhancing immunity [Citation44]. In addition, the MF and COM groups had diverse enriched probiotics respectively. Our study showed that Parabacteroides enriched in the post MF group, which was significantly negatively correlated with obesity, nonalcoholic fatty liver, diabetes and other disease states [Citation45], suggesting that metformin could play a positive regulatory role in glucose and lipid metabolism by increasing Parabacteroides. The abundant probiotics in COM group after treatment included Bifidobacterium, Prevotella, and Anaerobutyricum, having beneficial effects on sex hormones and metabolic parameters [Citation46].
To further investigate the meaningful different microbial changes between the COM and MF groups, we used the LDA effect size (LEfSe) method. In our study, Verrucomicrobiales, Akkermansia, Bacteroides_xylanisolvens, Clostridium innocuum were greater dominant in the MF group. Huang et al. [Citation47] has reported that metformin could increase intestinal Akkermansia abundance, reduce serum IFN-γ levels, and inhibit macrophage apoptosis in the ovary. Apoptosis of macrophage can disrupt the production of estrogen and promote granulosa cell apoptosis. Therefore, inhibition of macrophage apoptosis can improve the clinical phenotype of PCOS. On the other hand, Akkermansia plays a role in the prevention and treatment of obesity, type 2 diabetes, and other metabolic dysfunctions [Citation48], which is of great benefit to alleviate metabolic disorders in patients with obesity with PCOS. Bacteroidetes are widely recognized as beneficial intestinal flora due to alleviating inflammation by modulating lymphocyte and cytokine expression, controlling metabolism and preventing cancer. Bacteroides_xylanisolvens is the first food-added ingredient approved by the European Commission [Citation49]. There is currently no consensus on the association of Clostridium innocuum with intestinal function. Ha et al. [Citation50] have pointed out that it may play a protective role in the intestine, while Cherny et al. [Citation51] has found that Clostridium innocuum is an emerging gastrointestinal opportunistic pathogen that causes antibiotic-associated diarrhea.
The dominant flora in the post-COM group were Enterobacter, Coprococcus_sp__AF16_5, and Levilactobacillus. Coprococcus faecalis is an important member of the Firmicutes Lachnospiraceae, which can not only inhibit the activation of the NF-κB signaling pathway in stressed enterocytes, reduce the immune response [Citation52], but also generate short-chain fatty acids (SCFA) [Citation53]. SCFAs involve in gluconeogenesis, cholesterol metabolism, and lipogenesis [Citation54], couple to G proteins on enteroendocrine cells as ligands in order to stimulate the secretion of brain-gut peptides like glucagon-like peptide-1 (GLP-1) and YY peptide, resultantly reduce IR [Citation35]. Levilactobacillus belongs to Lactobacillus brevis, which is a gram-positive bacilli with antipathogenic [Citation55], antioxidant, immunomodulatory [Citation56], anticancer [Citation57], and antifungal features [Citation58].
What’s more, the changes of gut microbiota abundance in patients with obesity with PCOS treated with combination therapy and monotherapy also changed the biological function and metabolic pathway of intestinal flora. We observed that the MF group may improve the PCOS phenotype by affecting citrate pyruvate cycle, inflammatory response processes, IL-17 signaling pathway, oocyte maturation, estrogen signaling pathway, and flavonoids biosynthesis, whereas the COM group mainly improve amino acid metabolism, vitamin B6 metabolism, propionate metabolism, steroid hormone biosynthesis, and Limonene and pinene degradation. Besides, our study inferred that the gene expression levels of degradation of aromatic compounds, limonene and pinene degradation, Th1 and Th2 cell differentiation in the COM group were significant superior to those in the MF group. Gut microbiota is associated with xenobiotics, which may disrupt gut microbiota functions and aggravate the pro-inflammatory state in the gut [Citation59], suggesting that exenatide combined with metformin could enhance anti-inflammatory and immunoregulatory effect better than metformin agent in patients with obesity with PCOS, indirectly alleviating metabolic disorders related to inflammation [Citation60]. However, the conclusion in this regard need to be further verified.
Conclusion
Our study shows that both exenatide combined with metformin therapy and metformin monotherapy can improve metabolic and endocrine markers, and the diversity and abundance of gut microbiota in patients with obesity with PCOS. The effects of the combination and monotherapy agent groups on intestinal flora were consistent to some extent but also unique respectively. Both groups were abundant in Firmicutes, Bacteroidetes, Uroviricota, Actinobacteria, and Proteobacteria. Certain probiotics like Phocaeicola and Anaerobutyricum were enhanced in each group after treatment. However, Clostridium, Fusobacterium, and Oxalobacter were the main bacteria in the post-MF group while Lactococcus_garvieae, Clostridium_perfringens, and Coprococcus_sp_AF16_5 were the main bacteria in the post-COM group. What’s more, the post-COM group had more probiotic species including Bifidobacterium, Prevotella, and Anaerobutyricum. In addition, different bacterial flora and changes in abundance may affect the phenotype of patients with obesity with PCOS through different metabolic pathways. Exenatide combined with metformin may resist inflammation and improve immunity more effectively than metformin monotherapy in patients with obesity with PCOS.
Author contributions
Jingwen Gan, Jie Chen, and Ai-jun Sun conceptualized the research topic. Yan Deng, Xue-song Ding, and Shi-yang Zhu provided valuable comments and suggestions and played a critical role in the distribution, completion, and collection of data. Jingwen Gan, Jie Chen, Rui-lin Ma, Yan Deng, Xue-song Ding, Shi-yang Zhu, and Ai-jun Sun analyzed and interpreted the data. Jingwen Gan, Jie Chen, Rui-lin Ma, Yan Deng, and Ai-jun Sun guided the statistical analysis. Jingwen Gan was a major contributor in writing the manuscript. Ai-jun Sun were responsible for revision. All authors read and approved the final manuscript.
Ethics approval and consent to participate
The study was approved by the Ethics Committee of Peking Union Medical College Hospital, Chinese Academy of Medical Sciences (No. S-K1373). all subjects gave informed consent and signed the informed consent form. This clinical trial has also been registered on the clinical trial (registration number: NCT04029272).
Consent for publication
Not applicable.
Acknowledgements
The authors would like to thank all Chinese obstetricians and gynecologists who participated in the survey for sharing their valuable views. We also thank China Maternal and Child Health Association for supporting our survey. We thank Editage (www.editage.cn) for English language editing.
Availability of data and materials
The datasets used and/or analyzed during the current study are available from the corresponding author on reasonable request.
Disclosure statement
The authors declare that they have no competing interests.
Additional information
Funding
References
- Giampaolino P, Foreste V, Di Filippo C, et al. Microbiome and PCOS: state-of-Art and future aspects. Int J Mol Sci. 2021;22(4):1.
- Escobar-Morreale H. Polycystic ovary syndrome: definition, aetiology, diagnosis and treatment. Nat Rev Endocrinol. 2018;14(5):270–9.
- Hoeger KM, Dokras A, Piltonen T. Update on PCOS: consequences, challenges, and guiding treatment. J Clin Endocrinol Metab. 2021;106(3):e1071–e1083.
- Siamashvili M, Davis S. Update on the effects of GLP-1 receptor agonists for the treatment of polycystic ovary syndrome. Expert Rev Clin Pharmacol. 2021;14(9):1081–1089.
- Morley LC, Tang T, Yasmin E, et al. Insulin-sensitising drugs (metformin, rosiglitazone, pioglitazone, D-chiro-inositol) for women with polycystic ovary syndrome, oligo amenorrhoea and subfertility. Cochrane Database Syst Rev. 2017;11(11):CD003053.
- Practice committee of the American society for reproductive medicine. Electronic address: [email protected]; practice committee of the American society for reproductive medicine . Role of metformin for ovulation induction in infertile patients with polycystic ovary syndrome (PCOS): a guideline. Fertil Steril. 2017;108(3):426–441.
- Garg S. The role of basal insulin and glucagon-like peptide-1 agonists in the therapeutic management of type 2 diabetes–a comprehensive review. Diabetes Technol Ther. 2010;12(1):11–24.
- Vilsbøll T, Christensen M, Junker AE, et al. Effects of glucagon-like peptide-1 receptor agonists on weight loss: systematic review and meta-analyses of randomised controlled trials. BMJ. 2012;344:d7771.
- Glintborg D, Mumm H, Holst JJ, et al. Effect of oral contraceptives and/or metformin on GLP-1 secretion and reactive hypoglycaemia in polycystic ovary syndrome. Endocr Connect. 2017;6(4):267–277.
- Frøssing S, Nylander M, Chabanova E, et al. Effect of liraglutide on ectopic fat in polycystic ovary syndrome: a randomized clinical trial. Diabetes Obes Metab. 2018;20(1):215–218.
- Pascale A, Marchesi N, Marelli C, et al. Microbiota and metabolic diseases. Endocrine. 2018;61(3):357–371.
- Rangan KJ, Hang H. Biochemical mechanisms of pathogen restriction by intestinal bacteria. Trends Biochem Sci. 2017;42(11):887–898.
- Sonnenburg JL, Bäckhed F. Diet-microbiota interactions as moderators of human metabolism. Nature. 2016;535(7610):56–64.
- Bäckhed F, Roswall J, Peng Y, et al. Dynamics and stabilization of the human gut microbiome during the first year of life. Cell Host Microbe. 2015;17(5):690–703.
- Barko PC, McMichael MA, Swanson KS, et al. The gastrointestinal microbiome: a review. J Vet Intern Med. 2018;32(1):9–25.
- Durack J, Lynch S. The gut microbiome: relationships with disease and opportunities for therapy. J Exp Med. 2019;216(1):20–40.
- Lynch SV, Pedersen O. The human intestinal microbiome in health and disease. N Engl J Med. 2016;375(24):2369–2379.
- Wu D, Wang H, Xie L, et al. Cross-Talk between gut microbiota and adipose tissues in obesity and related metabolic diseases. Front Endocrinol (Lausanne). 2022;13(13):908868.
- Chu W, Zhai J, Xu J, et al. Continuous Light-Induced PCOS-Like changes in reproduction, metabolism, and gut microbiota in Sprague-Dawley rats. Front Microbiol. 2019;10(10):3145.
- Guney G, Taskin MI, Baykan O, et al. Endotrophin as a novel marker in PCOS and its relation with other adipokines and metabolic parameters: a pilot study. Ther Adv Endocrinol Metab. 2021;12(12):20420188211049607.
- Zhou L, Ni Z, Yu J, et al. Correlation between fecal metabolomics and gut microbiota in obesity and polycystic ovary syndrome. Front Endocrinol (Lausanne). 2020;11(11):628.
- He F, Li Y. The gut microbial composition in polycystic ovary syndrome with insulin resistance: findings from a normal-weight population. J Ovarian Res. 2021;14(1):50.
- Zhang J, Sun Z, Jiang S, et al. Probiotic Bifidobacterium lactis V9 regulates the secretion of sex hormones in polycystic ovary syndrome patients through the Gut-Brain axis. mSystems. 2019;4(2):e00017–00019.
- Chu W, Han Q, Xu J, et al. Metagenomic analysis identified microbiome alterations and pathological association between intestinal microbiota and polycystic ovary syndrome. Fertil Steril. 2020;113(6):1286–1298.e4.
- He F-F, Li Y-M. Role of gut microbiota in the development of insulin resistance and the mechanism underlying polycystic ovary syndrome: a review. J Ovarian Res. 2020;13(1):73.
- Zhao L, Chen Y, Xia F, et al. A Glucagon-Like peptide-1 receptor agonist lowers weight by modulating the structure of gut microbiota. Front Endocrinol (Lausanne). 2018;9:233.
- Rotterdam ESHRE/ASRM-Sponsored PCOS Consensus Workshop Group. Revised 2003 consensus on diagnostic criteria and long-term health risks related to polycystic ovary syndrome. Fertil Steril. 2004;81:19–25.
- Han Y, Li Y, He B. GLP-1 receptor agonists versus metformin in PCOS: a systematic review and meta-analysis. Reprod Biomed Online. 2019;39(2):332–342.
- Elkind-Hirsch K, Marrioneaux O, Bhushan M, et al. Comparison of single and combined treatment with exenatide and metformin on menstrual cyclicity in overweight women with polycystic ovary syndrome. J Clin Endocrinol Metab. 2008;93(7):2670–2678.
- Tao T, Zhang Y, Zhu Y-C, et al. Exenatide, metformin, or both for prediabetes in PCOS: a randomized, open-label, parallel-group controlled study. J Clin Endocrinol Metab. 2021;106(3):e1420–e1432.
- Thursby E, Juge N. Introduction to the human gut microbiota. Biochem J. 2017;474(11):1823–1836.
- Tremaroli V, Bäckhed F. Functional interactions between the gut microbiota and host metabolism. Nature. 2012;489(7415):242–249.
- Yurtdaş G, Akdevelioğlu Y. A new approach to polycystic ovary syndrome: the gut microbiota. J Am Coll Nutr. 2020;39(4):371–382.
- Liu R, Zhang C, Shi Y, et al. Dysbiosis of gut microbiota associated with clinical parameters in polycystic ovary syndrome. Front Microbiol. 2017;8:324.
- Guo J, Shao J, Yang Y, et al. Gut microbiota in patients with polycystic ovary syndrome: a systematic review. Reprod Sci. 2022;29(1):69–83.
- Kohl KD, Amaya J, Passement CA, et al. Unique and shared responses of the gut microbiota to prolonged fasting: a comparative study across five classes of vertebrate hosts. FEMS Microbiol Ecol. 2014;90(3):883–894.
- Parker BJ, Wearsch PA, Veloo ACM, et al. The genus alistipes: gut bacteria with emerging implications to inflammation, cancer, and mental health. Front Immunol. 2020;11:906.
- Jobira B, Frank DN, Pyle L, et al. Obese adolescents with PCOS have altered biodiversity and relative abundance in gastrointestinal microbiota. J Clin Endocrinol Metab. 2020;105(6):e2134–2144–e2144.
- Binda C, Lopetuso LR, Rizzatti G, et al. Actinobacteria: a relevant minority for the maintenance of gut homeostasis. Dig Liver Dis. 2018;50(5):421–428.
- Wahida A, Tang F, Barr JJ. Rethinking phage-bacteria-eukaryotic relationships and their influence on human health. Cell Host Microbe. 2021;29(5):681–688.
- Koopen A, Witjes J, Wortelboer K, et al. Duodenal anaerobutyricum soehngenii infusion stimulates GLP-1 production, ameliorates glycaemic control and beneficially shapes the duodenal transcriptome in metabolic syndrome subjects: a randomised double-blind placebo-controlled cross-over study. Gut Microbes. 2021;25:gutjnl-2020-323297.
- Yoshida N, Emoto T, Yamashita T, et al. Bacteroides vulgatus and Bacteroides dorei reduce gut microbial lipopolysaccharide production and inhibit atherosclerosis. Circulation. 2018;138(22):2486–2498.
- You JS, Yong JH, Kim GH, et al. Commensal-derived metabolites govern Vibrio cholerae pathogenesis in host intestine. Microbiome. 2019;7:132.
- Steimle A, Michaelis L, Di Lorenzo F, et al. Weak agonistic LPS restores intestinal immune homeostasis. Mol Ther. 2019;27(11):1974–1991.
- Wang K, Liao M, Zhou N, et al. Parabacteroides distasonis alleviates obesity and metabolic dysfunctions via production of succinate and secondary bile acids. Cell Rep. 2019;26(1):222–235.e5.
- He Y, Wang Q, Li X, et al. Lactic acid bacteria alleviate polycystic ovarian syndrome by regulating sex hormone related gut microbiota. Food Funct. 2020;11(6):5192–5204.
- Huang J, Chen P, Xiang Y, et al. Gut microbiota dysbiosis-derived macrophage pyroptosis causes polycystic ovary syndrome via steroidogenesis disturbance and apoptosis of granulosa cells. Int Immunopharmacol. 2022;107:108717.
- Zhai Q, Feng S, Arjan N, et al. A next generation probiotic, Akkermansia muciniphila. Crit Rev Food Sci Nutr. 2019;59(19):3227–3236.
- Tan H, Zhai Q, Chen W. Investigations of bacteroides spp. towards next-generation probiotics. Food Res Int. 2019;116:637–644.
- Ha CWY, Martin A, Sepich-Poore GD, et al. Translocation of viable gut microbiota to mesenteric adipose drives formation of creeping fat in humans. Cell. 2020;183(3):666–683.e17.
- Cherny KE, Ozer EA, Kochan TJ, et al. Complete genome sequence of Clostridium innocuum strain LC-LUMC-CI-001, isolated from a patient with recurrent antibiotic-associated diarrhea. Microbiol Resour Announc. 2020;9(28):e00365-00320.
- Lakhdari O, Tap J, Béguet-Crespel F, et al. Identification of NF-κB modulation capabilities within human intestinal commensal bacteria. J Biomed Biotechnol. 2011;2011:282356.
- Louis P, Flint HJ. Formation of propionate and butyrate by the human colonic microbiota. Environ Microbiol. 2017;19(1):29–41.
- Prakash S, Rodes L, Coussa-Charley M, et al. Gut microbiota: next frontier in understanding human health and development of biotherapeutics. Biologics. 2011;5:71–86.
- Ait Chait Y, Gunenc A, Hosseinian F, et al. Antipathogenic and probiotic potential of Lactobacillus brevis strains newly isolated from Algerian artisanal cheeses. Folia Microbiol (Praha). 2021;66(3):429–440.
- Song MW, Chung Y, Kim KT, et al. Probiotic characteristics of Lactobacillus brevis B13–2 isolated from kimchi and investigation of antioxidant and immune-modulating abilities of its heat-killed cells. LWT. 2020;128:109452.
- Pourbaferani M, Modiri S, Norouzy A, et al. A newly characterized potentially probiotic strain, Lactobacillus brevis MK05, and the toxicity effects of its secretory proteins against MCF-7 breast cancer cells. Probiotics Antimicrob Proteins. 2021;13(4):982–992.
- Li L, Yang B, Humza M, et al. A novel strain Lactobacillus brevis 8–2B inhibiting Aspergillus carbonarius growth and ochratoxin a production. LWT. 2021;136:110308.
- Defois C, Ratel J, Garrait G, et al. Food chemicals disrupt human gut microbiota activity and impact intestinal homeostasis as revealed by in vitro systems. Sci Rep. 2018;8(1):11006.
- Maqdasy S, Lecoutre S, Renzi G, et al. Impaired phosphocreatine metabolism in white adipocytes promotes inflammation. Nat Metab. 2022;4(2):190–202.