
Abstract
Objective
To investigate the effect of Bushen Huoxue Recipe (BSHXR) on serum metabolomics in polycystic ovary syndrome rat (PCOSR).
Methods
In our study, twenty-four 6-week-old Sprague-Dawley (SD) female rats were randomly divided into three groups: treatment group, model group and blank group. The blank group and other groups were gavaged in different ways each morning, and the rats were treated with normal saline or BSHXR containing liquid each afternoon. Liquid chromatography-mass spectrometry (LC-MS) was employed to study serum metabolites in the treatment group after the study as well as in the model and blank groups.
Results
There was a tendency to normalize the histomorphology of ovarian pathology and the abnormal sex hormone level of PCOSR was significantly improved after BSHXR treatment. The level of serum metabolites was greatly changed in PCOSR treated with the BSHXR. We identified 32 metabolic targets of BSHXR in PCOSR using LC-MS, and further revealed BSHXR targeted five major metabolic pathway: retrograde endocannabinoid signaling, taurine and hypotaurine metabolism, glycerophospholipid metabolism, primary bile acid biosynthesis, arginine and proline metabolism. Conclusion: Our study found that BSHXR plays a role in the treatment of PCOS by regulating key metabolic pathways in the PCOSR.
Introduction
Polycystic ovary syndrome is a disease caused by complicated endocrine and metabolic abnormalities, which is characteristic of ovulatory dysfunction, hyperandrogenemia, and menstrual irregularities. It is estimated about 15% to 20% of reproductive age females worldwide at present suffer from PCOS, resulting in a multi-billion-dollar annual health care burden, however, treatment progress has been impeded [Citation1]. The prevalence of polycystic ovary syndrome is rising with each passing year. In 2021, the morbidity of PCOS among women of childbearing age in China was 7. 8%, an increase of nearly 65% compared with ten years ago. It is preliminarily estimated that about 24 million women of childbearing age suffer from this disease [Citation2]. PCOS is frequently accompanied by mental problems, such as anxiety and depression, causing financial and emotional burdens to patients [Citation3,Citation4]. At present, the pathological mechanism of PCOS is not clarified, and the mechanism of drug treatment needs further study. The focus of experimental study associated with drug interventions for PCOS is mainly on specific targets or pathways, which makes it difficult to avoid the drawback of drug working networks being too complex to explain the findings. An active research trend in the field is to explore the mechanism of drug action on PCOS based on molecular level of metabolites.
Metabolomics, the closest phenotypic omics, is the study of the results concerning metabolite changes influenced by genetic modifications and external environmental alterations. LC-MS works for the analysis of metabolites difficult to volatilize or poor thermal stability, with high-throughput, high-resolution, and high-sensitivity characteristics. Numerous studies indicate that serum metabolites are related to endocrine system disorders like PCOS. For instance, Wei Huang’s research on the dynamics of endogenous metabolites during the development of PCOS demonstrated that arginine and proline metabolic pathways changed significantly at day 10, and taurine and Inositol phosphate metabolite salts were affected noticeably at day 22, implying the disorder degree of PCOS metabolites was not consistent across time [Citation5]. It was reported that follicular fluid in PCOS patients with kidney-yang deficiency syndrome exhibited remarkable changes in phenylalanine, linoleic acid, oleic acid, and 34 other metabolites, involving fatty acid metabolism, amino acid metabolism, and bile acid biosynthesis pathways [Citation6]. Branched-chain amino acids and aromatic amino acids are important potential metabolites for the therapeutic efficacy of exenatide in overweight/obese PCOS patients [Citation7].
Compound oral contraceptives are not consistently effective with the risk of side effects increasing progressively with long-term use [Citation8]. The therapeutic effect of TCM on PCOS has been validated repeatedly and possessed value and advantages. The BSHXR is a synthetic prescription from ‘Shou Tai Wan’ (mentioned in the TCM book ‘Yixue Zhongzhong Canxi Lu’ in 1909) and ‘Gui Zhi Fu Ling Wan’ (mentioned in the archaic TCM book ‘Jingui Yaolue’ in the East Han Chinese period), which is widely used clinically. Additionally, The BSHXR has the function of tonifying the kidney and invigorating the blood, which has proven to be effective in the treatment of PCOS [Citation9]. We performed a metabolomic study based on LC-MS and multivariate statistical analysis which showed BSHXR's therapeutic effect on PCOSR model was associated with metabolic changes in relation to bile acids, lipids, taurine and hypoxanthine, further detailing the metabolic mechanisms underlying the clinical use of BSHXR in the PCOS treatment.
Materials and methods
Reagents and instrument
All chemicals and solvents were analytical or HPLC grade. Water, methanol, acetonitrile and formic acid were purchased from Thermo Fisher Scientific (Thermo Fisher Scientific, Waltham, MA, USA). L-2-chlorophenyl alanine was purchased from Shanghai Heng Chuang Biotechnology Co., Ltd. (Shanghai, China). The instruments required for LC/MS non-targeted metabolome analysis were purchased from Chengdu Qingxing Technology Co., Ltd. (激素试剂盒)
Preparation of BSHXR decoction
BSHXR was a product of the traditional Chinese medicine pharmacy of Sichuan Provincial Hospital of traditional Chinese medicine (No.15013726, China). In brief, 8.75 g Cinnamon Twig, 10.5 g Poria Cocos, 10.5 g Peony Bark, 10.5 g Red Peony, 5.25 g Peach Kernel, 7 g Mulberry Parasitism, 15.75 g Dipsacus Chinensis, 7 g Dodder, and 35 g Ejiao. Verification and weighting of all Chinese medicines were carried out at hospital of TCM in Sichuan Province. The above drugs were then made into medicine decocion. The specification of BSHXR was 31.5 g per box.
Animals and grouping
Twenty-four female SD rats (6 weeks) were purchased from Chengdu Dashuo Biotechnology Co Ltd (Licence No. SCXX (Chuan) 2020-030) and were housed at 25 ± 2 °C and a 12-h day/night cycle.
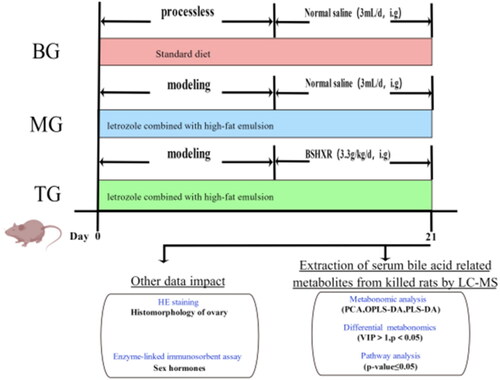
24 rats were randomly divided into three groups: treatment group (n = 8), referred to as ‘TG’, model group (n = 8), referred to as ‘MG’, and blank group (n = 8), referred to as ‘BG’. The TG and MG rats were gavaged with letrozole combined with high-fat emulsion every morning to form the PCOSR model. Details were as follows: Letrozole was ground into powder and prepared as a 10 g/L solution, stored at 4 °C in the refrigerator and protected from light; high-fat emulsion was formulated with 10% lard and 3% cholesterol, kept in airtight refrigeration and melted in a water bath at 50 °C when used. The TG and MG rats were gavaged with letrozole solution (1 ml/10 g) and high-fat emulsion (1.5 ml/100 mg) daily in the morning for continuous 21 days. TG were gavaged with BSHXR (3.3 g/kg-1·d-1) each afternoon for 21 days. MG and BG rats were gavaged with the equal volume of saline at the same time each afternoon. Because previous experiments confirmed the best efficacy for PCOSR at this dose, different dose groups were not set up [Citation9]. This experiment was approved by the Experimental Animal Ethics Committee of Chengdu University of TCM. There were 6 rats left in each group at the end of the research after excluding the dead rats ().
Figure 1. Overview of experimental design (made with figdraw).
Weight measurement
After the experiment started, the bodyweight of rats was weighed weekly with an electronic weighing scale and recorded.
Estrous cycle determination
Vaginal smears were observed daily at the same time starting on day 10 of the experiment. The stage of the estrous cycle was judged by the microscope observation and analysis of the change of vaginal epithelial cells using the Pasteur staining kit.
Histomorphology of ovary
The right ovary of rats was fixed in 4% paraformaldehyde for 24 h, dehydrated routinely, embedded in paraffin, and made into 3 μm ovarian tissue sections. The sections were stained with HE, dehydrated with ethanol, and sealed with neutral gum. Watch the sections under the scanner, collect the images and observe the ovarian tissue morphology under the 40x microscope.
Sex hormone level
The levels of testosterone (T), follicle stimulating hormone (FSH) and luteinizing hormone (LH) in the serum of each group of rats were measured at the end of our experiment using an enzyme-linked immunosorbent assay (ELISA).
Metabolomics analysis
Serum sample processing
-80 °C samples were thawed at room temperature. A 100 μL of serum sample was added to a 1.5 ml Eppendorf tube with 20 μL of L-2-chlorophenyl alanine (0. 06 mg/mL) dissolved in methanol as internal standard, and the tube was shaken by vortex for 10s. With added 300 μL ice-cold mixture of acetonitrile and methanol (1/2, vol/vol), the mixture was vortexed for 1 min. The whole samples were extracted with ultrasonic waves in ice water for 10 min and stored at −20 °C for 30 min. The extract was centrifuged at 4 °C (13,000 rpm) for 10 min. After centrifugation, 200 μL of supernatant in an LC/MS injection glass vial was dried in a centrifugal dryer. Each sample was added to a 300 μL mixture of methanol and water (1/4, vol/vol). Samples were vortexed for 30s, extracted in the ice water bath for 3 min, and placed at −20 °C for 2h. The samples were centrifuged at 4 °C (13, 000 rpm) for 10 min. Supernatants from 150 μL were collected, filtered through an organic phase pinhole filter (0.22 μm), and transferred to LC vials. Quality control (QC) samples were prepared by mixing equal volumes of sample extracts and analyzed regularly throughout the analysis process to ensure the stability and accuracy of the measurement throughout the analysis process.
Analysis conditions of liquid chromatography and mass
Spectrometry Chromatography was performed on an ACQUITY UPLC HSS T3 column (100 mm × 2.1 mm, 1.8 μm) with a mobile phase consisting of (A) water (containing 0.1% formic acid, v/v) and (B) acetonitrile (containing 0.1% formic acid, v/v). Separation was achieved by using the gradient below:0min, 95% A, 5% B; 2 min, 95%A, 5%B; 4 min, 70%A, 30%B; 8 min, 50%A, 50%B; 10 min, 20%A, 80%B;14min, 0%A, 100%B; 15. 1 min, 95%A, 5%B; 16 min, 95%A, 5%B. With a flow rate of 0.35 ml/min, the column was maintained at 45 °C. The injection volume was 2 μL. Electrospray ionization detected MS conditions in positive and negative ion modes. The ESI was set as follows: spray voltage, 3.8 kV (+) and 3.0 kV (-); Aux gas heater temperature, 320 °C; Sheath gas flow rate, 40arb; Aux gas flow rate, 10arb; collision energy, 10, 20, and 40 eV; S-lens RF level, 50; mass range, 100–1200 m/z. Stability was evaluated by injecting QC samples every six samples during the analysis run.
Data processing and statistical analysis
The initial sample data were analyzed and handled by the software Progenesis QI V2. 3 (Newcastle, UK) for baseline filtering, peak identification, integration, retention time correction, etc. The main parameters of 5 ppm precursor tolerance, 10 ppm product tolerance, and 5% product ion threshold were applied.
Firstly, the related recipes were determined by a mass charge ratio (m/z), secondary fragments, and isotope distribution. Then compared it with The Human Metabolome Database (HMDB), Lipidmaps (V2.3), Metlin, EMDB, PMDB, and self-built databases for qualitative analysis. The data were extracted and further processed by rejecting any peaks with a missing value (ion intensity = 0) in more than 50% of groups, by replacing the 0 value with half of the minimum value, and by screening according to the qualitative results of the recipe. Recipes with resulting scores above 36 (out of 60) points were retained as the final identification results. A data matrix was combined from the positive and negative ion data.
Afterward, the matrices were imported in R to perform principle component analysis (PCA) to observe the overall distribution between the samples and the stability of the entire analysis. The metabolites were subjected to a multivariate statistical analysis, including orthogonal partial least squares discriminant analysis (OPLS-DA) and partial least squares discriminant analysis (PLS-DA), to distinguish the metabolite’s differences among groups. The model was evaluated using 7-fold cross-validation and 200 Response Permutation Testing. The variables were sorted based on the Variable Importance of Projection (VIP) values obtained from the OPLS-DA model. The differential metabolites between BG and MG or MG and TG were screened based on VIP > 1 and p < 0.05. Finally, the differential metabolites were analyzed by metabolic pathway enrichment.
Statistical methods
All data were analyzed using SPSS v22.0 statistical software. The Shapiro-Wilk test was used to determine the type of distribution of the variables and then a one-way ANOVA test was applied. Parameters obeying a positive distribution were expressed as mean ± standard deviation (Mean ± SD). Samples with an asterisk (*) showed a significant difference (p < 0.05).
Results
Effects of BSHXR on weight, estrus cycle, and histopathology of ovary in rats
After the experiment, the body weight of the three groups of rats exhibited significant differences at 7, 14, and 21 days. The body weight of MG rats increased significantly (p < 0.01) at 7, 14 and 21 days compared to BG. Our analysis yielded that although the body weight of TG rats and BG rats showed differences at 14 and 21 days, the body weight of TG rats was significantly lower than that of MG rats (p < 0.01, ). The changes of estrus cycle were observed to determine the success of modeling. Rats in BG exhibited regular estrous cycles of 5 days (), whereas the MG rats were in the proestrus or estrus phase, showing disordered estrous cycles and indicating PCOSRs were successfully modeled (). TG rats had prolonged estrous cycle times and occasionally exhibited regular estrous cycles (). HE staining demonstrated a variety of follicles in the ovarian tissue of the rats in BG, with mature follicles and corpus luteum visible, and multiple layers of follicular granulosa cells (). In MG, the number of granulosa cell layers in the rat ovary decreased, more atresia follicles and cystic follicles were found, and the number of corpus luteum decreased significantly (). The number of cystic follicles and closed follicles in the ovaries of rats in TG decreased, and a little corpus luteum was visible compared with MG (). Together, these results indicated the PCOSR model was successful.
Figure 2. (a), (b) and (c) revealed the Influence of PCOS modeling on the estrous cycle of rats; E denoted Estrus, M denoted metestrus, D denoted diestrus, and P denoted proestrus. (d), (e) and (f): Histomorphology of ovaries of rats in three groups (HE, ×40).
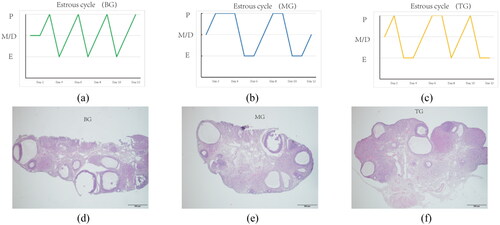
Table 1. The body weight of rats in the three groups.
Effects of BSHXR on sex hormone levels in rats
Compared with BG, MG rats had significantly higher serum T, LH and FSH (p < 0.01). Compared with MG, serum T, LH and FSH were significantly lower in rats after BSHXR intervention (p < 0.01). ()
Table 2. Effects of modeling and BSHXR on T, FSH, and LH in rats.
LC-MS analysis of serum metabolic profiles of rats in three groups and stability of LC-MS system
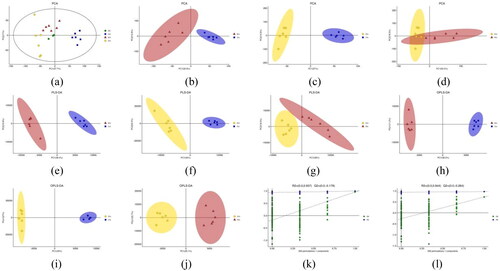
Next we used LC-MS to analyze the metabolic profiles of serum samples collected from rats in TG, MG and BG. Meanwhile, in order to evaluate the sample on board and the stability of the mass spectrometry system for this study, we performed quality control using QC samples. The Base Peak Chromatogram (BPC)in different ion modes of the 3 QC samples are separately superimposed and compared, and the results show the response intensity and retention time of the peaks in each color spectrum are basically overlapped, indicating the excellent system stability and reliable data quality. The BPC displays the common metabolic profile of the three groups and also shows the variability of the peaks in these three groups. The PCA plot obtained by 7-fold cross-validation (), again suggests differences among the groups, as well as the tight aggregation of QC samples observed on the plot, which can further demonstrate the excellent stability of the instrumental assay.
Figure 3. A-b represents BG, B-b represents mg and D-b represents TG (the following Figures have the same meanings as here). (b), (c) and (d): PCA model plots after pairwise comparison of three groups of samples. (e), (f) and (g): PLS-DA model plots after pairwise comparison of three groups of samples. (h), (f) and (j): OPLS-DA model plots after pairwise comparison of three groups of samples. (k) and (l): response sorting test results of OPLS-DA model (Q2 (cum) indicated the predictive ability of the model, with Q2 (cum) > 0.5 being considered a valid model or Q2 (cum) > 0.9 being an excellent model).
Data processing
Raw data were preprocessed with Progenesis QI v2.3 software, including baseline filtering, peak identification, retention time correction, etc. The characterization was then performed using The Human Metabolome Database, ipidmaps (v2.3), METLIN database, and self-built libraries. Subsequently, the compounds were scored according to their qualitative results (60-points scale), while those with scores less than 36 were removed, and finally the matrix of data including m/z, RT, metabolite name, compound number, etc. was obtained. The results show that 4983 variables from positive ion data and 5229 variables from negative ion data are acquired.
PCA, PLS-DA and OPLS-DA analysis
The PCA model reflects the inter-group and intra-group variability of the samples in general to observe the overall distribution trend among samples (). When the MG vs. TG, BG vs. MG, and BG vs. TG comparative analyses were performed sequentially, the three PCA model analyze all obtained three principal components, and the cumulative sum of explanation was 52.3%, 55.3%, and 61.6%, respectively (). The above results indicate that the model has good explanatory power. The PCA shows a trend of separation among the three groups of samples. PCA, an unsupervised analysis, was difficult to accurately eliminate bias due to within-group differences, thus the supervised PLS-DA model was used to further differentiate the overall differences in metabolic profiles among the groups.
Table 3. Table of model parameters for comparative analysis between two groups.
The data matrices of MG and TG were identified supervised and PLS-DA model was built to find the differential metabolites between groups (). The PLS-DA analysis model extracted four principal components with a cumulative explanation rate of 72.2% in the X-axis direction model, 99.9% in the Y-axis direction model, and a cumulative prediction rate of 95.5%. Similarly, we identified the data matrices of BG and MG, BG and TG in turn, and the cumulative prediction rates of the PLS-DA model were 94.7% and 96.7%, respectively (). These findings suggest that the serum metabolic patterns of the three groups are different.
We further applied the OPLS-DA model in order to filter the factors irrelevant to the classification information and improve the resolution and validity of the model. By analyzing the OPLS-DA model separately for the three groups of samples, we found that the three groups of serum samples were clearly divided into three categories, and the metabolic trajectory of TG was closer to that of BG compared with MG, suggesting that the metabolic information of TG had a tendency to return to normal after BSHXR administration (). We assessed the explanatory rate (R2 (cum)) and predictive power (Q2 (cum)) of the OPLS-DA model, and further obtained R2 and Q2, two parameters of the response sorting test, to measure whether the model was overfitted. The OPLS-DA model built after comparing BG and MG was analyzed and showed R2 = 0.937, Q2 = −0.179 and Q2 (cum) = 0.727. Similarly, building the OPLS-DA model for comparison between MG and TG resulted in R2 = 0.94, Q2 = −0.264 and Q2 (cum) = 0.959. The results prove the model’s stability and strong predictive ability.
Metabolic pathways related to BSHXR intervention
A combination of multidimensional and unidimensional analyses is used to uncover biologically significant differential metabolites. The screening criteria are VIP > 1.0 for the first principal component of the OPLS-DA model and p < 0. 05 for the t-test. The data were visualized using volcano plots to show the classification trends of the samples more visually ().
Figure 4. Volcano plots were used to visualize the experimental values.
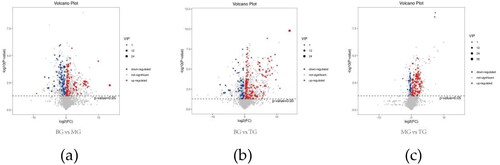
Differential metabolite screening
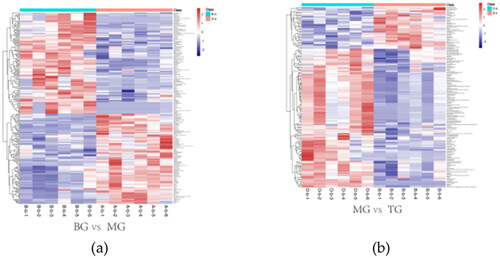
Differential metabolites were screened according to the criteria of p < 0.05 and VIP > 1.0. After comparison of BG with MG, we screened 216 differential metabolites (including 95 lipids and similar molecules and 15 organic oxygen recipes). Comparing MG with TG, Differential metabolites were screened different metabolites (including 79 lipids and similar molecules and 17 organooxygen recipes). We ranked the differential metabolites between groups according to the magnitude of VIP values, while filtering out the metabolites with KEGG ID. There were 28 up-regulated and 28 down-regulated differential metabolites of MG compared to BG (). There were 17 up-regulated and 15 down-regulated differential metabolites of TG compared to MG (). Thermal analysis of different metabolites between groups showed that the abundance of most serum metabolites in PCOSR was greatly different from that in BG, indicating that letrozole combined with a high-fat diet had a profound effect on metabolic profiles. The level of serum metabolites was greatly changed in PCOSRs treated with the BSHXR.
Figure 5. The above two heat maps represent the content and types of differential metabolites between different groups. In a heat map, the warmer the color, the higher the content, while the cooler the color, the lower the content. (a) revealed heat map of differential metabolites between BG and MG groups. (b) revealed heat map of differential metabolites between MG and TG groups.
Correlation analysis
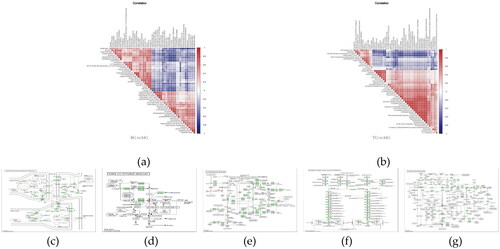
To further understand the interrelationship between the differential metabolites during the course of biological state changes, we measured the degree of linear correlation between the two metabolites using Pearson’s correlation coefficient by correlation analysis ().
Figure 6. (a) and (b) Correlation analysis can help measure how closely the significantly different metabolites are related to each other and provide further insight into metabolite interrelationships during changes in biological state. (c)–(g) Small circles indicate compounds. Metabolites identified in red are up-regulated compounds detected in this experiment and blue are down regulated compounds. Arrows indicate direction of reaction. Small boxes indicate enzymes; Small green boxes indicate enzymes unique to the species; large oblique squares indicate other metabolic pathways.
Metabolic pathway enrichment analysis
Pathway enrichment analysis was performed using KEGG ID of differential metabolites to obtain metabolic pathway enrichment results. The findings suggested that the mechanism of BSHXR for PCOS involved five metabolic pathways: retrograde endocannabinoid signaling, taurine and hypotaurine metabolism, glycerophospholipid metabolism, primary bile acid biosynthesis, arginine and proline metabolism. In addition, we plotted display maps for each metabolic pathway (), with the small circles in the metabolic pathway maps representing the differential metabolites identified in the study.
Discussion
There are two major findings of this study. Firstly, we observed that BSHXR significantly improved the levels of sex hormones, the pathological state of the ovaries, and the disturbance of the motility cycle, as expected. Secondly, we identified 32 metabolic targets of BSHXR in PCOSR by using LC-MS techniques to investigate differences in metabolic patterns between groups, and revealed five main metabolic pathways, including retrograde endocannabinoid signaling, taurine and hypotaurine metabolism, glycerophospholipid metabolism, primary bile acid biosynthesis, arginine and proline metabolism.
Metabolomics integrates multidisciplinary knowledge of biology and analytical chemistry to investigate the overall biological functional status and enables the integration of information at different levels such as genes and proteins to account for the biochemical interpretation of organisms [Citation10]. LC-MS is primarily suitable for the analysis of metabolites with difficult volatility or poor thermal stability, and it is characterized by high throughput, high resolution, and high sensitivity [Citation11]. Therefore, metabolomics has unique advantages in studying the metabolic patterns of drugs and the intrinsic mechanisms of diseases.
Retrograde endocannabinoid signaling
The endocannabinoid system (ECS) consists of the cannabinoid receptor (CBR), its ligands, and enzymes that regulate its biosynthesis and degradation [Citation12]. Endocannabinoids (EC) include two primary compounds, anandamide (AEA) and 2-arachidonic acid glycerol (2-AG). Elements of the ECS are present in the follicle, ovary and uterus as well as being involved in appetite regulation [Citation13], energy metabolism and the neuroendocrine system [Citation14]. Kabakchieva et al. found that 2-AG to be significantly lower in PCOS patients with polycystic ovarian morphology compared to healthy individuals [Citation15]. This result is consistent with the data from Chi-Chang Juan’s study [Citation16]. Insulin resistance (IR) and hyperandrogenemia are prevalent in PCOS and they are mutually causal. Androgen can induce PCOS by initiating mitochondrial dysfunction [Citation17], and reactive oxygen species production by mitochondria is associated with IR [Citation18]. Cannabinoid receptor type 1(CB1R)exists in the mitochondrial membrane of ovarian steroid-producing cells. Since luteinizing hormone synthesis is processed in mitochondria, EC exacerbates the pathological process of PCOS by affecting luteinizing hormone synthesis in these cells through CB1R. CB1R can be expressed in both α and β cells of pancreatic islets [Citation19], and we know that AEA and 2-AG are agonists of CB1R. Once CB1R activates ECS, this leads to changes in fatty acid synthesis, increase in insulin sensitivity, and fat accumulation [Citation20]. Furthermore, IR causes visceral lipolysis, increases circulating free fatty acids, and exacerbates fatty acid oxidation, which produces a vicious cycle [Citation21]. Abnormalities in fatty acids are closely associated with the development of liver injury. Thozhukat et al. suggested that cannabinoid receptor blockade in obese women with PCOS could increase hepatocyte growth factors and decrease insulin levels [Citation22].
In the present study, we found that serum levels of metabolites associated with ECS were altered in PCOSR after BSHXR intervention, i.e. the level of three compounds was downregulated (phosphatidylethanolamine(14:0/22:2(13Z,16Z), phosphatidylcholine(18:2(9Z,12Z)/20:2(11Z,14Z), diacylglycerol(18:0/20:4(5Z,8Z,11Z,14Z)/0:0)). We suggested that BSHXR might reduce plasma AEA levels in PCOS patients through an indirect pathway to improve PCOS.
Primary bile acid biosynthesis, taurine and hypotaurine metabolism
Bile acids are the end products of cholesterol metabolism. Taurine enhances the activity and expression of related enzymes and promotes the biotransformation of cholesterol to bile acids. Meanwhile, when chenodeoxycholic acid and cholic acid are synthesized in the liver as two primary bile acids, they are conjugated with taurine after enzymatic activation to form conjugated bile acids (e.g. taurocholic acid, taurochenodeoxycholic acid, tauroursodeoxycholic acid). Then, they are excreted into the intestine and participate in food digestion. Some of these primary bile acids that are not reabsorbed in the ileum are converted to secondary bile acids, which are involved in pathophysiological processes such as glucolipid metabolism, inflammatory response and sex hormone regulation.
Yu Su et al. found a significant increase in total bile acids, especially elevated primary bile acids and changes in the percentage of various bile acids, suggesting an altered bile acid profile in PCOS patients when they compared circulating bile acid profiles in healthy individuals and PCOS patients [Citation23]. Of interest, conjugated bile acid levels were positively correlated with serum total testosterone and androstenedione concentrations, implying a link between the bile acid signaling pathway and hyperandrogenemia in PCOS. Bile acids act as signaling molecules by binding to the farnesol X receptor (FXR) [Citation24]. Scholars found that Leydig cells treated with primary bile acids activated FXR, which downregulated the conversion of androgens to estrogens and attenuated the expression and activity of aromatase [Citation25]. FXR is also present in human ovarian granulosa cells [Citation26], so the pathological process probably occurs in PCOS patients: primary bile acids activate FXR expression in ovarian granulosa cells, reduce estrogen production, and form hyperandrogenism. Smith et al. suggested that high concentrations of serum bile acids stimulated FXR activity and increased cellular glucose flux [Citation27]. In addition, FXR regulated peripheral insulin sensitivity through induction of fibroblast growth factor 19 [Citation28]. Tauroursodeoxycholic acid attenuated androgen-activated endoplasmic reticulum stress in granulosa cells of PCOS patients, resulting in a reduction of late glycosylation end-products in granulosa cells and alleviating the further development of PCOS pathology [Citation29]. These results indicate that taurine promotes bile acid production and binds to it, and in turn ameliorates endocrine metabolic disorders through conjugated bile acids.
We found that BSHXR significantly increased the serum levels of taurine and taurocholic acid in PCOSR, thus raising the possibility that BSHXR improved sex hormone levels to facilitate PCOS treatment. The study of how these changes affect sex hormone levels should be extremely intriguing.
Glycerophospholipid metabolism
Biological membranes are mainly composed of phospholipids, which are further divided into glycerophospholipids and sphingolipids. Phosphatidylcholine (PC) is a class of glycerophospholipids and we are aware that PC is the major source of lyso-phosphatidylcholine (lyso-PC). Lyso-PC bound to its receptor G protein-coupled receptor triggers oxidative stress, chemokine expression and inflammatory response through activation of mitogen-activated protein kinase (MAPK) [Citation30]. Chronic inflammation is a causative factor in the pathogenesis of PCOS [Citation31]. Several studies confirmed the presence of MAPK/ERK pathway in ovarian tissue of PCOS patients, which was associated with IR and abnormal ovarian morphology in PCOS patients [Citation32]. Our results showed that BSHXR downregulated glycerophospholipid levels in PCOSR (phosphatidic acid (0:0/18:2 (9Z, 12Z), phosphatidyl choline (18:2 (9Z, 12Z)/20:2 (11Z, 14Z), phosphatidyl ethanolamine (14:0/22:2 (13Z, 16Z)), providing another basis for studying the therapeutic effects of this drug.
Arginine and proline metabolism
L-arginine is a precursor of nitric oxide (NO), and NO is a powerful antioxidant that exerts anti-inflammatory effects by scavenging reactive oxygen species. L-arginine regulated lipid metabolism and reduced the expression of key enzymes for white fat accumulation to increase lipolysis and inhibit lipid synthesis, and also altered the activity of matrix metalloproteinases [Citation33]. Moreover, the ability of L-arginine to effectively reduce serum testosterone levels was associated with NO binding to cytochrome P-450 so as to inhibit steroid production [Citation34]. NO is related to ovarian blood flow and ovulation as one of the regulatory signals [Citation35]. Prolidase is a matrix metalloproteinase whose activity is affected by oxidative stress. Nese et al. found that serum prolidase activity was significantly higher in PCOS patients than in healthy subjects, and its activity was positively correlated with total oxidative status and the number of follicles [Citation36]. Arginine, as an intermediate metabolite, links the tricarboxylic acid cycle to arginine and proline metabolism. It was shown that inhibition of the IRS-1-PI3K/Akt pathway associated with IR was linked to disturbances in arginine and proline metabolism, with NO as the main factor involved [Citation5].
In this study, two metabolites associated with arginine and proline metabolism in serum were significantly upregulated in PCOSR (5-L-glutamyl-L-alanine and creatine) after BSHXR intervention. Therefore, we hypothesize that arginine and proline metabolism is one of the mechanisms of BSHXR in the treatment of PCOS.
Conclusion
In conclusion, we obtained thirty-two characteristic metabolic targets of BSHXR in PCOSR using LC-MS technique in this study and identified five metabolic pathways. This study showed that BSHXR could play a role in the treatment of PCOS by regulating key metabolic pathways such as retrograde endocannabinoid signaling, taurine and hypotaurine metabolism, glycerophospholipid metabolism, primary bile acid biosynthesis, and arginine and proline metabolism in PCOSR. We have identified specific targets and pathways related to drug intervention in PCOS, providing data support for exploring the molecular mechanism of drug action on PCOS at the metabolic product level, and further revealing the pathological mechanism of PCOS.
Metabolomic study is uniquely positioned to identify novel targets and intrinsic mechanisms of disease and represents an essential technique for studying disease processes and developing therapeutic strategies. In this study, although the pathophysiological mechanisms of PCOS were initially revealed from an animal perspective, we did not conduct further experiments to verify whether this change has an impact on PCOS patients. In addition, due to the limitations of the limited number of animals in this study, there is a lack of in-depth research on identified potential biomarkers and metabolic pathways.
Author’ contributions
Hongqiu Zhu designed the study and guided the experiments. Junjie Li completed the experiments and wrote the manuscript. Ying Zhu, Peijuan Wu, Hanxue Wu and Haiyan Chen assisted with experiments and reviewed the manuscript.
| Abbreviations | ||
| PCOS | = | polycystic ovary syndrome |
| BSHXR | = | Bushen Huoxue Recipe |
| TCM | = | traditional Chinese medicine |
| SD | = | Sprague-Dawley |
| PCOSR | = | polycystic ovary syndrome rat |
| LC-MS | = | liquid chromatography-mass spectrometry |
| ELISA | = | enzyme-linked immunosorbent assay |
| PCA | = | principle component analysis |
| OPLS-DA | = | orthogonal partial least squares discriminant analysis |
| PLS-DA | = | partial least squares discriminant analysis |
| BPC | = | base peak chromatogram |
| PC | = | phosphatidylcholine |
| MAPK | = | mitogen-activated protein kinase |
| NO | = | nitric oxide |
Disclosure statement
The authors declare no conflict of interest.
Additional information
Funding
References
- Stener-Victorin E, Padmanabhan V, Walters KA, et al. Animal models to understand the etiology and pathophysiology of polycystic ovary syndrome. Endocr Rev. 2020;41(4):1. doi: 10.1210/endrev/bnaa010.
- Yang R, Li Q, Zhou Z, et al. Changes in the prevalence of polycystic ovary syndrome in China over the past decade. Lancet Reg Health West Pac. 2022;25:100494. doi: 10.1016/j.lanwpc.2022.100494.
- Greenwood EA. The puzzle of polycystic ovary syndrome, depression, and anxiety. Fertil Steril. 2019;112(5):821–9. doi: 10.1016/j.fertnstert.2019.07.011.
- Barry JA, Kuczmierczyk AR, Hardiman PJ. Reporting the rates of depression in polycystic ovary syndrome (PCOS). J Sex Med. 2014;11(7):1882–1883. doi: 10.1111/jsm.12503.
- Huang W, Li S, Luo N, et al. Dynamic analysis of the biochemical changes in rats with polycystic ovary syndrome (PCOS) using urinary 1H NMR-based metabonomics. Horm Metab Res. 2020;52(1):49–57. doi: 10.1055/a-1073-2346.
- Song J, Xiang S, Yang Y, et al. Assessment of follicular fluid metabolomics of polycystic ovary syndrome in kidney yang deficiency syndrome. European J Integrat Med. 2019;30:100944. doi: 10.1016/j.eujim.2019.100944.
- Tang L, Yuan L, Yang G, et al. Changes in whole metabolites after exenatide treatment in overweight/obese polycystic ovary syndrome patients. Clin Endocrinol (Oxf). 2019;91(4):508–516. doi: 10.1111/cen.14056.
- Brabaharan S, Veettil SK, Kaiser JE, et al. Association of hormonal contraceptive use with adverse health outcomes: an umbrella review of meta-analyses of randomized clinical trials and cohort studies. JAMA Netw Open. 2022;5(1):e2143730. doi: 10.1001/jamanetworkopen.2021.43730.
- Zhu Y, Li Y, Liu M, et al. Guizhi fuling wan, Chinese herbal medicine, ameliorates insulin sensitivity in PCOS model rats with insulin resistance via remodeling intestinal homeostasis. Front Endocrinol (Lausanne). 2020;11:575. doi: 10.3389/fendo.2020.00575.
- Alseekh S, Fernie Alisdair R. Metabolomics 20 years on: what have we learned and what hurdles remain? Plant J. 2018;94(6):933–942. doi: 10.1111/tpj.13950.
- Gika HG, Theodoridis GA, Plumb RS, et al. Current practice of liquid chromatography–mass spectrometry in metabolomics and metabonomics. J Pharm Biomed Anal. 2014;87:12–25. doi: 10.1016/j.jpba.2013.06.032.
- Salzet M. Invertebrate molecular neuroimmune processes. Brain Res Brain Res Rev. 2000;34(1–2):69–79. doi: 10.1016/S0165-0173(00)00041-2.
- Yang T, Zhao J, Liu F, et al. Lipid metabolism and endometrial receptivity. Hum Reprod Update. 2022;28(6):858–889. doi: 10.1093/humupd/dmac026.
- Svizenska I, Dubovy P, Sulcova A, Ulcová A. Cannabinoid receptors 1 and 2 (CB1 and CB2), their distribution, ligands and functional involvement in nervous system structures–a short review. Pharmacol Biochem Behav. 2008;90(4):501–511. doi: 10.1016/j.pbb.2008.05.010.
- Kabakchieva P, Gateva A, Hristova J, et al. Analysis of 2-Arachidonoylglycerol levels in polycystic ovary syndrome in the context of hormonal and metabolic alterations and across the classical phenotypes. Cannabis Cannabinoid Res. 2023;8(4):634–641. doi: 10.1089/CAN.2021.0183.
- Juan, CC, Chen, KH, Wang, PH, et al. Endocannabinoid system activation may be associated with insulin resistance in women with polycystic ovary syndrome. Fertility Sterility. 2015;104(1):200–206. doi: 10.1016/j.fertnstert.2015.03.027.
- Ye W, Xie T, Song Y, et al. The role of androgen and its related signals in PCOS. J Cell Mol Med. 2021;25(4):1825–1837. doi: 10.1111/JCMM.16205.
- Montgomery MK, Turner N. Mitochondrial dysfunction and insulin resistance: an update. Endocr Connect. 2015;4(1):R1–R15. doi: 10.1530/EC-14-0092.
- Bermúdez-Silva FJ, Suárez J, Baixeras E, et al. Presence of functional cannabinoid receptors in human endocrine pancreas. Diabetologia. 2008;51(3):476–487. doi: 10.1007/s00125-007-0890-y.
- Ntambi JM. Hepatic de novo lipogenesis and regulation of metabolism. Cham: Springer; 2016. doi: 10.1007/978-3-319-25065-6.
- Pennings N, Jaber J, Ahiawodzi P. Ten-year weight gain is associated with elevated fasting insulin levels and precedes glucose elevation. Diabetes Metab Res Rev. 2018;34(4):e2986. doi: 10.1002/dmrr.2986.
- Sathyapalan T, Dakroury Y, Ahmed L, et al. Endocannabinoid receptor blockade increases hepatocyte growth factor and reduces insulin levels in obese women with polycystic ovary syndrome. Clin Endocrinol (Oxf). 2016;85(4):671–673. doi: 10.1111/cen.13120.
- Su Y, Tian Z, Qi X, et al. Effects of increasing intake of soybean oil on synthesis of testosterone in leydig cells. Nutr Metab (Lond). 2021;18(1):53. doi: 10.1186/s12986-021-00580-1.
- Zhang B, Shen S, Gu T, et al. Increased circulating conjugated primary bile acids are associated with hyperandrogenism in women with polycystic ovary syndrome. J Steroid Biochem Mol Biol. 2019;189:171–175. doi: 10.1016/j.jsbmb.2019.03.005.
- Makishima M, Okamoto AY, Repa JJ, et al. Identification of nuclear receptor for bile acid. Science. 1999;284(5418):1362–1365. doi: 10.1126/science.284.5418.1362.
- Catalano S, Malivindi R, Giordano C, et al. Farnesoid X receptor, through the binding with steroidogenic factor 1-responsive element, inhibits aromatase expression in tumor leydig cells. J Biol Chem. 2010;285(8):5581–5593. doi: 10.1074/jbc.M109.052670.
- Smith Laura P, Nierstenhoefer M, Yoo SW, et al. The bile acid synthesis pathway is present and functional in the human ovary. PLoS One. 2009;4(10):e7333. doi: 10.1371/journal.pone.0007333.
- Han S, Chiang JYL. Mechanism of vitamin D receptor inhibition of cholesterol 7alpha-hydroxylase gene transcription in human hepatocytes. Drug Metab Dispos. 2009;37(3):469–478. doi: 10.1124/dmd.108.025155.
- Azhary JMK, Harada M, Kunitomi C, et al. Androgens increase accumulation of advanced glycation end products in granulosa cells by activating ER stress in PCOS. Endocrinology. 2020;161(2). doi: 10.1124/dmd.108.025155.
- Darabi M, Lhomme M, Dahik VD, et al. Phosphatidylserine enhances anti-inflammatory effects of reconstituted HDL in macrophages via distinct intracellular pathways. Faseb J. 2022;36(5):e22274. doi: 10.1096/FJ.201800810R.
- Osibogun O, Ogunmoroti O, Michos ED. Polycystic ovary syndrome and cardiometabolic risk: opportunities for cardiovascular disease prevention. Trends Cardiovasc Med. 2020;30(7):399–404. doi: 10.1016/j.tcm.2019.08.010.
- Ye H, Liu XJ, Hui Y, et al. Downregulation of MicroRNA-222 reduces insulin resistance in rats with polycystic ovary syndrome by inhibiting activation of the MAPK/ERK pathway via Pten. Mol Ther Nucleic Acids. 2020;22:733–741. doi: 10.1016/j.omtn.2020.07.014.
- Jobgen W, Meininger CJ, Jobgen SC, et al. Dietary l-arginine supplementation reduces white fat gain and enhances skeletal muscle and brown fat masses in diet-induced obese rats 1-3. J Nutrition. 2009;139(2):230–237. doi: 10.3945/jn.108.096362.
- Kujawska-Łuczak M, Suliburska J, Markuszewski L, et al. The effect of L-arginine and ascorbic acid on the visceral fat and the concentrations of metalloproteinases 2 and 9 in high-fat-diet rats. Endokrynol Pol. 2015;66(6):526–532. doi: 10.5603/EP.2015.0065.
- Bu S, Xia G, Yong T, et al. Dual effects of nitric oxide on meiotic maturation of mouse cumulus cell-enclosed oocytes in vitro. Mol Cell Endocrinol. 2003;207(1–2):21–30. doi: 10.1016/S0303-7207(03)00213-2.
- Hilali N, Vural M, Camuzcuoglu H, et al. Increased prolidase activity and oxidative stress in PCOS. Clin Endocrinol (Oxf). 2013;79(1):105–110. doi: 10.1111/cen.12110.