
Abstract
Objective
To comprehensively assess the dose-response association between dietary glycemic index (GI) and glycemic load (GL) and gestational diabetes mellitus (GDM) risk.
Methods
PubMed, Embase, Cochrane Library, Web of Science, CNKI, WanFang, and VIP databases were searched up to May 29, 2024. Studies with at least three exposure categories were included. Dose-response analysis was also performed when covariates were adjusted in the included studies.
Results
Thirteen studies involving 39,720 pregnant women were included. A linear relationship was found between GI and the risk of GDM (χ2 = 4.77, Pnon-linearity = .0923). However, association was not significant (χ2 = 0.06, p = .8000). For every unit increase in GI (range 0–30), GDM risk increased by 0.29%. After adjusting for covariates, the linear relationship persisted (χ2 = 4.95, Pnon-linearity = .084) with no significant association (χ2 = 0.08, p = .7775). For GL, a linear relationship was also found (χ2 = 4.17, Pnon-linearity =.1245), but GL was not significantly associated with GDM risk (χ2 = 2.63, p = .1049). The risk of GDM increased by 0.63% per unit increase in GL. After covariate adjustment, a significant association was observed (χ2 = 6.28, p = .0122).
Conclusion
No significant association between GI and GDM risk was found. After adjusting for covariates, GL shows a significant association with GDM risk. Our findings emphasize the importance of considering dietary GL in managing the risk of GDM. Future research should continue to explore these relationships with standardized diagnostic criteria and robust adjustment for potential confounders.
Introduction
Gestational diabetes mellitus (GDM) is the most common metabolic disorder during pregnancy, characterized by a transient form of diabetes caused by insulin resistance and pancreatic β-cell dysfunction [Citation1,Citation2]. The incidence of GDM is rising, leading to serious pregnancy complications and adversely affecting maternal and child health [Citation3,Citation4]. About 9 to 25% of pregnancies worldwide are influenced by the acute, long-term, and intergenerational complications of GDM [Citation2]. The etiology of GDM is complex [Citation5]. Primary risk factors include maternal overweight and obesity, advanced childbearing age, race, and a history of previous GDM [Citation6].
Diet, a modifiable factor, has also been identified as being associated with the risk of GDM [Citation7, Citation8]. Dong et al. [Citation9] reported that a low-carbohydrate dietary pattern, characterized by high animal fat and protein intake during the first trimester, is associated with an increased risk of GDM in Chinese women. A similar association was identified by Bao et al. [Citation10]. The quantity and quality of carbohydrates are important dietary factors potentially associated with the risk of GDM [Citation11]. The glycemic index (GI) is a relative measure of the glycemic effect of carbohydrate food [Citation12]. Glycemic load (GL) considers both quantity and quality (GI) of dietary carbohydrates [Citation13]. A study has shown that women in the highest tertile of dietary GI or GL have a greater risk of GDM than those in the lowest tertile [Citation14]. Aminianfar et al. [Citation15] reported that the highest dietary GL was associated with a higher risk of GDM, while no significant association was observed between dietary GI and GDM. Another study found that neither GI nor GL were significantly related to the risk of GDM [Citation16]. Given these inconsistent findings, a comprehensive evaluation of the relationship between GI, GL, and GDM is necessary to improve risk management strategies for GDM. Additionally, several meta-analyses have investigated the dose-response relationship between dietary GI and GL and the risk of type 2 diabetes [Citation17–19]. Dose-response meta-analysis utilizes more available data and allows for the assessment of relative risks (RRs) per unit increment of exposure [Citation17].
Therefore, the aim of this systematic review and dose-response meta-analysis was to comprehensively assess the dose-response association between dietary GI, GL, and the risk of GDM.
Methods
This meta-analysis was performed according to PRISMA guidelines [Citation20].
Search strategy
PubMed, Embase, Cochrane Library, Web of Science, China National Knowledge Infrastructure (CNKI), WanFang (Chinese database), and VIP (Chinese database) were systematically searched by two independent investigators (HR Feng, XF Li) from the inception of the databases to May 29, 2024. Any disagreements were resolved through discussion between the investigators. The following English keywords were used: “glycemic Index” OR “glycemic indices” OR “glycaemic index” OR “glycaemic indices” OR “low GI” OR “glycemic load” OR “glycaemic load” OR “low GL” OR “glycemia” OR “blood sugar” AND “gestational diabetes” OR “GDM” OR “diabetes, gestational” OR “gestation* diabet*” OR “pregnancy-induced diabetes” OR “diabetes, pregnancy-induced” OR “pregnan* diabet*”.
Inclusion and exclusion criteria
Inclusion criteria were conducted based on the PICOS framework (Population, Intervention, Comparison, Outcome, Study design): (1) Population: studies involving pregnant women; (2) Intervention and Comparison: studies reporting different GI or GL; (3) Outcome: studies with GDM as the outcome; (4) Study Design: cohort studies and case-control studies. If the data from the included studies are incomplete for the analyses, the authors would be contacted for more information to ensure the integrity and comprehensiveness of the meta-analysis.
Exclusion criteria: (1) animal experiments; (2) interventional studies; (3) studies with unqualified groups, such as mixing people with GDM and those with glucose tolerance; (4) case reports, conference abstracts, editorial materials, reviews, protocols, comments, and meta-analyses; (5) non-English and non-Chinese studies.
Data extraction and quality assessment
The extracted data included first author, year of publication, country, study design, sample size (N), GDM case, age (years), gestational week, body mass index (BMI, kg/m2), dietary assessment, GDM assessment, and maximum adjusted covariates. The quality of cohort studies and case-control studies was assessed by the Newcastle-Ottawa scale (NOS). Cohort studies were primarily evaluated from exposed and non-exposed cohort selection, comparability, and outcome; case-control studies were mainly evaluated from case and control selection, comparability, and exposure. The scale had a total score of 9, with 0–3 as poor quality, 4–6 as fair quality, and 7–9 as good quality [Citation21]. Two investigators (Q Chen, RY Shao) independently conducted data extraction and quality assessment, and disagreements were addressed by another investigator (YM Gao).
Statistical analysis
For the dose-response meta-analysis, only studies with at least three exposure categories were included. The mid-point dose was used for the analyses. For intake doses within a closed interval, the mid-point dose was calculated as the mean value of the upper and lower limits. For the highest intake dose that was open-ended, the mid-point dose was calculated by adding the highest reported dose to half the difference between the adjacent categories. For the lowest intake dose that was open-ended, the mid-point dose was calculated by subtracting half the difference between the adjacent categories from the lowest reported dose. The lowest intake of GI and GL in each included study was set as the control group. RRs and 95% confidence intervals (CIs) were calculated for the meta-analysis. The generalized least squares for trend estimation (GLST) proposed by Greenland and Longnecker [Citation22] and Orsini et al. [Citation23] was applied to conduct dose-response analysis. A potential curvilinear relationship was assessed using restricted cubic splines with four knots at fixed percentiles (5%, 35%, 65%, and 95%) of the distribution. For model verification, the χ2 test and a P value for a non-linear relationship (Pnonlinearity) were calculated by testing the null hypothesis that the coefficient of the second spline was equal to zero. If the model verification showed significance (Pnonlinearity < .05), the nonlinear model was adopted first; otherwise, the linear model was employed. The glst command was used to fit and verify the linear trend of the summarized estimation. The effect size (RRs) generated by each additional unit of GI and GL in the included studies was calculated. Dose-response analysis was also performed when covariates were adjusted in the included studies. The xblc command was used to draw dose-response curves [Citation24]. Stata 15.1 (Stata Corporation, College Station, TX, USA) was used for all statistical analyses.
Results
Characteristics of the included studies
After a systematical search, 5,394 studies were retrieved from PubMed, Embase, Cochrane Library, and Web of Science, and 2,830 studies were identified through databases including CNKI, WanFang, and VIP. After removing duplicates, 6,855 records remained. Based on initial screening, 74 full-text articles were screened for eligibility. Based on the inclusion and exclusion criteria, 13 studies [Citation14–16,Citation25–34] of 39,720 pregnant women were included in this study, of which seven were used for quantitative analysis. illustrates the flow chart for identifying, screening, and selecting studies. The year of publication ranged from 2004 to 2022. There were a total of 4,265 GDM cases. The studies originated from various countries, contributing to a diverse dataset: 5 studies from China, 3 from the USA, 1 from Spain, 1 from the Netherlands, 1 from Iran, 1 from Malaysia, and 1 from Australia. The baseline characteristics of the included studies are demonstrated in . Of the eligible studies, 11 were cohort studies, with 8 of fair quality and 3 of high quality (). Additionally, there were 2 case-control studies, with 1 of low quality and 1 of high quality ().
Figure 1. Flow chart of study selection.
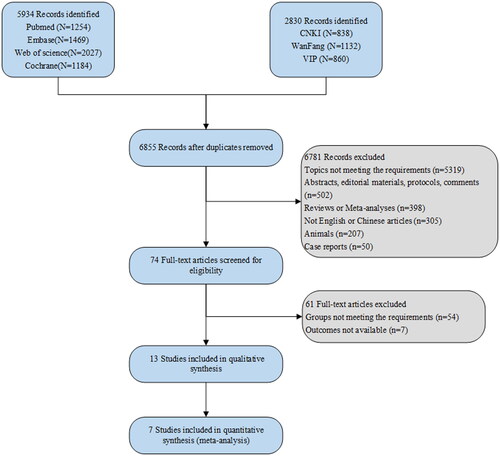
Table 1. Baseline characteristics of the included studies.
Table 2. Newcastle-Ottawa Quality assessment scale for cohort studies.
Table 3. Newcastle-Ottawa Quality assessment scale for case-control studies.
Association between GI and the risk of GDM
Meta-analysis of the dose-response association between GI and the risk of GDM
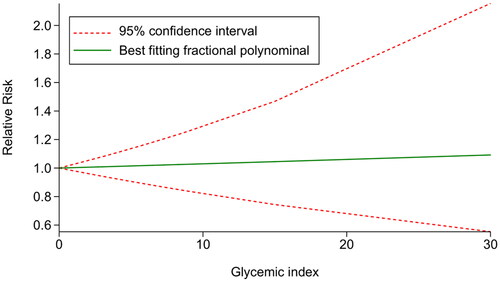
Five studies [Citation15,Citation16,Citation25–27] were included to examine the dose-response association between GI and the risk of GDM. The results indicated a linear relationship between GI and the risk of GDM (χ2 = 4.77, Pnonlinearity = .0923. Further validation was conducted using the glst command to fit the linear model, which confirmed that there was no statistically significant relationship between GI and the risk of developing GDM (χ2 = 0.06, p = .8000). The results indicated that after centralizing the data, within the GI range of 0–30, each unit increase in GI was associated with a 0.29% increase in the risk of GDM ().
Figure 2. Dose-response association between GI and the risk of GDM GI, glycemic index.
Meta-analysis of the dose-response association between GI and the risk of GDM after covariates adjustment
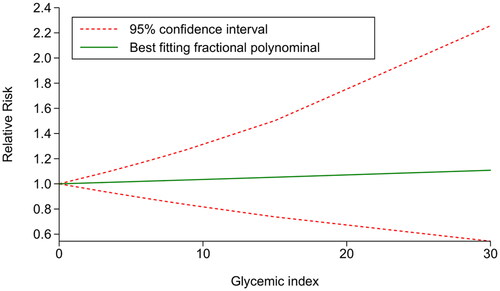
Three studies [Citation15,Citation25,Citation26] were included to further investigate the dose-response association between GI and the risk of GDM after covariates adjustment. The results suggested a linear relationship between GI and GDM risk (χ2 = 4.95, Pnonlinearity = .084). Subsequently, the glst command was employed to fit and validate the linear model, reporting that there was no statistically significant relationship between GI and the risk of developing GDM (χ2 = 0.08, p = .7775). Furthermore, the results demonstrated that after centralizing the data, within the GI range of 0–30, each unit increase in GI was associated with a 0.34% increase in the risk of GDM ().
Figure 3. Dose-response association between GI and the risk of GDM after covariate adjustment GI, glycemic index.
Meta-analysis of the dose-response association between GI and the risk of GDM excluding self-reported GDM studies
After excluding studies with self-reported GDM, four studies were analyzed to assess the relationship between the GI of the diet and the risk of developing GDM. The testparm command was employed to check for a nonlinear relationship between GI and GDM risk. The results showed a χ2 value of 2.05 with a p-value of .3591, indicating a linear relationship between GI and GDM risk. Further analysis using the glst command to fit the linear model resulted in a χ2 value of 0.86 with a p-value of .3529, suggesting no statistically significant association between GI and GDM risk. Additionally, the data, after centralization, revealed that within the GI range of 0–30, each unit increase in GI was associated with a 1.31% decrease in the risk of GDM.
Systematic review of the association between GI and the risk of GDM
A study by Fernández-González et al. [Citation31] showed that the risk of GDM in women with the lowest GI tertile was lower [odds ratio (OR) = 0.80, 95% CI: 0.53–1.20]. According to the study of Zhang et al. [Citation14], higher dietary GI levels before pregnancy, during the 1st trimester, and during the 2nd trimester were associated with increased risks for GDM. Participants in the highest GI tertiles before pregnancy, in the 1st trimester, or in the 2nd trimester had approximately 12% (hazard ratio [HR] = 1.12, 95% CI: 1.03–1.19), 25% (HR = 1.25, 95% CI: 1.20–1.33), and 29% (HR = 1.29, 95% CI: 1.21-1.48) higher risk of GDM, respectively, compared to those in the lowest GI tertiles. The study by Scholl et al. [Citation34] demonstrated that levels of glycosylated hemoglobin and maternal plasma glucose 1 h after a 50-g glucose load increased with every unit increase in dietary GI. Using coefficients from the regression equations, they calculated expected levels of plasma glucose and glycosylated hemoglobin for gravidae in the lowest and highest quintiles of dietary GI. The computations suggested that those in the lowest quintile would have lower levels of plasma glucose (−4.5 mg/dl, a 4.2% difference) and glycosylated hemoglobin (−0.12%, a 2.2% difference) compared to those in the highest quintile.
Association between GL and the risk of GDM
Meta-analysis of the dose-response association between GL and the risk of GDM
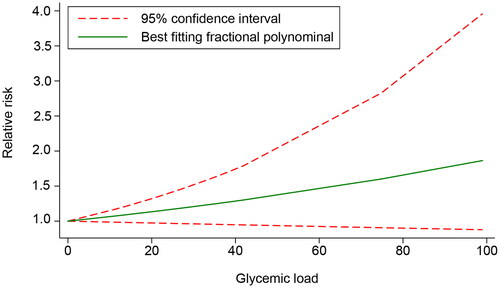
The dose − response relationship of GL and GDM was evaluated in five included studies [Citation15,Citation16,Citation26,Citation28,Citation29]. A linear relationship was found between GL and the risk of GDM (χ2 = 4.17, Pnon-linearity = .1245). However, further validation showed that GL was not significantly associated with the risk of GDM (χ2 = 2.63, p = .1049). The results demonstrated that after centralizing the data, within the GL range of 0–99, each unit increase in GL was associated with a 0.63% increase in the risk of GDM ().
Figure 4. Dose-response association between GL and the risk of GDM GL, glycemic load.
Meta-analysis of the dose-response association between GL and the risk of GDM after covariate adjustment
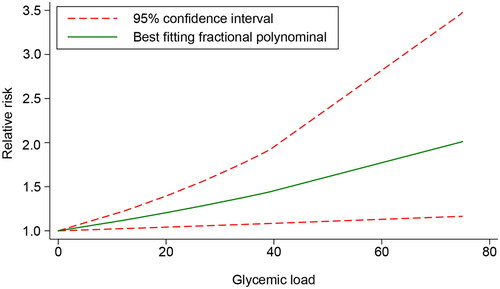
Four studies [Citation15,Citation26,Citation28,Citation29] that adjusted for covariates were included to further investigate the dose-response relationship between the GL and the risk of developing GDM. The results indicated a linear relationship between GL and GDM risk (χ2 = 1.79, Pnonlinearity = .4089). A significant association was also found between GL and the risk of GDM after further validation (χ2 = 6.28, p = .0122). Within the GL range of 0–75, each unit increase in GL was associated with a 0.94% increase in the risk of GDM ().
Figure 5. Dose-response association between GL and the risk of GDM after covariate adjustment GL, glycemic load.
Meta-analysis of the dose-response association between GI and the risk of GDM excluding self-reported GDM studies
After excluding studies with self-reported GDM, three studies were included to investigate the relationship between GL and the risk of developing GDM. Using the testparm command, we tested for a nonlinear relationship between GL and GDM risk. The results indicated a χ2 value of 4.38 with a p-value of .1118, confirming a linear relationship between GL and GDM risk. Further analysis indicated no statistically significant association between GL and GDM risk (χ2 =1.17, p = .280). Additionally, the data, after centralization, revealed that within the GL range of 0–99, each unit increase in GL was associated with a 0.71% increase in the risk of GDM.
Systematic review of the association between GL and the risk of GDM
Zhang et al. [Citation14] reported that a higher dietary GL each before pregnancy, during the 1st trimester, and during the 2nd trimester were associated with increased risks for GDM. Women in the highest GL tertile before pregnancy, in the 1st trimester, or in the 2nd trimester had approximately 15% (HR = 1.15, 95% CI: 1.08–1.23), 23% (HR = 1.23, 95% CI: 1.10–1.45), and 25% (HR = 1.25, 95% CI: 1.11–1.40) higher risk of GDM, respectively, compared to those in the lowest GL tertile. Dong et al. [Citation30] demonstrated that after adjusting for age, pre-pregnancy BMI, and other confounders, the third (RR = 1.47, 95% CI: 1.20–1.80) and highest (RR = 1.31, 95% CI: 1.04–1.64) quartiles of dietary GL were associated with higher risks of GDM compared to the lowest quartile. Specifically, compared with the lowest quartile of GL from staple foods, the third (RR = 1.28, 95% CI: 1.04–1.58) and highest (RR = 1.27, 95% CI: 1.02–1.60) quartiles were associated with elevated risks of GDM. Additionally, the third (RR = 1.30, 95% CI: 1.06–1.59) and highest (RR = 1.28, 95% CI: 1.03–1.59) quartiles of GL from rice groups had greater risks of GDM than the lowest quartile group. Furthermore, the highest quartile of GL from tubers was associated with an increased risk of GDM compared to the lowest quartile (RR = 1.30, 95% CI: 1.09–1.54). No significant association was found between wheat GL and coarse grain GL and the risk of GDM. In the study of Liang et al. [Citation32], GL in the GDM group was significantly higher than that in the normal pregnant group (291.2 ± 106.2 vs. 248.5 ± 102.0, p < .05). Radesky et al. [Citation33] demonstrated that GL of the GDM group was lower than that of the non-GDM group (207.6 ± 36 vs. 211.0 ± 32, p > .05), and no effect of GL on the risk of GDM was observed (OR = 0.96, 95% CI: 0.76–1.22).
Discussion
To the best of our knowledge, this study is the first to comprehensively assess the dose-response association between dietary GI and GL and the risk of GDM. The findings demonstrated non-significant linear relationships between GI and the risk of GDM and between GL and the risk of GDM. Specifically, the risk of GDM increased by 0.29% and 0.63% for every unit increase in GI and GL, respectively. However, after adjusting for covariates, a significant linear association was observed between GL and the risk of GDM: for each unit increase in GL, the risk of GDM rose by 0.94%.
Dietary advice interventions may reduce the risk of GDM, and low- and moderate- to high-GI dietary advice had a comparable effect on the GDM risk, as reported by Tieu et al. [Citation35]. Further, this study showed non-significant linear relationships between GI and GL and the risk of GDM. In the study of Greenwood et al. [Citation18], GI and GL exhibited linear associations with the risk of type 2 diabetes. Livesey et al. [Citation17] showed that the relations of GI and GL to the risk of type 2 diabetes were not log-linear, indicating a curvature in the global dose-response plots, which may be explained by the heterogeneity among studies. Although linear relationships between GI and GL and the risk of GDM were not significant, it was worth noting that the risk of GDM increased by 0.29% and 0.63% for every unit increase in GI and GL, separately, which quantified their relationships.
Dietary GI and GL are indicators of postprandial blood glucose. High dietary GL can raise postprandial blood glucose and insulin needs [Citation36]. Long-term sustained hyperglycemia may lead to the loss of pancreatic B cell function, leading to glucose intolerance and eventually diabetes. Besides, reactive hypoglycemia and the increases of cortisol, glucagon, growth hormone, and other anti-regulatory hormones may facilitate the production of free fatty acids, thus further elevating the risk of diabetes [Citation37]. Based on the pooled analysis of the included studies involving covariate adjustment, we still found a non-significant linear between GI and the risk of GDM, while a significant linear association was observed between GL and the risk of GDM: when GL elevated by one unit, the risk of GDM rose by 0.94%. Of note, not all the included studies adjusted for confounders, which should be improved in future studies.
The clinical significance of our findings, as elucidated in this meta-analysis, lies in the nuanced understanding of the relationship between dietary GI) and GL and the risk of GDM. While a significant association was not established between GI and GDM risk, there was a notable increase in risk with each unit increase in GI, albeit small. This suggests that although GI may not be a primary determinant, it could still contribute to the overall risk profile for GDM. More importantly, the study revealed a significant association between GL and GDM risk after adjusting for covariates. This underscores the importance of GL as a modifiable dietary factor that could be targeted in clinical practice to mitigate the risk of GDM. The finding that an increase in GL is associated with a higher risk of GDM implies that dietary interventions focusing on reducing the GL of consumed foods could be beneficial for pregnant women, particularly those at risk. Our results highlight the necessity for healthcare providers to consider dietary GL in the management of GDM risk. This could involve advising pregnant women on the selection of low GL foods and promoting balanced diets that minimize the intake of high GL foods. Moreover, the findings call for further research to refine the understanding of these relationships, ideally with standardized diagnostic criteria and robust adjustment for potential confounders to ensure the reliability and applicability of the conclusions drawn.
The present study had some limitations. First, there was an inconsistency in the diagnostic criteria for GDM across the included studies. Different studies employed various criteria for diagnosing GDM, which can significantly affect the comparability of the results. This heterogeneity in diagnostic standards introduces variability that can impact the pooled estimates and overall conclusions of our meta-analysis. Second, the number of studies qualified for this analysis is relatively small, which may affect the stability of the results. With a limited number of studies, the pooled data may not fully capture the variability and complexity of the relationship between dietary glycemic index/load and the risk of GDM. Third, there were the inconsistencies in the adjustment for potential confounders across the included studies. In our analysis, we performed both unadjusted and adjusted analyses. For the unadjusted analysis, we pooled the raw data without considering any co-variables. In the adjusted analysis, we included only those studies that adjusted for the aforementioned confounders. This dual approach allowed us to better understand the impact of these variables on the relationship between dietary glycemic index/load and the risk of GDM. Despite these efforts, the heterogeneity in adjustment methods among the studies introduces variability that can affect the robustness of our conclusions. Fourth, language bias may exist since this study only included articles in English and Chinese. This exclusion of studies published in other languages could lead to a selection bias, potentially omitting relevant data and perspectives from non-English and non-Chinese studies.
Conclusion
There were non-significant linear relationships between GI and GL and the risk of GDM: the risk of GDM increased by 0.29% and 0.63% for every unit increase in GI and GL, respectively. However, after adjusting for covariates, a significant linear association was observed between GL and the risk of GDM: for each unit increase in GL, the risk of GDM rose by 0.94%. Further studies are required to support our findings.
Disclosure statement
The authors report there are no competing interests to declare.
Data availability statement
The datasets used and/or analyzed during the current study are available from the corresponding author on reasonable request.
Additional information
Funding
References
- Johns EC, Denison FC, Norman JE, et al. Gestational diabetes mellitus: mechanisms, treatment, and complications. Trends Endocrinol Metab. 2018; 29(11):743–754.
- Alejandro EU, Mamerto TP, Chung G, et al. Gestational diabetes mellitus: a Harbinger of the vicious cycle of diabetes. Int J Mol Sci. 2020;21(14):5003.
- Chiefari E, Arcidiacono B, Foti D, et al. Gestational diabetes mellitus: an updated overview. J Endocrinol Invest. 2017;40(9):899–909.
- Vince K, Perković P, Matijević R. What is known and what remains unresolved regarding gestational diabetes mellitus (GDM). J Perinat Med. 2020;48(8):757–763.
- Mustad VA, Huynh DTT, López-Pedrosa JM, et al. The role of dietary carbohydrates in gestational diabetes. Nutrients. 2020;12(2):385.
- McIntyre HD, Catalano P, Zhang C, et al. Gestational diabetes mellitus. Nat Rev Dis Primers. 2019;5(1):47.
- Zhang C, Rawal S, Chong YS. Risk factors for gestational diabetes: is prevention possible? Diabetologia. 2016;59(7):1385–1390.
- Mijatovic-Vukas J, Capling L, Cheng S, et al. Associations of diet and physical activity with risk for gestational diabetes mellitus: a systematic review and meta-analysis. Nutrients. 2018;10(6):698.
- Dong H, Sun H, Cai C, et al. A low-carbohydrate dietary pattern characterised by high animal fat and protein during the first trimester is associated with an increased risk of gestational diabetes mellitus in Chinese women: a prospective cohort study. Br J Nutr. 2021;126(12):1872–1880.
- Bao W, Bowers K, Tobias DK, et al. Prepregnancy low-carbohydrate dietary pattern and risk of gestational diabetes mellitus: a prospective cohort study. Am J Clin Nutr. 2014;99(6):1378–1384.
- Filardi T, Panimolle F, Crescioli C, et al. Gestational diabetes mellitus: the impact of carbohydrate quality in diet. Nutrients. 2019;11(7):1549.
- Brouns F, Bjorck I, Frayn KN, et al. Glycaemic index methodology. Nutr Res Rev. 2005;18(1):145–171.
- Finley CE, Barlow CE, Halton TL, et al. Glycemic index, glycemic load, and prevalence of the metabolic syndrome in the cooper center longitudinal study. J Am Diet Assoc. 2010;110(12):1820–1829.
- Zhang X, Gong Y, Della Corte K, et al. Relevance of dietary glycemic index, glycemic load and fiber intake before and during pregnancy for the risk of gestational diabetes mellitus and maternal glucose homeostasis. Clin Nutr. 2021;40(5):2791–2799.
- Aminianfar A, Soltani S, Hajianfar H, et al. The association between dietary glycemic index and load and risk of gestational diabetes mellitus: a prospective study. Diabetes Res Clin Pract. 2020;170:108469.
- Hasbullah FY, Mohd Yusof BN, Shariff ZM, et al. Factors associated with dietary glycemic index and glycemic load in pregnant women and risk for gestational diabetes mellitus. Int J Food Sci Nutr. 2020;71(4):516–524.
- Livesey G, Taylor R, Livesey HF, et al. Dietary Glycemic Index and load and the risk of type 2 diabetes: a systematic review and updated meta-analyses of prospective cohort studies. Nutrients. 2019;11(6):1280.
- Greenwood DC, Threapleton DE, Evans CE, et al. Glycemic index, glycemic load, carbohydrates, and type 2 diabetes: systematic review and dose-response meta-analysis of prospective studies. Diabetes Care. 2013;36(12):4166–4171.
- Livesey G, Taylor R, Livesey H, et al. Is there a dose-response relation of dietary glycemic load to risk of type 2 diabetes? Meta-analysis of prospective cohort studies. Am J Clin Nutr. 2013;97(3):584–596.
- Moher D, Liberati A, Tetzlaff J, et al. Preferred reporting items for systematic reviews and meta-analyses: the PRISMA statement. Int J Surg. 2010;8(5):336–341.
- Wells GA, Shea BJ, O'Connell D, et al. The Newcastle–Ottawa Scale (NOS) for assessing the quality of non-randomized studies in meta-analysis; 2000.
- Greenland S, Longnecker MP. Methods for trend estimation from summarized dose-response data, with applications to meta-analysis. Am J Epidemiol. 1992;135(11):1301–1309.
- Orsini N, Bellocco R, Greenland S. Generalized least squares for trend estimation of summarized dose–response data. Stata J. 2006;6(1):40–57. doi: 10.1177/1536867X0600600103.
- Luo ML, Lin XJ, Liu RC, et al. Realizing the dose response meta analysis in Stata Software. J Evid Based Med. 2014;14(3):6.
- He W, Wang L, Zhang Y, et al. Higher serum bilirubin levels in response to higher carbohydrate intake during early pregnancy and lower gestational diabetes mellitus occurrence in overweight and obese gravidae. Front Nutr. 2021;8:701422.
- Looman M, Schoenaker D, Soedamah-Muthu SS, et al. Pre-pregnancy dietary carbohydrate quantity and quality, and risk of developing gestational diabetes: the Australian Longitudinal Study on Women’s Health. Br J Nutr. 2018;120(4):435–444.
- Wahab RJ, Scholing JM, Gaillard R. Maternal early pregnancy dietary glycemic index and load, fetal growth, and the risk of adverse birth outcomes. Eur J Nutr. 2021;60(3):1301–1311.
- Xu Q, Tao Y, Zhang Y, et al. Dietary fiber intake, dietary glycemic load, and the risk of gestational diabetes mellitus during the second trimester: a nested case-control study. Asia Pac J Clin Nutr. 2021;30(3):477–486. doi: 10.6133/apjcn.202109_30(3).0014.
- Zhang C, Liu S, Solomon CG, et al. Dietary fiber intake, dietary glycemic load, and the risk for gestational diabetes mellitus. Diabetes Care. 2006;29(10):2223–2230.
- Dong HL, Cai CJ, Bai D, et al. Association between dietary glycemic load during first trimester and the risk of gestational diabetes mellitus: a prospective study. Chin J Epidemiol. 2020;41(8):7.
- Fernández-González E, Martínez-González M, Bes-Rastrollo M, et al. Association between pre-conceptional carbohydrate quality index and the incidence of gestational diabetes: the SUN cohort study. Br J Nutr. 2022;129(4):1–11.
- Liang WH, Liang YY. Impacts of dietary carbohydrates and glycemic load on incidence of gestational diabetes mellitus. Acad J Guangzhou Med Coll. 2010;(2):4:38.
- Radesky JS, Oken E, Rifas-Shiman SL, et al. Diet during early pregnancy and development of gestational diabetes. Paediatr Perinat Epidemiol. 2008;22(1):47–59.
- Scholl TO, Chen X, Khoo CS, et al. The dietary glycemic index during pregnancy: influence on infant birth weight, fetal growth, and biomarkers of carbohydrate metabolism. Am J Epidemiol. 2004;159(5):467–474.
- Tieu J, Shepherd E, Middleton P, et al. Dietary advice interventions in pregnancy for preventing gestational diabetes mellitus. Cochrane Database Syst Rev. 2017;1(1):Cd006674.
- Riccardi G, Rivellese AA, Giacco R. Role of glycemic index and glycemic load in the healthy state, in prediabetes, and in diabetes. Am J Clin Nutr. 2008;87(1):269s–274s.
- Willett W, Manson J, Liu S. Glycemic index, glycemic load, and risk of type 2 diabetes. Am J Clin Nutr. 2002;76(1):274s–280s.