
 ?Mathematical formulae have been encoded as MathML and are displayed in this HTML version using MathJax in order to improve their display. Uncheck the box to turn MathJax off. This feature requires Javascript. Click on a formula to zoom.
Abstract
Automatic click detectors and full-bandwidth sound recorders are widely used in passive acoustic monitoring of small cetaceans. Detection of these signals depends on a variety of factors, including signal to noise ratio. Passive acoustic monitoring is often used to study impact of underwater noise on small cetaceans, but as detection probability is affected by changes in signal to noise ratio, variable noise levels may affect conclusions drawn from these experiments. Therefore, we examine how different detectors and filters perform in varying ocean noise conditions. C-PODs and full-bandwidth recorders (Wildlife Acoustics, SM2M+) were deployed at two stations in an environment with fluctuating ambient noise for 42 days. Noise level and harbour porpoise (Phocoena phocoena) click trains simultaneously recorded on both loggers were compared. Overall, we found that porpoise click detections by the algorithm used to analyse full-band recorder data (Pamguard) paralleled detections by the C-POD. However, Pamguard detected significantly more clicks than the C-POD. A decrease in detections was seen for both loggers with increasing noise in the band 20 –160 kHz, in particular for levels above 100 dB re 1μPa rms. We also found that the Pamguard detection function changed the least over varying noise conditions when compared to the C-POD detectors. This study sheds light on the fact that inference of animal presence/absence or density that are based on echolocation cues (here, Porpoise Positive Minutes) shall account for the acoustic environments where probability of detecting signals may be affected by variability in ambient noise levels.
Introduction
Passive acoustic monitoring (PAM) is a fast developing technology used for studying cetacean distribution, abundance and behaviour (Gillespie and Chappell Citation2002; Carstensen et al. Citation2006; Verfuß et al. Citation2007; Kyhn et al. Citation2012; Sousa-Lima et al. Citation2013). PAM is a cost-effective method that can operate over long periods of time, independent of light conditions and under most environmental conditions (Mellinger and Barlow Citation2003). Although these benefits are advantageous, PAM instruments have various limitations as well. It is, therefore, important to consider a number of factors before choosing the most suitable instrument for a study, including target frequency band, sensitivity, dynamic range, deployment duration, robustness/durability, deployment depth, cost and recovery method.
Full-bandwidth recorders allow for detailed data analyses of the actual recorded signal, but they are often expensive and have shorter recording durations (due to the demand for more batteries and memory space) compared to most click detectors (Sousa-Lima et al. Citation2013). Moreover, post-recovery data analysis of full-bandwidth recordings is more time-consuming and computationally intensive than data from real-time click detector data. Therefore, click detectors are often preferred for long-term, multi-station monitoring projects. Click detectors only record sound whenever certain detection criteria are fulfilled, typically a minimum sound level within a target frequency band, perhaps coupled with comparison against one or more frequency bands used as proxies for background noise. Some click detectors record the entire waveform of the clicks for subsequent off-line analysis, whereas others, most notably the C-POD, performs extensive real-time analysis and stores only a limited number of parameters extracted from the waveform, which limits the memory usage and allows for very long deployment periods, even in areas with high density of animals.
One of the ultimate goals in PAM is to estimate the density of the target species. Density can be derived from PAM data in several ways, as reviewed by Marques et al. (Citation2013). For small narrow-band high-frequency odontocetes, such as the harbour porpoise Phocoena phocoena, the current best method relies on distance sampling of cue counts, where each click detection is recorded as a cue. The estimate of the density D, at the location of the PAM recorder is then given by
Where n is the number of detected clicks, f is the false alarm rate (i.e. percentage of all detections that are not from porpoises), p is the probability of detecting a click emitted by an animal within the maximal detection distance ω from the recorder, T is the recording time and r is the cue rate, i.e. the average clicking rate of wild porpoises. The cue rate cannot be derived from the PAM data, but must be determined by other, independent methods and is not addressed here (see Marques et al. Citation2009; Kyhn et al. Citation2012).
Any detection process, no matter whether it is automatic or performed by human observers, is prone to errors. Two types of errors are possible in a simple detection: false negatives, i.e. true signals missed by the detector and false positives, i.e. detections due to other sounds than from the target species or simply random noise. This is completely analogous to type I and type II errors in statistics. False negatives, also referred to as ‘misses’, are included in Equation 1 through the average detection probability, p (equal to 1 minus the miss-rate) whereas the false negatives, also referred to as false alarms, are included as a separate parameter f, the false alarm rate. Obtaining a reliable estimate of animal density from PAM data thus requires that these parameters can be adequately described and equally important that their dependence on external factors, such as ambient noise, is known.
Ultimately, all detection processes are limited by noise in the input. Detecting odontocete clicks in acoustic recordings is no different. Detection performance is thus always a balance between errors. One can obtain very high detection probabilities by means of a very low detection threshold, but this will always be at the expense of an increase in the false alarm rate. A useful detector is thus not just a very sensitive detector (i.e. with a low detection threshold under quiet conditions), but a detector, where there is a suitable trade-off between misses (high sensitivity) and false alarms (high selectivity). Furthermore, the influence of changes in ambient noise must also be known. For a detector with a fixed threshold an increase in ambient noise will inevitably lead to an increase in false alarm rates, whereas the effect on the miss-rate is less predictable. The miss-rate may increase, remain largely unaffected, or it may even in special cases decrease with increasing noise, due to a process known as dithering where the increased noise helps ‘lift’ very weak subthreshold signals above the detection threshold. Other detectors employ an adaptive threshold, where the threshold is adjusted relative to some measure of the ambient noise. The objective of an adaptive threshold is to maintain an optimal ratio between the two errors, irrespective of the noise level.
Despite the fact that PAM devices are commonly used in environments, that are not only noisy, but also with very variable noise (due to weather, shipping, other animals etc.), limited attention has been given to the influence of ambient noise on the ability of these devices to detect cetaceans in noisy environments (Roberts and Read Citation2014; Sarnocinska et al. Citation2016). The aim of this study is to assess the impact of ambient noise on the performance of two different PAM devices and different harbour porpoise click train detection algorithms.
Materials and methods
Study site
This study was carried out as part of a larger study near the largest Danish North Sea oil and gas offshore production platform. It is located 200 km west of Denmark with an approximate water depth of 43 m. The most common cetacean in this area is the harbour porpoise and they are frequently observed from the production platforms (Delefosse et al. Citation2017). In order to study the impact of ambient noise on the performance of porpoise detection by two different PAM devices, we monitored harbour porpoise echolocation activity and recorded ambient noise at two different stations: directly under the platform and 800 m from the noisiest section of the platform.
Deployment and equipment
Acoustic releasers (SubSeaSonics, AR-60-E) without surface marker were used under the platform, whereas a surface buoy system composed of a plastic covered anchor chain tied together with rope, to reduce noise, was used at 800 m.
At both stations harbour porpoise clicks and ambient noise were recorded by means of click detectors (C-PODs, Chelonia Ltd, Penzance, UK) and full-bandwidth recorders (SM2M+, Wildlife Acoustics, Boston, USA). A total of three calibrated C-PODs and three calibrated SM2M+ were used in this study. SM2M+ were placed with the hydrophone two metres above seafloor and C-POD placed with the hydrophone three metres above seafloor. Data were collected for a total of 42 days, during two deployment events in summer 2013 and spring 2014.
Detectors and filters
The C-POD is one of the most widely used PAM devices for logging small cetacean echolocation signals. C-PODs detect narrow-band clicks within the range 20–160 kHz, but only store a time stamp, duration, amplitude and additional parameters derived from the click waveform through an analysis of zero-crossings in the signal. By this real-time analysis the C-POD saves memory, which allows up to six months of continuous data logging; however, a drawback of this device is that the raw sound recording cannot be examined later for additional offline analysis of the clicks. The click parameters are subsequently used offline as inputs for post-processing of train detection and classification.
The offline analysis has pre-defined algorithms with some flexibility in the detection criteria (e.g. Dähne et al. Citation2013; Roberts and Read Citation2014; Jaramillo-Legorreta et al. Citation2017). A build-in classifier, KERNO, groups clicks into click trains and assigns trains to different signal classes: ‘NBHF’ (Narrow Band High Frequency click producing species), ‘Other cetaceans’, ‘Boat sonars’ and ‘unclassified’. This classification is based on parameters such as average instantaneous frequency, click duration and variation in inter-click intervals. Within each signal class the trains are assigned to one of four quality categories: high (‘Hi’), moderate (‘Mod’), low (‘Lo’) and doubtful (‘?’). The quality classes express the likelihood of a true detection, which means that both the miss and false alarm rates are expected to increase as one moves to lower likelihood categories (Tregenza Citation2014). A complete description of the classification algorithm is not available, but it is known that the algorithm searches for specific click parameters (dominant frequency, final zero-crossing interval, peak-to-peak amplitude, index of click bandwidth, time and duration) as well as inter-click intervals within trains.
Full-bandwidth loggers such as the SM2M+ record and store the raw audio signals. It is thereby possible to post-analyse data using a variety of software programs. One such program, Pamguard (Gillespie and Chappell Citation2002), offers a growing number of plug-in modules including a click detector that can be selected and configured by the user (Gillespie et al. Citation2009). The click detector searches for transient sounds and attempts to assign species in accordance to the settings and categorise group clicks into click trains (http://www.pamguard.org/11_PluginModules.html). The SM2M+ unit recorded with a sampling rate of 384 kHz, thereby providing a recording bandwidth of 1 –192 kHz (16 bit resolution).
Calibration
C-PODs and full bandwidth loggers (SM2M+) were calibrated in a circular cedar wood tank (2.8 m x 3 m) at University of Southern Denmark in Kerteminde, Denmark. C-PODs were fixed with the hydrophone pointing downwards and placed 0.5 m below the water surface. Calibration signals were generated by a computer connected to a National Instruments 6251 digital to analogue converter, and transmitted by a projecting transducer (Sonar products HS 150) placed 1 m from the C-POD and at the same depth. Projector sensitivity was measured prior to calibration by placing a reference hydrophone (Reson TC4034) at the position of the C-POD hydrophone.
The calibration signal was played back at four frequencies (115 to 145 kHz in 10 kHz steps). At each frequency the signal consisted of 31 blocks and each block had 10 porpoise-like click signals (13 cycles sine wave signals, raised-cosine envelope). The blocks were sent out with decreasing intensity in 1 dB steps (0 to 30 dB attenuation). The signal was played towards the C-POD at four horizontal angles (0°, 90°, 180°, 270°, by rotation of the C-POD) to determine the horizontal directivity pattern and detection thresholds.
The 50% detection thresholds of the 135 kHz frequency band were calculated for each horizontal angle for all C-PODs. To determine the 50% thresholds all recorded clicks within each block were counted and the lowest level with at least 5 out of 10 clicks recorded was found. The mean detection thresholds of the three C-PODs used in this study were 116, 116 and 117 dB re. 1 μPa pp, respectively.
The three full-bandwidth loggers used for this study were calibrated in the same set-up as the C-PODs. A projecting transducer (Sonar products HS 70 or HS150) was placed at the same depth, 1 m from the logger. Calibration signals (pure tones) were generated by an Agilent 33250A arbitrary wave-form generator and transmitted by the transducer to the logger. HS 70 was used for calibration at frequencies from 20- to 100 kHz whereas HS 150 was used for calibration at frequencies from 110 to 160 kHz. Projector sensitivity was measured prior to calibration by placing a reference hydrophone (Reson TC4014) at the position of the logger hydrophone. The sensitivity of the three full-bandwidth loggers was −165 dB re 1 V/μPa according to the calibration provided by Wildlife Acoustics. The clip level was calibrated in the tank to be 161 dB re 1 μPa rms (± 2 dB) for harbour porpoise clicks (130 kHz). The dynamic range of the SM2M+ is 16 bit (96 dB).
Data analysis – harbour porpoise detection
C-POD’s were set with a high-pass filter at 20 kHz and data were post-processed in CPOD.exe software v2.043 using the standard ‘KERNO’ classifier. Data was analysed using three different filters; two default train filters for narrowband high frequency species (NBHF) ‘HiMod’ and ‘HiModLo’. According to the manufacturer, the difference between these two filters is the detection threshold. ‘HiModLo’ is more sensitive compared to ‘HiMod’ and therefore includes more porpoise click trains, but potentially also more false alarms.
The third filter, ‘PorpFilter’ was manually set in CPOD.exe, with the aim of developing a more sensitive, but also more selective filter, i.e. with lower miss- and false alarm-rates than standard KERNO-filters. The click train filter was set to include clicks trains with a minimum of five clicks and a mean instantaneous frequency between 100 kHz and 160 kHz. The train filter included NBHF and unclassified species of all qualities.
Information about classified clicks was exported from the C-POD software as Porpoise Positive Minutes (PPM) in a binary output; i.e. either no click train or at least one click train (containing at least five clicks) within a given minute.
Data from the full-bandwidth loggers were analysed by two different porpoise click detection algorithms. The first was a custom-made script in Matlab version 2014a designed to detect porpoise clicks in the frequency range of 100–170 kHz named ‘Matlab click detector’. The recordings were filtered by an 80 kHz highpass filter and signals were identified using a simple level detector with a variable threshold. The variable threshold was calculated based on the level of clicks (0.5* the average of levels of the last three clicks). This approach was not specifically designed for porpoise detection and would likely include many artefact signals with characteristics similar to porpoise clicks (false alarms). We assumed that this filter would be the most sensitive and least specific and hence detect all porpoise clicks that were also detected by the other filters examined in this study. Therefore, we only used the Matlab click detector for comparison in a preliminary analysis.
The second detection algorithm was incorporated into PamguardBeta34 (www.pamguard.org). The trigger filter was a 100–160 kHz bandpass filter (4th order IIR Chebyshev). The detector was triggered at 12 dB signal to noise ratio (SNR). The detector included signals, where clicks had a minimum separation of 100 samples (= 260 μs) and a maximum total length of 1024 samples (= 2662 μs). This click detector is referred to as ‘Pamguard filter’.
To make the Pamguard-filter output more comparable with the C-POD data they were also reduced to porpoise positive minutes. A porpoise positive minute was thus defined as containing at least five harbour porpoise clicks detected by Pamguard.
Internal clocks in SM2M+’s and C-POD’s were both synchronised with a GPS-derived time signal and drift was determined after the three-month recording periods. SM2M+’s were 10 and 20 s behind, respectively, while the C-PODs clock drift was limited to milliseconds. During verification of individual clicks the C-POD data was compared assuming a linear drift in time for the SM2M+.
Visual comparison of filter performance – subset of data
A subset of the data was selected and all porpoise positive minutes detected by the Matlab click detector was identified (883 positive minutes out of 2880 recorded minutes). From this data, a random selection of 157 porpoise positive minutes was used for a comparison of the performance of the three C-POD filters and the Pamguard filter.
The 157 porpoise positive minutes indicated by the Matlab click detector were inspected visually in CPOD.exe v2.043. A click train was classified as a positive porpoise detection if the following criteria were met; at least five clicks with centre frequency between 127–140 kHz, click duration often longer than 15 cycles, amplitude lower than 255 (unitless AD-converter amplitude) and gradually changing inter-click-interval (ICI) with initial rise and final fall and maximum ICI around 250 ms, train quality (high, mid, low, doubtful).The full bandwidth recordings of the 157 porpoise positive minutes were also inspected visually in Pamguard and Adobe Audition. A click was scored as positive porpoise detection if the following criteria were met; peak frequency between 120 kHz and 150 kHz, click duration at least 10 cycles, and only one peak centred around 130 kHz in the spectrum with minimal energy in lower frequency bands. If five clicks within a minute were detected according to these criteria, the minute was classified as a porpoise positive minute.
Assuming the very unselective Matlab detector captured all true porpoise positive minutes also detected by the other detectors, the 157 positive minutes detected by the Matlab detector can be used as standard for a comparison of the performance of the other detectors. For any of the other detectors a minute was classified as a Hit (true positive) if the detector scored the minute as positive and it was confirmed by visual inspection that it contained likely porpoise clicks. If the detected click train was rejected as a likely porpoise click train by visual inspection, it was classified as ‘False alarm’. If the Matlab detector recorded a click train but this was not detected by the click train algorithm, it was classified as ‘Miss’ (false negative). If there were no click trains found by either a porpoise click train algorithm or the visual inspection, it was classified as ‘Correct rejection’ (true negative).
Comparison of filter performance – whole data-set
To compare the detection performance of the three C-POD filters we compared the results from individual C-POD filters with results from the Pamguard filter, minute by minute in the whole data-set (42 days). In this way, the Pamguard output is regarded as the standard, to which the other detectors are compared. For any of the three C-POD filter, a recording minute was thus classified as a Hit if both the C-POD filter and Pamguard scored it as positive and similarly as a correct rejection if neither the C-POD filter, nor Pamguard scored the minute as positive. A minute was classified as a Miss, if the Pamguard filter scored positive and the C-POD filter scored negative and lastly classified as a false alarm if the C-POD filter scored positive, but the Pamguard detector did not.
We investigated the possible effect of ambient noise on harbour porpoise click train detections by analysing: 1) the probability of porpoise detections by the different filters in relation to the noise level and 2) the performance of the three C-POD filters’ ability to register porpoise positive minutes (PPM) at different noise levels in relation to the Pamguard filter. This was done in order to determine if the click train filters differed in their detection ability with increasing ambient noise levels.
Data analysis – noise
Background noise was assessed in both C-PODs and full bandwidth recordings. C-PODs only record summary statistics of click signals and provides no direct measure of the noise level. However, the real-time click detection algorithm is not very selective and will record a large number of short click-like events. The total number of these unfiltered clicks is provided from the off-line analysis as the parameter Nall and is given for each recording minute. Prior to deployment, a maximum value of Nall was set to 4095 clicks per minute to avoid memory overload: no further recordings were made in a minute after reaching 4095 clicks. Due to this truncation, minutes with Nall = 4095 were excluded from the analysis, as they were considered saturated and incomplete. Nall values less than 4095 were assumed to be related to ambient noise conditions and thus used as a proxy for noise, later to be compared with actual noise levels derived from the full-bandwidth recordings at frequencies between 20 kHz and 160 kHz.
Actual noise levels were derived from the full bandwidth recordings by a custom-written routine in Matlab 2014a. Recordings were subdivided into 10-s segments, analysed individually. An initial inspection of the recordings revealed artefacts, most likely resulting from errors in the operating system of the recorders, where chunks of 256 random samples were inserted into the recordings with random intervals. These inserts gave rise to broad-band clicks at their abrupt onsets and off-sets. To identify such artefacts, data were processed with two click detecting routines operating in different frequency bands. The first routine was designed to localise clicks of porpoises, as described above. The second routine analysed the recordings in the frequency band of 55–90 kHz and used a constant threshold chosen during visual inspection of the waveforms to exceed the background noise level and detect individual artefact series. The outputs of the two detectors were compared, and clicks with significant energy in both frequency bands were classified as artefacts. Segments containing artefacts were excluded in further analyses. Up to 10 segments per 46-min long data file were removed in this way.
Noise level (L eq) was computed as the equivalent continuous sound pressure level (rms-average) in 1-min blocks:
where p is the sampled instantaneous sound pressure, p 0 is the reference sound pressure (1 μPa), and sr is the sample rate. As the C-POD has a high-pass filter at 20 kHz, only noise above 20 kHz was included in the L eq derived from the SM2M+. Hence, high frequency noise in the band 20–160 kHz was computed minute by minute in 1 dB intervals.
The characteristics of the noise recorded at the two stations were analysed in R version 3.2.2. The 5th, 25th, 50th, 75th and 95th percentile was calculated to illustrate the variance of the noise in the full recorded frequency span.
Results
Comparison of filter performance – subset of data
From the subset of data chosen for visual validation, 102 out of 157 min scored positive by the Matlab filter were deemed by visual inspection to be true porpoise positive minutes. The Pamguard filter positively detected 97% of these 102 min, the PorpFilter 75%, and the two default filters HiModLo and HiMod detected 56% and 51% of the 102 positive minutes, respectively. Due to the high proportion of correct detections, the Pamguard filter was chosen as the reference detection filter for subsequent comparisons, covering the entire data-set.
Comparison of filter performance – whole data-set
To estimate the ‘Hit’ and ‘False Alarm’ rates, we assumed that the Pamguard filter detected all clicks detected by C-POD filters. This assumption was confirmed posteriori based on the better performance of Pamguard filter during the visual comparison of the subset data above, however, in rare cases, the C-POD filters detected porpoise clicks that Pamguard filter did not (Porp filter 2%, HiMod 1% and HiModLo 2% of the total data-set of 60,478 min).
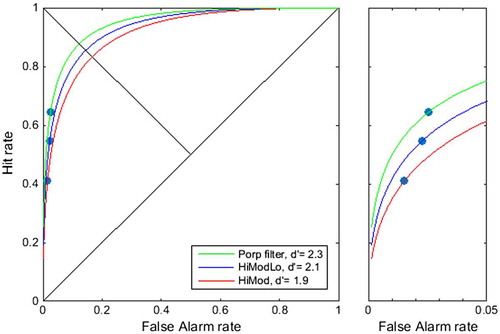
Of the C-POD filters the PorpFilter had the highest hit-rate, but also the highest false alarm rate, whereas the HiMod filter had the lowest hit and false alarm rates of the three (). The false alarm rate was low, however, for all three filters; below 3%.
Figure 1. ROC plot showing the relationship between ‘Hit rate’ and ‘False alarm rate’ of click train detections by the three C-POD filters compared to the Pamguard filter based on the whole data-set (42 days). The figure to the right is zoomed in to show details at false alarm rates below 0.05. Points represent rates calculated from the actual detections. Curves are corresponding iso-detectability curves under the assumption that the underlying distributions are Gaussian and of equal variance. See text for further explanation.
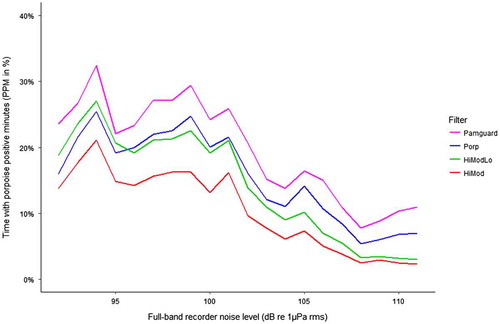
When investigating the possible effect of ambient noise on harbour porpoise click train detections, it was found that the Pamguard filter detected more PPM compared to the three C-POD filters regardless of ambient noise levels (). Of the three C-POD filters, PorpFilter was the filter with the highest detection rate most of the time, except at the lowest noise levels. The difference in detected PPM between the Pamguard filter and the C-POD filters ranged from 5 to 25% (PorpFilter), 3–27% (HiModLo) and 2–21% (HiMod). The correlations between the Pamguard filter and the three C-POD filters were: r2 = 0.99 (PorpFilter), r2 = 0.93 (HiModLow) and r2 = 0.92 (HiMod). There was a decrease in porpoise detections at higher ambient noise levels for all filters ().
Figure 2. Per cent of time where the four filters detected porpoise positive minutes (PPM) under different noise levels based on 42 days of data. Broadband noise levels in the range 20 kHz–160 kHz were grouped in 1 dB intervals.
The ability of C-POD filters to detect porpoise positive click trains decreased with increasing ambient noise level, relative to the Pamguard filter (). The two most commonly used filters in published studies HiMod and HiModLo, had a more pronounced decrease in porpoise detection at noise levels above 101 dB re 1μPa rms, whereas the PorpFilter was more consistent relative to the Pamguard over the ambient noise span (92 to 111 dB re 1μPa rms) (A).
Figure 3. Performance of the three C-POD filters’ ability to register porpoise positive minutes (PPM) at different noise levels relative to what was detected by the Pamguard filter based on 42 days of data. Error bars indicate the 95 % confidence interval. (A) Noise level from full-band recorder; (B) Noise level from C-POD (Nall).
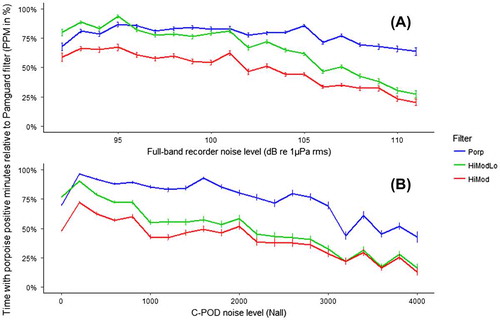
At the highest ambient noise level (111 dB re 1μPa rms) the PorpFilter missed 36% of PPMs compared to Pamguard. In comparison, the two other C-POD filters missed 73 and 80% of the events relative to the Pamguard filter.
There was a steeper decrease in porpoise detections for all C-POD filters relative to the Pamguard filter when Nall was used as an ambient noise index (B). The phenomenon was especially observable when the two default filters decreased at Nall values above 200. At the highest C-POD ambient noise level the PorpFilter missed 57% of the PPM detected by the Pamguard filter, whereas the two default filters missed between 84 and 87% of PPM detected by the Pamguard filter. Overall, the PorpFilter was less affected by noise levels compared to the two other filters at higher noise levels, when Pamguard detections were used as the comparison standard.
There is a negative binomial correlation between noise measured by the full-bandwidth logger and the C-POD (Nall) (), showing that Nall tend to saturate (4095 clicks/min) around 110 dB re 1μPa rms.
Figure 4. Scatter plot showing the relationship between the unfiltered signals recorded on the C-PODs (Nall) and the broadband noise level from full-bandwidth loggers in the frequency range 20 kHz–160 kHz for the whole period. Saturated recordings on the C-PODs with a Nall value of 4095 were excluded from the analysis. There is a negative binomial correlation between the Nall and broad band noise level (p < 0.01 %).
Ambient noise power spectrum density levels were derived from the SM2M+ recordings and shown in . Spectra from the two recording stations were similar overall, but levels slightly higher and peak frequency slightly lower at the station under the platform (0 m) compared to the station 800 m away. The lack of variance in noise levels above 40 kHz suggests that the self-noise of the hydrophone and amplifier dominated over the ambient noise above 40 kHz, especially at 800 m (). We investigated whether self-noise of the full bandwidth loggers were an issue in our recordings as the noise level could potentially be limited at frequencies higher than 40 kHz. Self-noise never exceeded ambient noise levels at frequencies below 40 kHz and only on rare occasions at frequencies above 40 kHz. As the noise level decreased with increasing frequency and noise levels at lower frequencies contributed most to the overall noise level, rms noise level at frequencies below 40 kHz was compared with rms noise level at frequencies from 40 kHz and above. There was a potential effect of self-noise on the total noise level above 20 kHz in less than 3% of the full data-set.
Figure 5. Line plot showing the characteristics of ambient noise recorded at the two stations during the whole period. Ambient noise level is shown as the sound power spectrum density level (dB re 1 µPa2/Hz) at frequencies between 25 Hz and 160 kHz. Percentiles are plotted to illustrate the variance of the noise level (L5, L25, L50, L75 and L95).
Discussion
This study demonstrates the impact of ambient noise level on the performance of different harbour porpoise click detection algorithms. The data were obtained in a noisy environment and showed a decrease in porpoise detections (quantified as PPM) with increasing noise level across two different recording devices and four different detectors/filters. A reduction in porpoise detections with increasing noise is expected for any detector, and must be accounted for in order to obtain unbiased density estimates (Equation 1). The effect of noise on the detection process can be attributed to an increase in the false alarm rate or a decrease in the detection probability (factors f and p in Equation 1). However, the simple effect of noise on the detection process could be confounded with other effects of the noise on the echolocating porpoises. Porpoises could thus react to the noise, either by being more silent or simply swimming away from the noisy area, both of which would lead to a decrease in detections with increasing noise. However, if animals remain silent, this means that the density estimate will be biased, as the cue rate (r in Equation 1) is lowered and the corresponding decrease in estimated density is wrong. On the other hand, if animals move away from the noise, this will only affect the number of detected cues (n in Equation 1) and the decrease in the density estimate will reflect a true reduction in density. If porpoises remain in a noisy area they might also increase the source level of their clicks (the Lombard effect), which would effectively increase detection probability (p) and thus counteract (fully or partly) any effect on the detection process. Understanding the way animals react to the noise is thus equally important as understanding the detection process itself.
Our results from the visual inspection of the data subset showed a large difference between the ability of C-PODs on one hand and full-bandwidth recorders followed by a Pamguard detector on the other hand, in detecting harbour porpoise click trains using the four different filters. Data recorded by full-bandwidth loggers and analysed with the Pamguard filter had the highest correctly scored porpoise positive minutes when validated by visual inspection. This difference between the two systems is in line with other studies (Sarnocinska et al. Citation2016) and to be expected due to the very different methods of operation of the detection algorithms. The C-POD detection algorithms revolve around grouping clicks with similar characteristics into groups (trains) and classification is performed on these trains rather than on isolated clicks, as is the case for the Pamguard detector.
In the absence of visual observations or other independent verification of porpoise presence we used visually verified detections from full bandwidth recordings as the standard to compare against. This, combined with the use of a single sensor, resulted in the inability to determine the actual detection probability, p, and the true false detection rate, f. However, even visual observation will include perception bias in which animals are undetected by the observer (Kyhn et al. Citation2012; Marques et al. Citation2013). Nevertheless, this approach allowed us to make relative comparisons of performance of the detectors.
One could question the correctness of visually inspecting the full-band logger recordings in Pamguard following the described criteria, as this method may result in a nearly 100% correct score, due to the software’s similar settings and criteria as those used for the visual definition of porpoise clicks. However, in the absence of any independent information on presence of porpoises around the data loggers this is the only available method to validate recordings. The method relies on the fact that porpoise echolocation clicks are very stereotypic and unlike sounds from any other known sound source in the North Sea.
All C-POD filters are somewhat conservative, yielding a relatively low false detection rate and a slightly lower hit rate for all the C-POD filters. Our results, based on porpoise positive minutes, confirm the findings by Roberts and Read (Citation2014), showing that due to their lower sensitivity and conservative detection algorithm, C-PODs thus typically have lower detection rates than full-bandwidth loggers. However, this should ideally be counterbalanced by the multipliers of the density estimation (Equation 1), most notably a reduction of the estimate for detection probability, p, and thus not bias the density estimate.
A less conservative filter may identify even weak porpoise click signals and consequently have a high probability of detection; however, this inevitably increases the risk of false detections. In contrast, a more restrictive filter will have a lower probability of porpoise click detection and theoretically produce fewer false detections. PorpFilter was found to be the best performing C-POD filter, as it had a higher hit rate while maintaining a relatively low false detection rate, compared to the two other filters tested. The location of the three data points in the ROC plot () is indicative of the performance of the detector. The ideal location is the upper left corner, where performance is perfect (0% false alarms, 100% hits), whereas the lower left – upper right diagonal represents the worst possible performance, which is not better than simple, random guessing. Thus, the further towards the upper left a point is located, the better the overall performance. However, the hit rate and false alarm rate are coupled and for the same detector it is generally not possible to increase one without increasing the other. To help evaluate the performance of the different detectors the iso-detectability curves under the assumption of Gaussian underlying distributions of equal variance and the derived index of detectability (d’) were computed. This comparison showed that the PorpFilter had an overall higher index of detectability (d’ = 2.3), compared to the two default filters (HiModLo: d’ = 2.1 and HiMod: d’ = 1.9) and thus an increased ability (albeit small) to separate true porpoise signals from false positives. Therefore, using the PorpFilter for C-POD data analysis under conditions similar to that of the present study is recommend.
Ambient noise level was computed within the full recorded bandwidth and consists of natural ambient noise from waves and bottom material movements, shipping noise and noise produced by the platform. For this study, the information regarding the individual noise sources was not of interest; instead this experiment focused on understanding the combined effect of any noise on the detection of porpoises in the field. Therefore, data with noise in the band between 20 and 160 kHz were analysed in order to enable comparison with the C-POD unfiltered signals.
As harbour porpoises may avoid an area with high ambient noise levels (e.g. Hermannsen et al. Citation2014; Tougaard et al. Citation2015), it was important to test the correlation between Nall and the broad band noise level. The non-linear correlation between ambient noise level and Nall values reflects that Nall is only an indirect proxy for background noise (Tregenza Citation2014). C-PODs only log specific events with short tonal sounds within a narrow frequency band that contains more energy than the rest of that frequency range, whereas the full-band logger includes any sound within the specified frequency. Although a linear correlation between broad band noise level and Nall was not found, there is a general positive correlation in which higher Nall levels correspond to a higher broad band noise level and vice versa. However, data shown on seems to indicate that the relationship is not monotonic (there appears to be a dip in Nall for noise levels between 100 and 105 dB re. 1 μPa), which could suggest that more than one process is involved in the translation of background noise into (false) click detections: one non-linear process at lower noise levels (below 105 dB re. 1 μPa) and another, more simple linear process for higher noise levels. In the absence of other measures of ambient noise, however, it seems that Nall can be used as a crude proxy for background noise level.
Possible false detections in the PPM from the Pamguard and PorpFilter cannot be excluded. False detections may be caused by a variety of sound sources that could be similar to porpoise clicks; for example, some narrow-band high-frequency boat sonars, very high frequency clicks from some dolphins, cavitation of bubbles from propellers or sand movements. However, boat sonars usually have a very stable inter-click-interval in contrast to porpoise click trains and no boat sonar signals were found during visual validation and during random search. There are few sightings of dolphins in the area in which this study was conducted (Delefosse et al. Citation2017). Sand movement may have also lead to false alarms, but this would have most likely appeared as saturated C-POD recording periods, which were excluded in the data analysis and as the equipment was placed 2–3 metres above the seafloor at water depths of 40 metres in the middle of the North Sea, sand movement is expected to have limited influence on the click recordings. Our equipment was placed stationary; although some boats pass near the platform, cavitation sounds were neither heard nor found through random search or during visual data inspection. Therefore, none of these sound sources have caused false alarms in detected porpoise positive minutes.
As with any method used for detection and classification of a signal there will be some signals of interest that are missed, while other signals will be falsely detected and classified as ‘false alarms’ (Marques et al. Citation2013). As PAM is used throughout the world in studies estimating the density of cetaceans, it is very important to know how a detector performs in terms of hit and false alarm rates. It is also imperative to include this information in the density estimation equation as the resulting data will otherwise be biased (Marques et al. Citation2013). A detector’s performance may not be ideal, but if the number of misses and false alarms are known, density estimation is still be possible (e.g. Jaramillo-Legorreta et al. Citation2017).
In the end the maximal detection distance and hence the area covered by a detector, depend on the environmental conditions. Detection probability of any signal decrease with increasing background noise and thereby the area covered decreases with increasing noise level. This and other environmental factors may have a large impact on density estimation as shown by Helble et al. (Citation2013) where detection of humpback whales changed by a factor of 10 between locations and over time on the same stations solely due to environmental effects. Therefore, noise and possibly other environmental factors should always be considered and preferably factored in for both relative and absolute density estimation.
Conclusion
This paper demonstrates how different detectors and filters perform under varying ocean noise conditions, which in turn demonstrates the fact that echolocation cues (in this case PPM) should be analysed with care if they are to be used to determine the effect of noise on porpoise presence, as several other factors, most notably the detection process itself, can be affected by the noise. Pamguard detections changed less with increasing noise, when compared to the three C-POD filters. This does not mean that the Pamguard detection is not influenced by ambient noise, but the effect seems to be larger on the C-POD data. Of the C-POD filters, PorpFilter was better correlated with Pamguard detections throughout the recorded broadband noise and is thus preferred over the default KERNO filters, at least when working in habitats with noise conditions comparable to the present.
Funding
This work was supported by the Maersk Oil A/S a company of TOTAL [grant number 8600001830].
Disclosure statement
No conflict of interest was reported by the authors
Acknowledgements
A special thanks to Nick Tregenza, Søren Staal, Jeppe Dalsgaard Balle, Danuta Maria Wisniewska and Kristian Bedholm for their help with data analyses and comments. Servicing the buoy systems were professionally supported by FOGA ApS. Chelonia (C-PODs), Wildlife Acoustics (SM2M+ full-band loggers), SubSeaSonics (acoustic releasers) and Comet trawl in Esbjerg ApS (buoy system) are all acknowledged for their support with all sorts of technical issues. We thank Kathrine Whitman for skilled language editing.
References
- Carstensen J, Henriksen OD, Teilmann J. 2006. Impacts of offshore wind farm construction on harbour porpoises: acoustic monitoring of echolocation activity using porpoise detectors (T-PODs). Mar Ecol Prog Ser. 321:295–308.10.3354/meps321295
- Delefosse M, Rahbek ML, Roesen L, Clausen KT. 2017. Marine mammal sightings around oil and gas installations in the central North Sea. J Mar Biol Assoc United Kingdom. 1–9.
- Dähne M, Gilles A, Lucke K, Peschko V, Adler S, Krügel K, Sundermeyer J, Siebert U. 2013. Effects of pile-driving on harbour porpoises (Phocoena phocoena) at the first offshore wind farm in Germany. Environ Res Lett. 8:25002.10.1088/1748-9326/8/2/025002
- Gillespie D, Chappell O. 2002. An automatic system for detecting and classifying the vocalisations of harbour porpoises. Bioacoustics 13:37–61.10.1080/09524622.2002.9753485
- Gillespie D, Gordon J, Mchugh R, Mclaren D, Mellinger D, Redmond P, Thode A, Trinder P, Deng XY. 2009. PAMGUARD: semiautomated, open source software for real-time acoustic detection and localisation of cetaceans. Proc Inst Acoust. 30:2547.
- Helble TA, D’Spain GL, Hildebrand JA, Campbell GS, Campbell RL, Heaney KD. 2013. Site specific probability of passive acoustic detection of humpback whale calls from single fixed hydrophones. J Acoust Soc Am. 134:2556–2570.10.1121/1.4816581
- Hermannsen L, Beedholm K, Tougaard J, Madsen PT. 2014. High frequency components of ship noise in shallow water with a discussion of implications for harbor porpoises (Phocoena phocoena). J Acoust Soc Am. 136:1640–1653.10.1121/1.4893908
- Jaramillo-Legorreta A, Cardenas-Hinojosa G, Nieto-Garcia E, Rojas-Bracho L, Hoef J Ver, Moore J, Tregenza N, Barlow J, Gerrodette T, Thomas L, et al. 2017. Passive acoustic monitoring of the decline of Mexico’s critically endangered vaquita. Conserv Biol. 31:183–191.10.1111/cobi.12789
- Kyhn LA, Tougaard J, Thomas L, Duve LR, Stenback J, Amundin M, Desportes G, Teilmann J. 2012. From echolocation clicks to animal density-Acoustic sampling of harbor porpoises with static dataloggers. J Acoust Soc Am. 131:550–560.10.1121/1.3662070
- Marques TA, Thomas L, Martin SW, Mellinger DK, Ward JA, Moretti DJ, Harris D, Tyack PL. 2013. Estimating animal population density using passive acoustics. Biol Rev. 88:287–309.10.1111/brv.2013.88.issue-2
- Marques TA, Thomas L, Ward J, DiMarzio N, Tyack PL. 2009. Estimating cetacean population density using fixed passive acoustic sensors: an example with Blainville’s beaked whales. J Acoust Soc Am. 125:1982–1994.10.1121/1.3089590
- Mellinger DK, Barlow, J. 2003. Future directions for acoustic marine mammal surveys: stock assessment and habitat use. Tech Contrib No. 2557. 20–22.
- Pamguard: Open source software for passive acoustic monitoring [Internet]. United Kingdom: Pamguard; c2012–2018 [cited 2018 Feb 20]. http://www.pamguard.org/11_PluginModules.html
- Roberts BL, Read AJ. 2014. Field assessment of C-POD performance in detecting echolocation click trains of bottlenose dolphins (Tursiops truncatus). Mar Mammal Sci. 31:169–190.
- Sarnocinska J, Tougaard J, Johnson, M, Madsen PT, Wahlberg M. 2016. Comparing the performance of C-PODs and SoundTrap/PAMGUARD in detecting the acoustic activity of harbor porpoises (Phocoena phocoena). Proceedings of Meetings on Acoustics, 70013.10.1121/2.0000288
- Sousa-Lima RS, Norris TF, Oswald JN, Fernandes DP. 2013. A review and inventory of fixed autonomous recorders for passive acoustic monitoring of marine mammals. Aquat Mamm. 39:23–53.10.1578/AM.39.1.2013.23
- Tougaard J, Wright AJ, Madsen PT. 2015. Cetacean noise criteria revisited in the light of proposed exposure limits for harbour porpoises. Mar Pollut Bull. 90:196–208.10.1016/j.marpolbul.2014.10.051
- Tregenza, N. 2014. The software user guide for CPODEXE.
- Verfuß UK, Honnef CG, Meding A, Dähne M, Mundry R, Benke H. 2007. Geographical and seasonal variation of harbour porpoise (Phocoena phocoena) presence in the German Baltic Sea revealed by passive acoustic monitoring. J Mar Biol Assoc UK. 87:165.10.1017/S0025315407054938