
 ?Mathematical formulae have been encoded as MathML and are displayed in this HTML version using MathJax in order to improve their display. Uncheck the box to turn MathJax off. This feature requires Javascript. Click on a formula to zoom.
ABSTRACT
The communicative role of nonlinear vocal phenomena remains poorly understood since they are difficult to manipulate or even measure with conventional tools. In this study parametric voice synthesis was employed to add pitch jumps, subharmonics/sidebands, and chaos to synthetic human nonverbal vocalizations. In Experiment 1 (86 participants, 144 sounds), chaos was associated with lower valence, and subharmonics with higher dominance. Arousal ratings were not noticeably affected by any nonlinear effects, except for a marginal effect of subharmonics. These findings were extended in Experiment 2 (83 participants, 212 sounds) using ratings on discrete emotions. Listeners associated pitch jumps, subharmonics, and especially chaos with aversive states such as fear and pain. The effects of manipulations in both experiments were particularly strong for ambiguous vocalizations, such as moans and gasps, and could not be explained by a non-specific measure of spectral noise (harmonics-to-noise ratio) – that is, they would be missed by a conventional acoustic analysis. In conclusion, listeners interpret nonlinear vocal phenomena quite flexibly, depending on their type and the kind of vocalization in which they occur. These results showcase the utility of parametric voice synthesis and highlight the need for a more fine-grained analysis of voice quality in acoustic research.
Introduction
Nonlinear vocal phenomena, which can be roughly defined as various irregularities in the vibration of vocal folds (Riede et al. Citation2005), are common in the vocal repertoire of many avian (Fee et al. Citation1998) and mammalian species, including meerkats (Townsend and Manser Citation2011; Karp et al. Citation2014), whales (Tyson et al. Citation2007; Cazau et al. Citation2016), manatees (Mann et al. Citation2006), deer (Reby et al. Citation2005, Citation2016), canids (Wilden et al. Citation1998; Riede et al. Citation2000; Schneider and Anderson Citation2011), chimpanzees (Riede et al. Citation2007), and humans (Robb and Saxman Citation1988; Mende et al. Citation1990; Bachorowski et al. Citation2001; Facchini et al. Citation2005; Koutseff et al. Citation2018; Raine et al. Citation2018). Major advances have recently been made in providing mathematical (Mende et al. Citation1990; Herzel et al. Citation1995; Mergell and Herzel Citation1997; Tokuda et al. Citation2002; Herbst et al. Citation2013), physiological (Wilden et al. Citation1998; Titze Citation2008), and acoustic (Riede et al. Citation2000, Citation2005; Fitch et al. Citation2002) descriptions of these complex sounds, but their evolutionary significance and communicative roles are still debated (Fitch et al. Citation2002; Riede et al. Citation2007; Karp et al. Citation2014). To facilitate this research, an urgent task is to improve the experimental tools available for the measurement and manipulation of various nonlinearities in the voice.
I have recently presented soundgen, a novel tool for synthesizing nonverbal vocalizations (Anikin Citation2018), and argued that parametric voice synthesis could be a useful complement to more traditional correlational studies based on acoustic analysis of field recordings, as well as to interventional studies that modify recordings through sound editing. In this paper I report the results of two perceptual experiments in which soundgen was used to systematically manipulate various types of nonlinear vocal phenomena in synthetic human nonverbal vocalizations in order to explore their communicative significance.
Types of nonlinear vocal phenomena
During regular voiced phonation, the main oscillators – in most mammals, these are the left and right vocal folds – open and close in synchrony and at a relatively stable rate, describing a so-called limit cycle in the phase space (Wilden et al. Citation1998; Tokuda Citation2018). Phonation becomes less stable under certain conditions such as incomplete closure of the vocal folds with high pressure underneath them (subglottal pressure), or when fundamental frequency (f0) approaches or crosses a formant – a frequency band amplified by the resonance of the vocal tract (Herzel et al. Citation1995; Wilden et al. Citation1998; Riede et al. Citation2000; Neubauer et al. Citation2004; Cazau et al. Citation2016; Tokuda Citation2018). Various acoustic irregularities can then occur, particularly if there is an underlying left-right asymmetry in the anatomical structure of oscillators (Herzel et al. Citation1995). The exact nomenclature of nonlinearities in acoustic signals varies across disciplines; in bioacoustics, it is common to distinguish pitch jumps, subharmonics, biphonation, and deterministic chaos (Wilden et al. Citation1998; Riede et al. Citation2000, Citation2007; Fitch et al. Citation2002; Mann et al. Citation2006; Tyson et al. Citation2007; Blumstein and Recapet Citation2009; Schneider and Anderson Citation2011; Tokuda Citation2018).
Pitch jumps, or frequency jumps, are abrupt discontinuities of f0 associated with unstable phonation and described in the vocal repertoire of many animal species (Mann et al. Citation2006; Riede et al. Citation2007; Tyson et al. Citation2007; Schneider and Andersson Citation2011; Cazau et al. Citation2016). In humans, unwanted frequency jumps are an embarrassment to amateur singers to be avoided when switching between vocal registers (Wilden et al. Citation1998; Tokuda Citation2018), but they also occur in nonverbal vocalizations (Robb and Saxmann Citation1988). Overall, however, there are fewer reports and theoretical discussions of pitch jumps than other nonlinearities.
Subharmonics are observed when one vocal fold vibrates at exactly two or three times the frequency of the other (Riede et al. Citation2000; Fitch et al. Citation2002). The waveform remains periodic and describes a so-called ‘folded limit cycle’ in the phase space (Wilden et al. Citation1998). Subharmonics show on the spectrogram as one or more additional partials between harmonics of the fundamental frequency (, right) and can be conceptualized as two harmonically related tones produced simultaneously. For example, period doubling (g0 = f0/2) sounds like two voices, one an octave lower than the other. As a result, subharmonics lower the apparent pitch (Fitch et al. Citation2002). In addition, the commonly observed instability and irregularity of subharmonic regimes also creates an impression of vocal hoarseness or ‘roughness’ (Herzel et al. Citation1995; Fastl and Zwicker Citation2006).
Figure 1. Subharmonics at f0/2 (period doubling) followed by sidebands with slow amplitude modulation at a beat frequency of ~30 Hz (left) and subharmonics at f0/3 (right). Spectrogram with a 150 ms Gaussian window and 90% overlap. Source: vocal demonstration by the author. AUDIO #1 in Supplements.
Biphonation refers to a situation in which the left and right vocal folds or their parts vibrate at two different frequencies, f0 and g0. Biphonation in the narrow sense requires that f0 and g0 should not be harmonically related (i.e. f0:g0 should not be a rational number like 2:1, 4:3, etc.). The resulting waveform is not periodic, and the oscillating system describes a torus in the phase space (Wilden et al. Citation1998). If f0 and g0 vary independently, the spectrogram shows two nonparallel fundamental frequencies, which literally sounds like two voices. This is common in whale songs (Tyson et al. Citation2007) and can occasionally be seen in humans (Neubauer et al. Citation2004). Due to acoustic coupling, however, oscillators tend to partly synchronize (Fitch et al. Citation2002), so that f0 and g0 often vary in parallel or form integer ratios (Herzel et al. Citation1995). From this point of view, subharmonics can be regarded as a special case of biphonation with strong acoustic coupling and f0 an integer multiple of g0.
Another consequence of acoustic coupling in biphonation is that the spectrum contains not only f- and g-harmonics, but also their linear combinations nf0 + mg0, where n and m are integers (Wilden et al. Citation1998; Riede et al. Citation2000). If g0 is low relative to f0, the resulting spectrogram shows sidebands (, left) – additional partials that appear at ±g0, ±2g0 and so on around each f-harmonic (Wilden et al. Citation1998; Reby et al. Citation2016). Looking at the waveform, the lower frequency g0 shows as amplitude modulation of the carrier frequency f0. The modulation frequency can be lower than the rate at which either vocal fold is vibrating (Mergell and Herzel Citation1997). Frequency modulation (FM), such as the vibrato found in opera singing, can also be seen as a form of biphonation (Wilden et al. Citation1998), and rapid FM produces sidebands around f-harmonics (Sueur Citation2018). Perceptually, sidebands make the voice rough and in this sense resemble subharmonics (Herzel et al. Citation1995; Riede et al. Citation2000; Audio #1 in Supplements).
The terminology used to describe biphonation-related phenomena is somewhat inconsistent, and their acoustic complexity can be further enhanced by the recruitment of additional oscillators, such as air sacs and extensions of the vocal folds known as ‘vocal lips’ (Fitch et al. Citation2002), as well as by combining regular phonation with glottal or nasal whistles (Neubauer et al. Citation2004; Reby et al. Citation2016). The present study only deals with relatively simple cases of period doubling/tripling and sidebands. In both cases a lower secondary frequency g0 is added to the signal, and in the rest of the paper I refer to these manipulations simply as ‘subharmonics’.
In addition to the limit cycle (normal phonation), folded limit cycle (subharmonics), and torus (biphonation), vocal folds can vibrate in a chaotic regime that mathematically corresponds to a strange attractor in the phase space (Wilden et al. Citation1998; Fitch et al. Citation2002; Herbst et al. Citation2013). Deterministic chaos looks superficially similar to broadband turbulent noise on the spectrogram () and also possesses a rough vocal quality, but it has residual harmonic structure. As a result, a roar is perceptually distinct from hissing even if the sound pressure and spectral envelopes of both recordings are comparable. Several nonlinear regimes are often found within one vocalization (), and transitions between them are known as bifurcations. There are certain regularities in the typical sequence of bifurcations; for example, chaos is often preceded by subharmonics or biphonation (Wilden et al. Citation1998; Fitch et al. Citation2002).
Figure 2. Various nonlinearities in recorded (A) and synthetic (B) versions of two human screams. Spectrogram with a 50 ms Gaussian window and 70% overlap. Source: an adult female at a haunted house attraction (file 213_ut_fear_29-f-scream.wav from Anikin and Persson Citation2017). AUDIO #2a and #2b in Supplements.
Measuring and synthesizing nonlinear phenomena
The traditional ‒ and still popular and useful – approach to characterizing vocal nonlinearities is based on a visual inspection of the spectrogram. Among quantitative indices, harmonics-to-noise ratio (HNR) is a straightforward measure of harmonicity or tonality (Boersma Citation1993) and a good predictor of human ratings of noisiness (Riede et al. Citation2005), but it requires accurate pitch tracking, which is problematic for noisy sounds. Crucially, HNR fails to discriminate between spectral noise caused by irregular phonation (e.g. chaos) and turbulence (e.g. aspiration noise) in voiced calls. In fact, vocalizations with more nonlinearities may have a higher, not lower, harmonicity. For example, Raine et al. (Citation2018) report the seemingly paradoxical observation that the intensity of pain correlated with both the presence of nonlinearities and higher HNR. The likely explanation is that mild moans had a breathy voice quality, with weak harmonics and low HNR; screams of intense pain, on the other hand, were delivered in a bright voice with strong harmonics, making HNR higher despite episodes of chaos. In other words, HNR captures the overall level of spectral noise, but it is not a specific measure of nonlinear vocal phenomena.
Unlike HNR, other measures describe specifically the voiced component, namely the cycle-to-cycle variability in frequency (jitter) and amplitude (shimmer), so in principle they can distinguish between chaos and a breathy voice. However, their accurate measurement depends on being able to detect individual glottal cycles, which in practice is only feasible in sustained vowels (Goudbeek and Scherer Citation2010). Specialized algorithms borrowed from nonlinear dynamics have also been applied to biological sounds (Tokuda et al. Citation2002; Tyson et al. Citation2007; Cazau et al. Citation2016), but these tools require advanced mathematical expertise and may not be superior to HNR at capturing perceptually relevant properties (Riede et al. Citation2005).
Manipulating or synthesizing nonlinear phenomena is even more problematic than measuring them. Pitch jumps are the easiest to synthesize, since they only require a rapid change in f0. Subharmonics can be incorporated in models of individual glottal cycles (Alonso et al. Citation2015). Both subharmonics and sidebands can also be synthesized by adding rapid amplitude and/or frequency modulation to the signal (Sueur Citation2018; http://forumnet.ircam.fr/product/angus/). This is straightforward to do in soundgen, but a more flexible approach used in this study was to directly create extra partials around each f-harmonic, while forcing g0 and f0 to be at an integer ratio (Anikin Citation2018).
Chaos is the most challenging nonlinearity to synthesize. Biomechanical two-mass models of vocal folds (Herzel et al. Citation1995; Cazau et al. Citation2016) and even physical models of the vocal tract (Tokuda Citation2018) have been used to simulate chaotic behaviour and to investigate under what conditions chaos is likely to occur. However, by definition it is difficult to control the exact behaviour of the system once it has switched to a chaotic mode, so these models are less suitable for synthesizing sounds with the desired duration, strength, and dynamics of chaos as well as preserved traces of harmonics with the appropriate f0 contour. On the other hand, parametric speech synthesis sometimes incorporates stochastic cycle-to-cycle variability in the amplitude (shimmer) and period (jitter) of glottal cycles (Alonso et al. Citation2015), which is also the principle behind the generation of ‘chaos’ in soundgen. It is worth emphasizing that, although soundgen technically uses jitter and shimmer to approximate chaos, they are orders of magnitude stronger than in ordinary phonation, and the result appears to be perceptually similar to deterministic chaos (Anikin Citation2018). This approach makes it possible to control both the timing of each episode and the strength of ‘chaos’ – that is, the amount of residual energy in harmonics.
The role of nonlinear phenomena in communication
The goal of measuring and manipulating nonlinear vocal phenomena is to learn more about how they contribute to acoustic communication. Of course, nonlinearities might simply be incidental to vocal production, but there are both theoretical and empirical reasons to believe that they provide listeners with useful information (Fitch et al. Citation2002; Riede et al. Citation2007; Karp et al. Citation2014). Unfortunately, while many studies report correlations between behaviour and some measure of spectral noise, such as HNR, it is not always clear how this relates to the presence of specific nonlinear phenomena. Casting the net wide to include previous observations on spectral noise of any kind in both animal vocalizations and human speech, nonlinear vocal phenomena appear to be associated with:
High arousal. Rough and noisy vocalizations are produced in high-stakes contexts suggestive of high arousal understood as the level of general alertness, motivation, or intensity of emotional states (Fitch et al. Citation2002; Schneider and Anderson Citation2011; Briefer Citation2012). Noisy sounds may both serve as honest signals of urgency and advertise the caller’s fitness (Fitch et al. Citation2002; Riede et al. Citation2007). This is corroborated by biomechanical modelling, which suggests that nonlinearities occur when f0 and subglottal pressure are high, which is in turn indicative of an aroused physiological state (Herzel et al. Citation1995; Cazau et al. Citation2016). Nonlinearities also make a signal unpredictable, which prevents habituation in listeners (Blumstein and Recapet Citation2009; Townsend and Manser Citation2011; Karp et al. Citation2014). In humans, the perceived intensity of pain or distress correlates with the presence of nonlinearities in the cries of infants (Facchini et al. Citation2005; Koutseff et al. Citation2018) and adult actors (Raine et al. Citation2018), although it is not clear whether the effect is driven by high arousal, negative valence, or both.
High dominance. Low pitch is generally associated with physical (Morton Citation1977) and social (Puts et al. Citation2006, Citation2007) dominance. Subharmonics, and possibly also chaos, lower the perceived pitch, exaggerating the apparent body size, and this makes them suitable for displaying a dominant or aggressive attitude (Morton Citation1977; Ohala Citation1984; Fitch et al. Citation2002; Siebert and Parr Citation2003). Subharmonics and especially chaos also introduce spectral noise, which makes formant frequencies easier to detect (Fitch et al. Citation2002). Since formant dispersion is indicative of vocal tract length, nonlinearities help to advertize body size, as in roaring contests of male deer (Reby et al. Citation2005). In humans, HNR of a single word Hello affected the perceived social dominance of the speaker (McAleer et al. Citation2014).
Negative valence. Compared to arousal, there is much less consensus about acoustic correlates of the positive or negative valence of emotional states (Briefer Citation2012). Spectral noise and nonlinearities have been linked to unpleasant contexts (Fichtel et al. Citation2001) and aggression (Morton Citation1977; August and Anderson Citation1987), although in the latter case it is not clear whether they express negative valence or dominance. In humans, more tonal laughs have been reported to be less positive (Lavan et al. Citation2016), although this is more likely to be related to the balance between voiced and unvoiced fragments than to nonlinear phenomena. As noted above, nonlinearities in vocalizations of human infants are associated with intense distress (Facchini et al. Citation2005; Koutseff et al. Citation2018), and rapid amplitude modulation in human screams is associated with greater perceived fear intensity (Arnal et al. Citation2015). The literature is thus consistent with at least two possibilities: either nonlinearities amplify the intensity of any expressed emotion (i.e. making laughs more positive and screams or cries more negative), or they make any vocalization more negative in valence.
The present study
This study was designed to exploit soundgen’s ability to add a controlled amount of specific nonlinear phenomena to synthetic vocalizations, offering an opportunity to test their perceptual effects directly, without acoustic confounds. The chosen material was human nonverbal vocalizations. Although nonlinear vocal phenomena were traditionally regarded as being of peripheral importance to speech and associated with voice pathology (Robb and Saxman Citation1988; Fitch et al. Citation2002), it is now established that nonlinearities are common in non-pathological voices. They are particularly well documented in infants (Robb and Saxman Citation1988; Mende et al. Citation1990; Facchini et al. Citation2005; Koutseff et al. Citation2018), but adult voices appear to be no different (Raine et al. Citation2018). In fact, various nonlinearities were found in about half of spontaneous human vocalizations collected by Anikin and Persson (Citation2017). Since the stimuli in this study were synthetic replicas of these recordings, participants were presented with nonlinear vocal phenomena in a natural and familiar acoustic context.
Based on the evidence presented in the previous section, I hypothesized that listeners would associate nonlinear vocal phenomena with the speaker being alert (high arousal), assertive (high dominance), and experiencing something unpleasant (low valence). In order to test these hypotheses, listeners in a perceptual experiment rated the manipulated vocalizations on these three perceptual dimensions. Valence and arousal are standard dimensions used to describe the emotional component in both animal (Briefer Citation2012) and human (Belin et al. Citation2008; Lima et al. Citation2013) vocalizations. Dominance is less well established in emotion research, with different authors favouring various dimensions such as control, power, potency, and so on (Fontaine et al. Citation2007; Goudbeek and Scherer Citation2010). In this study participants were asked whether the speaker sounded aggressively self-confident or submissive as a measure of perceived social dominance (Puts et al. Citation2006, Citation2007).
Experiment 1
Methods
Stimuli
The stimuli consisted of 144 modifications of 28 human nonverbal vocalizations, four prototypes from each of the following seven call types: cry, gasp, grunt, laugh, moan, roar, and scream. All stimuli were synthetic reproductions of the original recordings (Anikin and Persson Citation2017) created with soundgen 1.1.2 (Anikin Citation2018). The 28 prototype vocalizations were all from different individuals: 17 women and 11 men. These particular sounds were chosen based on the relatively high authenticity ratings of their synthetic versions in a previous study that validated soundgen (Anikin Citation2018). The duration of longer stimuli was reduced, limiting the range of duration to 0.22–2.7 s.
Each of 28 prototypes was synthesized in three to six versions, which differed only in the type and intensity of nonlinear effects (see Supplements). Nonlinear phenomena consisted of pitch jumps, subharmonics, chaos, and their combination at two intensities: low in ‘mixed 1’ and high in ‘mixed 2’ (Figure S1). When a particular effect could not be applied or the result sounded too contrived, this variation was skipped: for example, pitch jumps don’t normally occur in gasps or short grunts.
Procedure
All data was collected online. Participants were told that they would hear synthetic versions of previously recorded human vocalizations. To minimize the correlation between scales, the experiment was divided into three blocks, one per scale (valence, arousal, and dominance). The order of blocks and sounds was randomized. Participants thus rated each sound three times, indicating how the speaker felt according to the following definitions:
Valence is high if the experience is pleasant, so the speaker is happy, pleased, relieved, etc. Valence is low if the experience is unpleasant, so the speaker is sad, afraid, in pain, etc.
Arousal is high if the person is very energetic, alert, wide-awake. Arousal is low if the person is sleepy, relaxed, calm.
Dominance is high if the speaker sounds assertive, self-confident, superior, perhaps aggressively so. Dominance is low if the person sounds submissive, uncertain, perhaps as someone who seeks reassurance or needs a hug.
Prior to each block the upcoming scale was illustrated with two examples, one high and the other low on the upcoming scale. To avoid presenting very similar sounds repeatedly, the stimuli were divided into four batches rated by different samples of participants. As a result, each participant heard maximum two manipulated versions of the same prototype. The average completion time was about 9 minutes.
Participants
It is particularly important to ensure data quality in the context of online experiments. All submissions were therefore manually screened for obvious cheating. In addition, the responses of 11 participants poorly correlated with the global median ratings (r < 0.3 on any two scales or r < 0 on any one scale), presumably indicating that they had not attended to the task, so they were excluded from the analysis. A separate sensitivity analysis was performed to make sure that the exclusion of 11 out of 97 participants with noisy data did not affect the main conclusions from the study (Table S2). The final sample consisted of 86 participants, of whom 18 were unpaid volunteers contacted via online advertisements and 68 were recruited from https://www.prolific.ac for £1.50. Each sound was rated on average 20.4 times (range 17.3 to 24.7) on each scale. No demographic characteristics were collected; according to the statistics on https://www.prolific.ac/demographics, over 80% of participants are native English speakers, and about 75% are between 20 and 40 years of age.
Statistical analysis
Unaggregated, trial-level responses were analyzed using mixed models with random intercepts per participant, per stimulus, and per prototype (shared by all sounds that were modifications of the same original vocalization). Valence, arousal, and dominance ratings were modelled using the beta distribution. Mixed models were fit in Stan computational framework (http://mc-stan.org/) accessed with R package brms (Bürkner Citation2017). To improve convergence and guard against overfitting, regularizing priors were used for all regression coefficients. In models with multiple predictors or many levels of categorical predictors (such as call types), more strongly regularizing horseshoe priors (Carvalho et al. Citation2009) were employed to provide so-called ‘shrinkage’ of regression coefficients towards zero, thus providing an in-built correction for multiple comparisons. The reported estimates are thus slightly more conservative than they would be with non-Bayesian models.
Exploratory analysis of the effects of the strength and duration of nonlinear phenomena was performed with non-Bayesian mixed models, using likelihood ratio test to determine the significance of effects.
The stimuli, R code for their generation, experimental datasets, and scripts for statistical analysis can be downloaded from http://cogsci.se/publications.html.
Results
Valence and arousal ratings aggregated per stimulus were related quadratically (F(2,141) = 20.0, p < .001; R2 = .22): sounds with both very positive and very negative valence ratings tended to be high on arousal. There was also a positive linear relationship between arousal and dominance (F(1,142) = 29.9, p < .001, R2 = .17) and between valence and dominance (F(1,142) = 12.4, p < .001, R2 = .08; Figure S3). Inter-rater reliability was moderate for valence (ICC = .45) and arousal (ICC = .56) and low for dominance (ICC = .21). Similar levels of inter-rater reliability were observed for valence and arousal ratings in a validation study with actual unmodified recordings of the same vocalizations (Anikin Citation2018). The imperfect agreement among raters is thus likely to be related to the intrinsic ambiguity of these vocalizations rather than to their synthetic nature, but the dominance scale was clearly associated with less consistent responses than the valence and arousal scales.
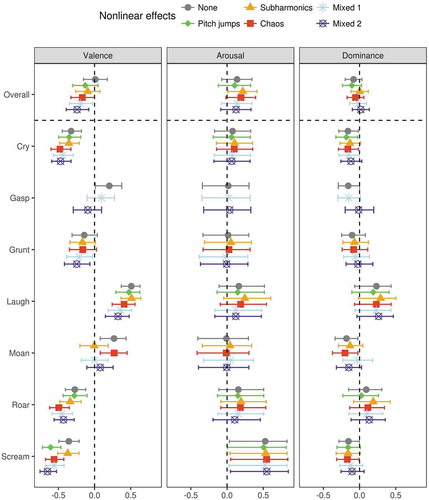
Adding any nonlinear effects reduced the perceived valence of a synthetic vocalization by 0.18 points on a scale of −1 to +1 (95% CI [0.11, 0.24]) compared to having no nonlinear effects (). The negative effect of nonlinearities on perceived valence was weakest for subharmonics (−0.11 [−0.19, −0.02]) and strongest for mixed nonlinear effects (−0.23 [−0.3, −0.15]).
Table 1. The effect of adding nonlinear phenomena.
Harmonics-to-noise ratio (HNR) progressively decreased after adding subharmonics, chaos, and their combination at low (‘mixed 1’) and high (‘mixed 2’) levels of intensity, but not pitch jumps (Figure S2). As expected, noisier vocalizations were perceived as more aversive: as HNR dropped by 10 dB, the perceived valence was predicted to become 0.14 points lower [0.05, 0.24]. However, the negative effects of nonlinear phenomena on valence survived controlling for HNR (), except for the effect of subharmonics (−0.05 [−0.14, 0.04]). This suggests that chaos and pitch jumps made the vocalization appear more negative even after accounting for the change in HNR, while the negative effect of subharmonics on valence was primarily mediated by the accompanying drop in HNR.
Looking at individual call types, mixed nonlinear effects lowered the valence of all vocalizations except grunts (Table S1). The negative effect of pitch jumps on valence was driven exclusively by screams, which became 0.25 [0.10, 0.39] more negative after the addition of pitch jumps. Subharmonics lowered the perceived valence of moans by 0.28 [0.07, 0.46], but they had little or no effect on the valence of other vocalizations. Chaos had a pronounced negative effect on the valence of cries, roars, screams, and perhaps laughs, but not grunts and moans (Table S1). In other words, the extent to which pitch jumps, subharmonics, and chaos affected valence depended on the call type, but in all cases this effect was negative.
Nonlinear effects had no effect on arousal ratings either overall (+0.02 [−0.05, 0.08], ) or for any call type (Table S1). The only marginal effect was a tendency for subharmonics to increase the perceived arousal by 0.08 [0.00, 0.16], which survived controlling for HNR (0.10 [0.00, 0.20]). HNR had no effect on arousal either by itself (0.02 [−0.04, 0.09]) or after controlling for the type of added nonlinear effects (0.06 [−0.05, 0.17]).
Dominance ratings became slightly higher after the addition of nonlinear effects (0.05 [0.00, 0.11]), particularly subharmonics (0.09 [0.01, 0.16]) or a mixture of subharmonics with pitch jumps and chaos (0.08 [0.02, 0.14]). However, neither chaos alone (0.03 [−0.05, 0.10]) nor pitch jumps alone (−0.02 [−0.11, 0.07]) had any effect on the perceived dominance, suggesting that the effect of nonlinear effects on dominance was driven specifically by subharmonics. On the other hand, this increase in dominance ratings was not strong enough to be significant when analyzing individual call types (, Table S1) and disappeared after controlling for HNR (). A 10 dB drop in HNR caused dominance ratings to increase by 0.14 [0.05, 0.22]. Interestingly, the difference between the effects of subharmonics and chaos on dominance ratings became slightly more robust after controlling for HNR (−0.09 [−0.16, −0.01]). These findings suggest that rough voices were perceived as more dominant, but this was primarily due to subharmonics rather than chaos or some other type of spectral noise.
Figure 3. The effect of nonlinear phenomena on the ratings of valence, arousal, and dominance (range −1 to + 1). Median of posterior distribution and 95% CI. Mixed 1, mixed 2 = mixed nonlinear effects, low/high intensity.
It is possible that not only the type of nonlinear phenomena but also their duration and strength might be salient to listeners. Valence ratings were affected by the duration of subharmonics (likelihood ratio test: L = 4.5, df = 1, p = .03) and arousal ratings by their strength (L = 4.7, df = 1, p = .03). Valence was affected by the duration (L = 11.8, df = 1, p < .001) but not strength of chaos, and arousal and dominance by neither. This exploratory analysis suggests that the effects of nonlinearities on valence mostly depended on the length of the affected vocal fragment, particularly in the case of chaos, although more stimuli would be needed to verify this finding.
Discussion
The aim of Experiment 1 was to evaluate the perceptual consequences of manipulating nonlinear vocal phenomena in several types of human nonverbal vocalizations. The findings are best seen as exploratory, but two key observations merit further investigation. First, although all nonlinearities made vocalizations more negative in valence, the effect of chaos was particularly strong; in contrast, only subharmonics increased the perceived arousal and dominance of the speaker. This suggests that different types of nonlinear phenomena may have distinct effects on listeners. Second, a commonly reported measure of harmonicity and spectral noise (HNR) did not fully account for the observed perceptual effects of nonlinear phenomena. From a listener’s perspective, the experimental acoustic manipulations thus appeared to be both salient and highly specific. A second experiment was designed to verify and extend these findings.
Experiment 2
Experiment 1 had two main limitations. First, there were only four prototype stimuli per call type, making it difficult to determine whether the perceptual effects of nonlinear phenomena were similar for different types of vocalizations. Second, although dominance is an interesting dimension theoretically, participants did not find this scale very intuitive and provided less consistent ratings compared to valence and arousal. In the follow-up experiment it was therefore decided to make the following changes:
The number of call types was reduced to four, of which one was predominantly positive in valence (laughs), one negative (screams), and two more ambivalent (gasps and moans). In contrast, the number of stimuli per call type was increased.
The outcome measure was the perceived intensity of several emotions instead of valence, arousal, and dominance scales. Three emotional labels were chosen for each call type: Pleased/Hurt/Surprised for gasps, Amused/Evil (jeering)/Polite for laughs (adapted from Szameitat et al. Citation2009; Wood et al. Citation2017), Pleased/Hurt/Effortful for moans, and Pleased/Afraid/Aggressive for screams. These labels do not cover the entire range of possible interpretations, but they correspond to the most common classifications of acoustically similar vocalizations in earlier studies (Anikin Citation2018; Anikin et al. Citation2018). Moreover, the objective in Experiment 2 was not to identify the full range of emotions associated with each sound, but only to contrast the responses to the same stimulus after various acoustic manipulations.
Experiment 1 suggested that the effects of different types of nonlinear phenomena were not identical. To clarify differences between pitch jumps, subharmonics, and chaos, these effects were always added separately, without mixing them.
Methods
Stimuli
The experimental stimuli were 212 synthetic replicas and modifications of 56 prototypes (Anikin and Persson Citation2017), including 10 gasps, 14 laughs, 15 moans or grunts, and 17 screams or high-pitched roars with duration ranging from 0.4 to 3.4 s (mean 1.25 s). Out of 56 prototypes, 30 were by women, 23 by men, and 3 by preadolescence children; 15 were also used in Experiment 1. Each prototype was replicated as faithfully as possible with soundgen 1.2.0 (Anikin Citation2018) and then re-synthesized in 3 to 5 modified versions ().
Table 2. Experimental manipulations of synthesized stimuli (N = 212, based on 56 prototypes).
Procedure
The experiment was performed in a web browser and began with training, in which participants rated eight real recordings of human non-linguistic vocalizations: two laughs, two gasps, two screams, and two moans. This training was intended to familiarize the participants with the rating tool and stimuli and was followed by the main experiment; the average completion time was 15 minutes. The rating tool was a novel triadic scale designed specifically for this experiment, which generated ratings on three categories from a single click. As shown in , three labels were placed in the corners of an equilateral triangle, and the weights of these three categories were related to the position of the marker within the triangle via a nonlinear transformation under the constraint that the three weights should sum to 100% (Table S3). The placement of emotion labels in the three corners was chosen randomly for each participant. Participants could see the bars indicating the weight of each category under the triangle, and pre-testing confirmed that this scale was intuitive to use. The code for running the triadic rating scale in html/javascript is available in the Supplements.
Participants
Participants were recruited via https://www.prolific.ac and paid £1.50. To minimize exposure to multiple modified versions of the same prototype sound, the stimuli were divided into four batches and rated by four independent samples of participants, so that each person heard no more than 2 versions of the same prototype. Criteria for excluding participants were: (1) correlation with global median ratings <0.3 after averaging across all labels and call types or (2) correlation with global median <0 for any call type. This identified 19 participants, who were removed from further analysis. As in Experiment 1, a sensitivity analysis confirmed that the exclusion of 19 out of 102 participants with noisy data did not affect the main conclusions from the study (Table S5). Trials with response time under 2 s (0.7% of data) were also excluded. Data from the final sample of 83 participants provided on average 20 (range 19 to 22) responses per sound.
Statistical analysis
The triadic rating scale returns a vector of three weights that sum to one – a so-called simplex. It can be modelled with the Dirichlet distribution, but a more flexible approach is to use a redundantly-parameterized normal distribution that forces the means for the three categories to sum to one with a softmax transform (Gelman et al. Citation1996):
for i in {1, 2, 3}, where µi is the mean of the normal distribution for the weight of each category and φi is normally distributed with a mean of zero. The φ parameters are not uniquely identifiable, making this parametrization redundant, but they do provide valid inference on µ. A corresponding Bayesian model was defined in Stan and extended to include a main effect of condition and two random intercepts (per participant and per prototype sound) with regularizing priors. A separate model was fit for each of four call types, since they had different outcome categories.
Results
The triadic rating scale used in this experiment is a novel tool, and prior to analyzing the results it was ascertained that participants interacted with it as intended (Figure S4). The marker’s position inside the triangle () determined the weights of three response categories, which were indicated by the labels at each vertex. Since it was the weights that participants were asked to set, the main analysis focused on how acoustic manipulations affected the weights of different emotion categories, not the marker’s coordinates. and present the predictions of the model without considering harmonics-to-noise ratio (HNR). Similarly to Experiment 1, the same models were also re-built with HNR as a covariate (Table S4).
Table 3. Contrasts between the effect of different acoustic manipulations on the weight of emotion categories for each call type: median of posterior distribution (%) and 95% CI.
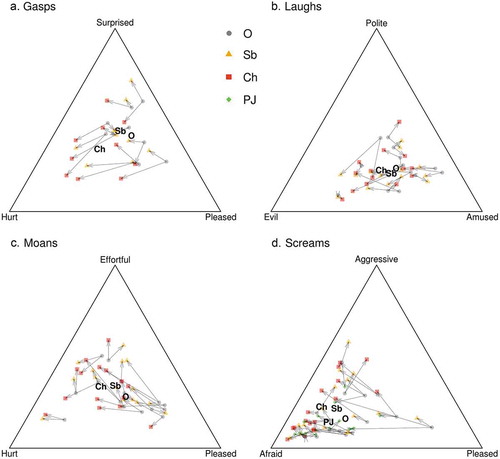
Figure 4. Mean coordinates representing the perceived emotion of different call types and acoustic manipulations. Labels in bold show the average for all sounds, while individual symbols and arrows show the effect of manipulations for each prototype sound. O = original, Sb = subharmonics, Ch = chaos, PJ = pitch jumps.
Gasps
As expected, both subharmonics and chaos increased the weight of the Hurt category, but the effect of chaos (+23.1%, 95% CI [17.0, 29.3] was more pronounced than the effect of subharmonics (+7.2% [2.0, 12.7]). The weight of the Pleased category dropped after the addition of nonlinear effects, and again chaos (−13.8% [−20.1, −7.8]) was more effective than subharmonics (−7.1% [−12.4, −1.6]). Chaos, but not subharmonics, also decreased the weight of the Surprised category (−9.2% [−17.8, −0.7]). Accounting for HNR did not substantively alter the observed effects of nonlinear phenomena on the perceived emotion (Table S4).
Laughs
The tested acoustic manipulations had little effect on the ratings of laughs. Chaos slightly shifted the interpretation of laughs from Amused (−7.7% [−13.1, −2.2]) to Evil (9.1% [1.7, 16.8]), but these effects disappeared after controlling for HNR (Table S4). It is therefore likely that the tendency to associate rough laughs with jeering was caused by the overall level of spectral noise rather than specifically by the presence of subharmonics or chaos.
Moans
In contrast to the weak findings for laughs, the effect of experimental manipulations on moans was very pronounced (, ). Chaos shifted the interpretation of moans from Pleased (−16.1% [−24.1, −8.5]) to Hurt (+10.5% [4.9, 15.9] or Effortful (+5.6% [0.2, 11.0]). Subharmonics had little or no effect on the weight of the Hurt category (2.9% [−2.0, 7.8]), but they shifted the weight from Pleased (−9.8% [−17.1, −3.1]) to Effortful (7.0% [2.0, 12.1]). Controlling for HNR weakened the effects of nonlinear phenomena in moans (Table S4).
Screams
Subharmonics in screams were associated with being less Pleased (−8.0% [−13.3, −2.7]) and more Aggressive (+6.0% [2.3, 9.8]). Chaos shifted the perceived emotion from Pleased (−16.3% [−22.2, −10.3]) to Afraid (+9.5% [5.0, 13.6]) or Aggressive (+6.8% [2.6, 11.1]). Pitch jumps were associated with being less Pleased (−9.2% [−15.7, −2.5]) and more Afraid (+8.4% [3.7, 13.2]), but not Aggressive (+0.8% [−3.9, 5.5]). Controlling for HNR removed the effects of nonlinear phenomena on the perceived level of aggression, but it did not account for the shift of interpretation from pleasure to fear (Table S4).
As in Experiment 1, an exploratory analysis was performed to test whether the perceptual effects of nonlinear vocal phenomena depended on their duration and strength. The strength of subharmonics in gasps was a negative predictor of being Hurt (L = 14.6, df = 1, p < .001 without a Bonferroni correction) and a positive predictor of being Surprised (L = 11.6, df = 1, p < .001). For laughs, the only significant finding was a positive effect of g0 frequency on the weight of the Amused category (L = 13.1, df = 1, p < .001). No effects were discovered for moans or screams. The length of the episode with chaos had no effect on the weight of any emotion for any call type. More stimuli would be needed to improve the power of this analysis.
Discussion
Experiment 2 aimed to verify and nuance the findings from Experiment 1 by increasing the number of stimuli and using discrete emotions instead of the dimensions of valence, arousal, and dominance. The results strongly confirmed that nonlinear vocal phenomena, particularly chaos, were associated with aversive experiences, but with interesting differences between call types.
The results for laughs were inconclusive and not specific to any particular type of spectral noise. Adding any nonlinearities to screams shifted their interpretation from pleasure to fear. In addition, spectral noise of any kind, but not pitch jumps, made screams more aggressive. The most nuanced picture emerged for the relatively ambiguous vocalizations – gasps and moans. Nonlinearities turned a gasp or moan of pleasure into pain, but chaos was perceived as much more aversive than subharmonics. This difference was not fully explained by harmonicity (HNR), further suggesting that listeners distinguished between these two types of nonlinear vocal phenomena and did not base their judgments solely on overall vocal roughness. Chaos and particularly subharmonics also made moans more effortful.
General discussion
Experiments 1 and 2 tested the perceptual consequences of adding different combinations of nonlinear vocal phenomena to otherwise identical synthetic vocalizations. In contrast to correlational studies, with this approach the effects of specific acoustic manipulations can be tested directly. The main trade-off is that the synthetic nature of stimuli may affect the results. For example, it remains unclear whether the effects of acoustic manipulations on synthetic laughs were weak because the stimuli were not sufficiently realistic, even if authenticity is less of a concern for the other tested call types (Anikin Citation2018). It must also be emphasized that the reported findings concern only the effects of nonlinearities on the audience – other methods are needed to clarify what they actually reveal about the vocalizer’s affective state and intentions.
Contrary to previous reports, neither nonlinear phenomena nor HNR increased the perceived level of arousal, with the exception of a small effect of subharmonics. This is surprising and needs to be verified, since the association between nonlinear vocal phenomena and high arousal is well documented in many non-human animals (Fitch et al. Citation2002; Schneider and Anderson Citation2011; Briefer Citation2012). A possible explanation is that in real life nonlinear phenomena correlate with other acoustic features indicative of high arousal, such as greater loudness, longer syllables, stronger harmonics, and higher and more variable f0 (Briefer Citation2012). Perhaps listeners utilize these other features, rather than nonlinear phenomena per se, to detect high arousal. Another possibility is that nonlinearities signal the intensity of emotional experience rather than the general level of alertness. Following psychological research (Russell Citation1980; Belin et al. Citation2008; Lima et al. Citation2013), arousal in this study was defined as being energetic and alert (vs. relaxed and sleepy), whereas some previous reports of correlations between spectral noise and arousal refer to emotion intensity (Schneider and Anderson Citation2011; Briefer Citation2012) rather than alertness. It is thus possible that participants interpreted nonlinear phenomena as indicating a more intense emotional experience, and this was partly captured by the valence but not arousal scale.
In line with predictions, the addition of nonlinear vocal phenomena made valence ratings lower and dominance ratings higher. However, there was an unexpected ‘division of labour’ between different types of nonlinear phenomena: negative valence was primarily associated with chaos or pitch jumps, while high dominance, aggression, or physical effort were associated with subharmonics. Crucially, the perceptual effects of nonlinear vocal phenomena went beyond what would be expected from their impact on the amount of spectral noise alone, as measured by harmonics-to-noise ratio (HNR). This indicates that listeners distinguished between turbulent noise and nonlinear phenomena, on the one hand, and between pitch jumps, subharmonics, and chaos as different kinds of nonlinear phenomena, on the other.
This finding has immediate practical implications. Although the need for a more fine-grained analysis of spectral noise is increasingly recognized in bioacoustics (Fitch et al. Citation2002; Riede et al. Citation2007; Cazau et al. Citation2016), the acoustic measures reported in most perceptual studies (HNR, jitter, and shimmer) cannot reliably distinguish between turbulent noise, subharmonics, and chaos. Unless spectrograms are inspected manually, pitch jumps slip entirely under the radar of a conventional acoustic analysis, since there are no tools for their automatic detection. At the same time, the present results indicate that different types of nonlinear vocal phenomena convey highly salient and specific information to listeners. The field can thus benefit from more widespread use of specialized tools for analyzing nonlinear dynamics (Tokuda et al. Citation2002; Cazau et al. Citation2016) and from experimental manipulation of nonlinear vocal phenomena, as in the present study. A particularly urgent task is to elucidate the role of nonlinearities in human vocal communication, where they have been largely neglected outside infant studies.
Naturally, the reported perceptual effects of nonlinear phenomena will need to be confirmed in future experiments, and many pieces of the puzzle are still missing. For example, the dominance scale in Experiment 1 had low reliability, and the corresponding effect size was small. The findings for screams and roars in Experiment 2 were consistent with the notion that nonlinearities project a dominant or aggressive attitude, but this effect was attributable to any spectral noise and relatively weak, possibly because all scream-like sounds tended to be interpreted as manifestations of fear. In addition, subharmonics were not more effective than chaos in turning a laugh into a jeer, and the effect of both was again non-specific and fully explained by HNR. The reason may be that individual voiced fragments in laughs are too short for listeners to distinguish between different sources of spectral noise. In any case, the role of nonlinear phenomena, and particularly subharmonics, in asserting social dominance or expressing an aggressive, self-confident attitude is plausible, but uncertain.
In future studies it will also be interesting to investigate how the perceptual effects of nonlinear vocal phenomena depend on their strength, duration, and temporal position within a call. Exploratory analyses of the available data produced inconclusive results, and more extensive testing would be needed to determine the communicative significance of the subharmonic frequency g0 and of the strength and duration of subharmonics and chaos. In particular, although in most cases g0 was between 100–200 Hz, it ranged from sidebands corresponding to amplitude modulation at less than 100 Hz to period doubling in screams with g0 of up to 700–800 Hz. It is an open question whether the perceptual effects of such widely varying subharmonic regimes are comparable enough to treat them as the same manipulation, as in this study.
Perhaps the most important pending question is whether nonlinear phenomena are necessarily interpreted as aversive. Since the most positive call type in this study, laughter, produced relatively weak results, it is still possible that nonlinearities might increase the perceived intensity of any expressed emotion regardless of its valence. The explanation most consistent with the present findings, however, is that listeners generally associate nonlinear phenomena with more negative valence, particularly in call types that can be either aversive or hedonistic. It is even less certain to what extent the production, as opposed to perception, of nonlinearities is restricted to aversive contexts. In the corpus of human nonverbal vocalizations by Anikin and Persson (Citation2017), nonlinear effects are particularly common in cries, screams, and roars, mostly implicating negative emotional states (sadness, anger, pain, etc.). On the other hand, triumph and extreme pleasure also appear to be expressed through intense calls rich in nonlinear phenomena, such as roars of jubilant football fans or orgasmic moans. It remains to be seen whether the listeners’ interpretation is correct – that is, whether nonlinear phenomena reliably indicate an aversive context.
In conclusion, using parametric synthesis in order to study the perceptual consequences of changing voice quality in human nonverbal vocalizations has shed new light on the role of nonlinear vocal phenomena and source spectrum. The experimental results presented here can also guide further research on the role of voice quality in acoustic communication using non-synthetic vocalizations and a more traditional, non-interventional approach.
AUDIO NO. 1 - Figure 1 [Subharmonics and Sidebands]
Download MP3 Audio (22.1 KB)AUDIO NO. 2A - Figure 2 [REAL]
Download MP3 Audio (19.8 KB)AUDIO NO. 2B - Figure 2 [SYNTHETIC]
Download MP3 Audio (10.1 KB)Supplemental Figures and Tables
Download PDF (1.2 MB)AUDIO NO. 3 - Figure S1 [No nonlinear effects]
Download MP3 Audio (6.1 KB)AUDIO NO. 3 - Figure S1 [Pitch jumps]
Download MP3 Audio (6.1 KB)AUDIO NO. 3 - Figure S1 [Subharmonics]
Download MP3 Audio (6 KB)AUDIO NO. 3 - Figure S1 [Chaos]
Download MP3 Audio (6.1 KB)AUDIO NO. 3 - Figure S1 [Mixed level 1]
Download MP3 Audio (5.9 KB)AUDIO NO. 3 - Figure S1 [Mixed level 2]
Download MP3 Audio (6 KB)Acknowledgements
I am grateful to Stephan Reber, Tomas Persson, Christian Balkenius, and two anonymous reviewers for their comments on the manuscript.
Disclosure statement
No potential conflict of interest was reported by the author.
Supplementary material
Supplemental data for this article can be accessed here.
References
- Alonso JB, Ferrer MA, Henríquez P, López-de-Ipina K, Cabrera J, Travieso CM. 2015. A study of glottal excitation synthesizers for different voice qualities. Neurocomputing. 150:367–376.
- Anikin A. 2018. Soundgen: an open-source tool for synthesizing nonverbal vocalizations. Behav Res Methods. 1–15. doi:10.3758/s13428-018-1095-7
- Anikin A, Bååth R, Persson T. 2018. Human non-linguistic vocal repertoire: call types and their meaning. J Nonverbal Behav. 42(1):53–80.
- Anikin A, Persson T. 2017. Nonlinguistic vocalizations from online amateur videos for emotion research: a validated corpus. Behav Res Methods. 49(2):758–771.
- Arnal LH, Flinker A, Kleinschmidt A, Giraud AL, Poeppel D. 2015. Human screams occupy a privileged niche in the communication soundscape. Curr Biol. 25(15):2051–2056.
- August PV, Anderson JG. 1987. Mammal sounds and motivation-structural rules: a test of the hypothesis. J Mammal. 68(1):1–9.
- Bachorowski JA, Smoski MJ, Owren MJ. 2001. The acoustic features of human laughter. J Acoust Soc Am. 110(3):1581–1597.
- Belin P, Fillion-Bilodeau S, Gosselin F. 2008. The Montreal affective voices: a validated set of nonverbal affect bursts for research on auditory affective processing. Behav Res Methods. 40(2):531–539.
- Blumstein DT, Recapet C. 2009. The sound of arousal: the addition of novel nonlinearities increases responsiveness in marmot alarm calls. Ethol. 115(11):1074–1081.
- Boersma P. 1993. Accurate short-term analysis of the fundamental frequency and the harmonics-to-noise ratio of a sampled sound. Proc Inst Phon Sci. 17(1193):97–110.
- Briefer EF. 2012. Vocal expression of emotions in mammals: mechanisms of production and evidence. J Zool. 288(1):1–20.
- Bürkner PC. 2017. brms: an R package for Bayesian multilevel models using Stan. J Stat Softw. 80(1):1–28.
- Carvalho CM, Polson NG, Scott JG. 2009. Handling sparsity via the horseshoe. Proceedings of the 12th International Conference on Artificial Intelligence and Statistics (AISTATS); Apr 15; Florida, USA: Clearwater Beach. p. 73–80.
- Cazau D, Adam O, Aubin T, Laitman JT, Reidenberg JS. 2016. A study of vocal nonlinearities in humpback whale songs: from production mechanisms to acoustic analysis. Sci Rep. 6:31660.
- Facchini A, Bellieni CV, Marchettini N, Pulselli FM, Tiezzi EB. 2005. Relating pain intensity of newborns to onset of nonlinear phenomena in cry recordings. Phys Lett A. 338(3–5):332–337.
- Fastl H, Zwicker E. 2006. Psychoacoustics: facts and models. Berlin: Springer.
- Fee MS, Shraiman B, Pesaran B, Mitra PP. 1998. The role of nonlinear dynamics of the syrinx in the vocalizations of a songbird. Nature. 395(6697):67–71.
- Fichtel C, Hammerschmidt K, Jürgens U. 2001. On the vocal expression of emotion. A multi-parametric analysis of different states of aversion in the squirrel monkey. Behav. 138(1):97–116.
- Fitch WT, Neubauer J, Herzel H. 2002. Calls out of chaos: the adaptive significance of nonlinear phenomena in mammalian vocal production. Anim Behav. 63(3):407–418.
- Fontaine JR, Scherer KR, Roesch EB, Ellsworth PC. 2007. The world of emotions is not two-dimensional. Psychol Sci. 18(12):1050–1057.
- Gelman A, Bois F, Jiang J. 1996. Physiological pharmacokinetic analysis using population modeling and informative prior distributions. J Am Stat Assoc. 91(436):1400–1412.
- Goudbeek M, Scherer K. 2010. Beyond arousal: valence and potency/control cues in the vocal expression of emotion. J Acoust Soc Am. 128(3):1322–1336.
- Herbst C, Herzel H, Švec JG, Wyman MT, Fitch WT. 2013. Visualization of system dynamics using phasegrams. J R Soc Interface. 10(85):20130288.
- Herzel H, Berry D, Titze I, Steinecke I. 1995. Nonlinear dynamics of the voice: signal analysis and biomechanical modeling. Chaos. 5(1):30–34.
- Karp D, Manser MB, Wiley EM, Townsend SW. 2014. Nonlinearities in meerkat alarm calls prevent receivers from habituating. Ethology. 120(2):189–196.
- Koutseff A, Reby D, Martin O, Levrero F, Patural H, Mathevon N. 2018. The acoustic space of pain: cries as indicators of distress recovering dynamics in pre-verbal infants. Bioacoustics. 27(4):313–325.
- Lavan N, Scott SK, McGettigan C. 2016. Laugh like you mean it: authenticity modulates acoustic, physiological and perceptual properties of laughter. J Nonverbal Behav. 40(2):133–149.
- Lima CF, Castro SL, Scott SK. 2013. When voices get emotional: a corpus of nonverbal vocalizations for research on emotion processing. Behav Res Methods. 45(4):1234–1245.
- Mann DA, O’Shea TJ, Nowacek DP. 2006. Nonlinear dynamics in manatee vocalizations. Mar Mamm Sci. 22(3):548–555.
- McAleer P, Todorov A, Belin P. 2014. How do you say ‘Hello’? Personality impressions from brief novel voices. PLoS One. 9(3):e90779.
- Mende W, Herzel H, Wermke K. 1990. Bifurcations and chaos in newborn infant cries. Phys Lett A. 145(8–9):418–424.
- Mergell P, Herzel H. 1997. Modelling biphonation – the role of the vocal tract. Speech Commun. 22(2–3):141–154.
- Morton ES. 1977. On the occurrence and significance of motivation-structural rules in some bird and mammal sounds. Am Nat. 111(981):855–869.
- Neubauer J, Edgerton M, Herzel H. 2004. Nonlinear phenomena in contemporary vocal music. J Voice. 18(1):1–12.
- Ohala JJ. 1984. An ethological perspective on common cross-language utilization of F₀ of voice. Phonetica. 41(1):1–16.
- Puts DA, Gaulin SJ, Verdolini K. 2006. Dominance and the evolution of sexual dimorphism in human voice pitch. Evol Hum Behav. 27(4):283–296.
- Puts DA, Hodges CR, Cárdenas RA, Gaulin SJ. 2007. Men’s voices as dominance signals: vocal fundamental and formant frequencies influence dominance attributions among men. Evol Hum Behav. 28(5):340–344.
- Raine J, Pisanski K, Simner J, Reby D. 2018. Vocal communication of simulated pain. Bioacoustics. 1–23. doi:10.1080/09524622.2018.1463295
- Reby D, McComb K, Cargnelutti B, Darwin C, Fitch WT, Clutton-Brock T. 2005. Red deer stags use formants as assessment cues during intrasexual agonistic interactions. Proc R Soc Lond B Biol Sci. 272(1566):941–947.
- Reby D, Wyman MT, Frey R, Passilongo D, Gilbert J, Locatelli Y, Charlton BD. 2016. Evidence of biphonation and source–filter interactions in the bugles of male North American wapiti (Cervus canadensis). J Exp Biol. 219(8):1224–1236.
- Riede T, Arcadi AC, Owren MJ. 2007. Nonlinear acoustics in the pant hoots of common chimpanzees (Pan troglodytes): vocalizing at the edge. J Acoust Soc Am. 121(3):1758–1767.
- Riede T, Herzel H, Mehwald D, Seidner W, Trumler E, Böhme G, Tembrock G. 2000. Nonlinear phenomena in the natural howling of a dog–wolf mix. J Acoust Soc Am. 108(4):1435–1442.
- Riede T, Mitchell BR, Tokuda I, Owren MJ. 2005. Characterizing noise in nonhuman vocalizations: acoustic analysis and human perception of barks by coyotes and dogs. J Acoust Soc Am. 118(1):514–522.
- Robb MP, Saxman JH. 1988. Acoustic observations in young children’s non-cry vocalizations. J Acoust Soc Am. 83(5):1876–1882.
- Russell JA. 1980. A circumplex model of affect. J Pers Soc Psychol. 39(6):1161–1178.
- Schneider JN, Anderson RE. 2011. Tonal vocalizations in the red wolf (Canis rufus): potential functions of nonlinear sound production. J Acoust Soc Am. 130(4):2275–2284.
- Siebert ER, Parr LA. 2003. A structural and contextual analysis of chimpanzee screams. Ann N Y Acad Sci. 1000(1):104–109.
- Sueur J. 2018. Sound analysis and synthesis with R. Cham: Springer. doi:10.1007/978-3-319-77647-7
- Szameitat DP, Alter K, Szameitat AJ, Darwin CJ, Wildgruber D, Dietrich S, Sterr A. 2009. Differentiation of emotions in laughter at the behavioral level. Emotion. 9(3):397–405.
- Titze IR. 2008. Nonlinear source–filter coupling in phonation: theory. J Acoust Soc Am. 123(4):1902–1915.
- Tokuda I, Riede T, Neubauer J, Owren MJ, Herzel H. 2002. Nonlinear analysis of irregular animal vocalizations. J Acoust Soc Am. 111(6):2908–2919.
- Tokuda IT. 2018. Non-linear dynamics in mammalian voice production. Anthropol Sci. 171130:1–7.
- Townsend SW, Manser MB. 2011. The function of nonlinear phenomena in meerkat alarm calls. Biol Lett. 23. 7(1):47–49.
- Tyson RB, Nowacek DP, Miller PJ. 2007. Nonlinear phenomena in the vocalizations of North Atlantic right whales (Eubalaena glacialis) and killer whales (Orcinus orca). J Acoust Soc Am. 122(3):1365–1373.
- Wilden I, Herzel H, Peters G, Tembrock G. 1998. Subharmonics, biphonation, and deterministic chaos in mammal vocalization. Bioacoustics. 9(3):171–196.
- Wood A, Martin J, Niedenthal P. 2017. Towards a social functional account of laughter: acoustic features convey reward, affiliation, and dominance. PLoS One. 12(8):e0183811.