
 ?Mathematical formulae have been encoded as MathML and are displayed in this HTML version using MathJax in order to improve their display. Uncheck the box to turn MathJax off. This feature requires Javascript. Click on a formula to zoom.
ABSTRACT
The increasing integration of international financial markets means that credit defaults in one country have to be covered by creditors in other countries. If the principle of creditor liability were applied systematically, the financial losses incurred by the financial institution that provided the credit and is thus directly affected by the default would be ‘passed on’ through its domestic and foreign shareholders and debt holders, as well as their creditors, to the original savers. In this paper, this contagion effect will be estimated by taking international capital linkages into account. Analogously to an input–output analysis of inter-industry linkages, savings used for investments in one country are traced back to the countries from which the funds originated. This also reveals the important role of international financial centers, which essentially serve as distributors of investment risks, while the financial losses are ultimately borne by larger countries with higher levels of savings.
1. Introduction
In 2008, when the mortgage default crisis hit in the USA, raising the risk of insolvency for numerous major financial institutions, a series of crises were unleashed on international financial markets. In the years that followed, banks in Greece, Ireland, Portugal, Spain, and ultimately Cyprus were driven to the brink of bankruptcy as a result of bad investments. Policy makers responded by providing extensive financial support and largely suspending the principle of creditor liability. This was rooted in fears of financial contagion, where one bank’s insolvency leads to the insolvency of further banks because they have to write off a large portion of their outstanding debts to the first bank. It was only later that holders of Greek debt were pressed to cut the value of their holdings, and it was only in the case of Cyprus that their creditors were forced to bear the burden when the two largest credit institutions failed.
This raises the question of whose assets were actually protected by the state support measures. To estimate the financial losses resulting from a systematic application of the principle of creditor liability, one needs figures on national and international credit relations at the level of the individual financial institutions. This information is difficult to obtain and in some cases simply not available at all.Footnote1 Even when the aim is to quantify domestic credit linkages within Germany alone, there are severe limitations, and numerous estimations are required (Upper and Worms, Citation2002).
For these reasons, a number of studies have taken a different approach by examining linkages among international financial markets using aggregated national data on capital exports and imports. One of these, Gourinchas et al. (Citation2011), estimated a matrix of bilateral external claims and liabilities and used it to estimate changes in asset prices during the global financial crisis of 2008. Milesi-Feretti et al. (Citation2010) analyzed bilateral financial linkages between around 70 countries in the context of global imbalances and also illuminated the role of smaller countries as offshore financial centers. Examining a smaller group of countries over a longer period of time, Kubelec and Sa (Citation2010) traced the development and intensity of the international integration of capital markets over more than two decades.
This paper takes the same approach by attempting to estimate the possible domino effect of credit defaults on a national level. Due to the linkages among international financial markets, credit failures in one country have to be paid for not only by domestic but also by foreign lenders. If the principle of creditor liability were applied systematically, the loss of assets by the affected bank would be ‘passed on’ through its domestic and foreign shareholders and debt holders, to the original savers. In this paper, we examine this effect in a methodological framework similar to an input–output analysis of an economy’s inter-industry linkages. Just as an input–output analysis traces the value added contained in the final demand for a given product back to the respective economic sectors when taking intermediate goods into account, savings contained in the investment in a given country can be traced back to the countries of origin taking international capital linkages into account.
The idea to analyze financial flows in an input–output model is not new. Stone (Citation1966) outlined a comprehensive system of social acounts integrating input–output and a matrix of financial liabilities and assets broken down by sectors in a closed economy. Klein (Citation1983) proposed the analysis of flow-of-funds, i.e. the changes in financial assets and liabilities, in a form that resembles input–output models. Leontief and Brody (Citation1993) showed how the standard input–output relationships can be complemented by monetary flows. Tsujimura and Mizoshita (Citation2003) followed the ideas separately proposed by Stone and Klein and applied the Leontief inverse matrix to domestic capital flows in order to evaluate the monetary policy of the Bank of Japan. Tsujimura and Tsujimura (Citation2011) was the first attempt to apply the Leontief inverse matrix to international capital flows. They used a country-by-country matrix derived from data of the Coordinated Portfolio Investment Survey (CPIS), which is published by IMF, to estimate the loss to each country of the world from the US home mortgage delinquency.
This paper goes beyond the literature so far available by exploring the saving-investment balance of a country in the framework of the international lender–borrower relationship. While Tsujimura and Tsujimura (Citation2011) used only the CPIS as source of data so that they covered only the portfolio investment between countries, for this paper information was gathered from the national accounts as well as from balance of payments statistics so that the analysis explicitly depicts the relationship between domestic and international economies.
2. Methodology
In every country, funds from domestic savings, supplemented by foreign funds, can be invested either at home or abroad. When international capital flows are separated by countries of origin and destination, these bilateral capital flows, supplemented by domestic investment and saving for n countries in a specific period, can be stated as shown in Figure .
FIGURE 1. International capital flows.
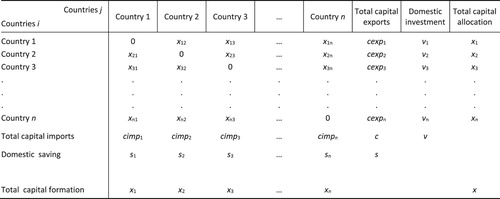
Here, the values on the main diagonal are zero because there are no adequate data available on credit relations between the individual banks, and therefore, capital flows within the countries cannot be calculated. The sources of data that are available provide only information on cross-border capital flows. This leads to the assumption that domestic savings funds go directly into use as domestic investments or capital exports. The total extent of credit relations between original savers and final investors is thus underestimated. The analysis of the domino effect presented here thus takes into account only the risk of contagion that is connected with cross-border chains of creditors.
The terms in Figure stand for the following:
xij capital flows from country i to country j (i,j = 1, … ,n)
cimpj = Σi xij total capital imports of country j
cexpi = Σj xij total capital exports of country i
sj saving in country j
vi investment in country i
In every country, the capital formation xj from savings and capital imports has to be equal to capital allocation xi for domestic investments and capital exports, that is:
(1)
(1)
and
(2)
(2)
with xj = xi for i = j.
The values in the columns show the financing of assets in a given country. The values in the rows show how these assets are invested. The international mobility of capital makes it possible that investments in a country exceed the level of domestic savings and conversely that savings exceed domestic investments. In the former case, capital imports are larger than capital exports, and there is net capital inflow; in the latter case, the situation is reversed and there is net capital outflow. From Equations 1 and 2 it follows that in every country, the difference between savings and investments is equal to the difference between capital exports and capital imports. This results from the fact that, by definition, in the balance of payments the net capital exports correspond to the difference between exports and imports of goods and services, and in the national accounts, the net exports of goods and services are in turn equal to the difference between saving and investment. For all countries together, capital exports must be equal to capital imports in the amount of c, and worldwide, savings s is equal to investments v.
Figure corresponds formally to an input–output table which shows the deliveries between economic sectors in the first quadrant, final demand in the second quadrant, and the components of value added in the third quadrant. In the static model of input–output analysis, under the assumption of constant input coefficients, one can calculate the total production and value added that is necessary for the final demand for a certain good – both directly, in the sector producing the final good, and indirectly, through the demand for intermediate goods in all sectors. Analogously, when assuming a constant financing structure from domestic savings and capital imports (Figure ), one can determine the total financing contained in an investment, either directly or indirectly through capital imports, and the original savings from all countries.
FIGURE 2. Financing structure.
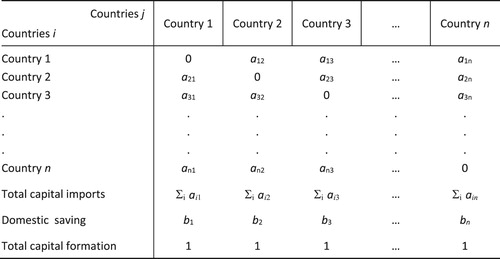
The mathematical formulation of the model is as follows: Estimating the financing structure of capital formation for each country j results in the share aij of capital imports from country i and bj for domestic savings (Figure ), such that
(3)
(3)
Assuming that the financing structure is independent of the amount of financing and the type of investment, the total capital allocation of country i in Table can be stated as
(4)
(4)
with xi as a variable that represents the level of financing activities and thus the amount of funds in country i. For all countries, this equation can be formulated as
(5)
(5)
with the matrix A = (aij) and the column vectors v = (vi) and x = (xi) or (xj).
For a given vector v of investments, this results in
(6)
(6)
and
(7)
(7)
The vector x gives the entire amount of funding in the various countries for domestic investments in the amount of v that are needed both directly and indirectly, via capital imports.
If one refers to the inverse matrix (I – A)−1 as C, that is,
(8)
(8)
then the values cij in column j of this matrix state the total amount of financial resources needed from the various countries i for an investment in country j in the amount of 1. As a gross value, they also include the financial resources contained indirectly through international capital linkages.
The savings in the individual countries that is contained in the total required financial resources then results as
(9)
(9)
with the row vectors s′ = (si) of the directly and indirectly contained savings and b′ = (bi) of the country-specific savings coefficients. Thus, for each country i, we can determine the total amount of savings, taking into account the international capital linkages, contained in an investment in a given country j, or conversely: the amount that can be lost in the case of a bad investment.
The equations formulated here correspond to the basic static model used in input–output analysis for the inter-industry linkages in an economy, and can be interpreted as follows: An investment in a country requires financial resources of equal value to those provided by a bank and refinanced out of domestic savings and capital imports in line with the country’s average financing structure. The capital imports are provided by the countries of origin in line with their financing structures. These again include capital imports, which in turn have to be financed by the countries of origin, and so on. In financing the investments in a country, there is thus a chain of creditor relationships that extends across many levels and that can be distributed across all countries through international financial linkages. In this way, the investments in each country not only contain funds from domestic savings directly but also contain savings from other countries indirectly. If an investment proves to be bad and if the credits cannot be repaid, then – if the principle of creditor liability is applied consistently – the losses are distributed across many countries through the international chain of creditor relationships. And in the end, original savers in all countries are affected.
3. Sources and processing of data
The data for Figure were compiled from various international sources and cover the 12-year period from 1999, the year when the euro was introduced, to 2010, the year of the Greek crisis. The cumulative amounts of financial flows reflect approximately the stock of debts or claims needed for the analysis. The figures on investment (vi) and saving (sj) in the various countries were obtained from the national accounts data published by the World Bank in its World Development Indicators. The figures on capital exports (cexpi) and imports (cimpj) were calculated from the balance of payments statistics and comprise portfolio, direct and other investment as well as changes in foreign reserves. The distribution of cumulative capital flows by country of origin and destination (xij) was done based on data from surveys by the IMF on bilateral portfolio and direct investment at the end of 2010. We were able to distinguish among 68 individual countries, among them important large countries and smaller offshore financial centers, and the group of all other countries. The list of countries is found in Table A5 in the appendix. The details on sources and processing of the data on international capital flows are as follows.Footnote2
The data on capital exports and imports were taken from the IMF balance of payments statistics. Looking at direct investment and ‘other’ investment for all countries together, these data result in around the same values for capital exports and capital imports (around 17 trillion USD each). With portfolio investment, the data on capital exports (around 15 trillion USD) result in a substantially lower value than the data on capital imports (around 25 trillion USD). Capital exports were therefore calculated as the sum of current account and capital accountFootnote3 minus changes in foreign reserves plus capital imports (for direct, portfolio and other investment) because the balance on the current and capital accounts, on the one hand, and the balance on the financial account including foreign currency reserves, on the other hand, have to offset each other. In this calculation, global capital exports come out to be around 4 trillion USD higher than reported capital exports. Significantly larger numbers were found for the USA, United Kingdom, Italy, and Germany. Including foreign currency reserves in the calculation (around 7 trillion USD) results in around 60 trillion USD for the period from 1999 to 2010 for all countries together, which corresponds to the value obtained for capital imports.
Data on the international capital linkages by country of origin and destination can be obtained from the IMF’s Coordinated Portfolio Investment Survey (CPIS) and Coordinated Direct Investment Survey (CDIS), which give the stock values of portfolio investment abroad as well as outward and inward direct investment for a large number of reporting countries and separated by partner countries. Some of the countries that are important for the analysis are not reporting for the surveys, however. This is true in particular of China and Saudi Arabia, and in the case of direct investment, of a number of smaller countries that are active in international finance (such as Bermuda, the Cayman Islands, Singapore, the Dutch Antilles). In the case of direct investment, the gap was largely closed by replacing the missing values for outward investment with data on inward investment of the reporting countries from the non-reporting countries. In this way, a 69 × 69 matrix was compiled for the portfolio and direct investment of 68 individual countries and the sum of the other countries with stock values from the end of 2010, which add up to around 65 trillion USD worldwide (including around 41 trillion USD in portfolio investment). This corresponds to the value obtained above of 60 trillion USD for the cumulative capital exports from 1999 to 2010 from the balance of payments statistics.
The estimated foreign currency reserves, which play a major role for China in particular, were assigned to the countries of investment and added to the matrix. Here, reference was made to the database of Gourinchas et al. (Citation2011),Footnote4 whose data on foreign currency reserves of 11 countries and 6 country groups can be broken down into USD, euros, British pounds, Swiss francs, and Japanese yen. The allocation of the reserves in euros to the individual euro-countries was done based on their share in the capital of the ECB.
In order to obtain a matrix of bilateral capital stocks for the model calculations, the cumulative capital exports from the balance of payments statistics were broken down by countries of destination and the cumulative capital imports from the balance of payments statistics were broken down by countries of origin using the country structures from the bilateral stock matrix with the addition of foreign currency reserves. Using the results of the two operations, the average was obtained such that the row and column totals of the bilateral matrix come as close as possible to the capital exports and imports from the balance of payments. In the case of a few very small and not independent countries for which there are no balance of payments statistics available, the values from the stock statistics were used for capital imports, and it was assumed that capital exports were equally large.Footnote5 This implies that these countries, due to their small size, are only transit countries for capital flows. Missing national accounts data on these countries were replaced by the assumption that their saving and domestic investment are equal to zero.
For the values of bilateral capital stocks estimated in this way, the consistency conditions in Figure are only approximately fulfilled. First, the difference between capital exports and imports from the balance of payments statistics differ from the balance of saving and investment from the national accounts data and there are gaps in the data that had to be filled in through a number of estimations. In the cases of Italy, Ireland, and Bulgaria, for instance, we find net capital imports but a more balanced or even positive savings position. Second, our final step calculating averages results in reductions or increases to the original deviations. Thus in our calculations, the capital balance appears too positive for France and Luxemburg, while it fits the net savings position of Ireland and Canada better and appears too negative for Brazil and Belgium. Overall, the balances of capital exports and imports from our bilateral matrix correspond fairly well with the balances of saving and investment. The countries with the largest surpluses of saving and thus net capital exports are China and Germany, followed by Russia, Saudi Arabia, Japan, the Netherlands, Norway, Singapore, and Switzerland. The countries with the largest saving deficits and thus the largest net capital imports are the USA, followed at a large distance by the United Kingdom, Spain, India, Greece, Portugal, Turkey, Mexico, and France.
All in all, the financing coefficients (aij and bj) calculated from the matrix should be sufficiently reliable and the model calculations carried out with it should at least provide the basis for estimating the general direction and size of the effects. The fact that data on domestic credit relations are lacking leads to underestimation of the overall volume of credit in question, but the results on the distribution of savings losses by country remain unaffected.
From 1999 to 2010, investments (v) and savings (s) worldwide add up to around 120 trillion USD each, capital exports and imports to around 60 trillion USD each (c). The countries with larger economies also have the largest savings and are thus ultimately the largest lenders. Correspondingly, the USA, China, Japan, Germany, France, Italy, and the United Kingdom are in the lead with savings volumes. International capital flows present a different picture. Here, not just the size and economic strength of the country play a role but also the importance and international integration of the country’s financial sector. The ranking list of capital exporters and thus of international lenders is again led by the USA, followed by the United Kingdom, Germany, and China. The 10 largest capital exporters, however, also include Luxembourg, Ireland, and the Netherlands. Smaller offshore financial centers have a very low volume of domestic saving and show not only high capital exports but also high capital imports. The financial center London makes itself apparent in British capital imports, which not only balance out the savings deficit in the United Kingdom but also flow into the country’s very high capital exports.
4. Results
The results of the model calculations for the euro-area countries that have slipped into crisis over the last few years are presented in Table (Greece) and Table (Ireland) as well as Tables A1 through A4 in the appendix (Portugal, Spain, Italy and Cyprus). The tables show, for an investment of 1 billion USD, the credit volume that is directly and indirectly dependent on it and the savings contained in it, both in total and for selected creditor countries. These are the 15 largest creditor countries as measured by capital exports and sorted according to the level of their capital exports from 1999 to 2010 (from the USA with well over 9 to Belgium with around 1 trillion USD). If the investment proves to be bad, the credits that have been made use of, both directly and indirectly, are defaulted on, and the savings contained in them is lost. To simplify the interpretation, in the following we use the term ‘credits’ although the funds being referred to also contain other forms of financing. The starting point is always a ‘bad investment’ in the sense that a credit for expenditures in the amount of 1 billion USD is not being repaid. The credits may also have been used to finance consumption spending.
Table 1. Credit and savings volume contained in a 1 billion USD investment: Greece.
Table 2. Credit and savings volume contained in a 1 billion USD investment: Ireland.
For a bad investment of 1 billion USD, the same amount of credits are defaulted on directly in the same country: ‘domestic direct’. In the case of Greece (Table ), these credits, in the amount of 550 million USD, are refinanced with capital imports from other countries, in which the same amount of credits again become non-performing: ‘indirect 1’ (corresponding to the coefficients aij). The further credit defaults, which occur in the second and all following rounds, add up to 410 million USD and are referred to as ‘indirect 2’. The total amount of indirect credit default thus amounts to 960 million USD. The total credit default – direct and indirect – amounts to around 2 billion USD (corresponding to the coefficients cij). The indirect credit defaults reflect the domino effect and here apply primarily to foreign lenders.Footnote6 In the country-level analysis, these defaults are larger, the higher the share of capital imports in total financing is. In the case of Greece, the effect of the contagion (at 960 million USD) is almost as large as the amount of the 1 billion USD credit that was provided directly for the bad investment and that has been defaulted on. Here, the foreign credit default in the first round (550 million USD) is higher than the credit default in the second and all subsequent rounds (410 million USD).
The lower part of the table gives the volume of domestic savings, which is lost on the various levels of credit default according to the savings coefficients in the individual creditor countries. Across all levels and all countries, it adds up to the amount of the bad investment~– here, 1 billion USD. In the case of Greece, almost half of the losses, at 450 million USD, are domestic Greek savings and slightly more than half, at 550 million USD, are savings from other countries (indirect 1 + 2), 320 million USD thereof in the first round (indirect 1) and 230 million USD in all further rounds of credit defaults (indirect 2). In total, the savings lost in other countries, at 550 million USD, corresponds to the indirect credit default in the first round, which is identical to capital imports contained in the financing of the bad investment of the country of investment. The distribution of savings losses across the individual countries differs, however, from their share in credit defaults.
Looking abroad, it is primarily savings in Germany and France that are affected (at 90 and 70 million USD or 16% and 12%, respectively, of the global effect), followed by China, the USA, and Russia. The largest credit defaults abroad are also borne by Germany (120 million USD or 13%), France, the USA, and China, followed by the United Kingdom, Luxembourg, and the Netherlands – the latter all countries with important international financial centers. Here, Germany, France, and China are already affected in the first round; the USA, United Kingdom, and Luxembourg primarily from the second round on, and the Netherlands on both levels.
In contrast, three quarters of those affected by credit default in Ireland (Table ) are foreign savers, primarily in the USA but also in Germany (90 million USD or 12%), the United Kingdom, and France. The role of London as an international financial center, which passes on most of its losses from credit defaults to savers in other countries, can be seen in the fact that the United Kingdom holds a much larger share of the non-performing credits than it does of the ultimately affected savings: In the case of Ireland, at 16% the United Kingdom (together with the USA) is the country most strongly affected by first-round credit defaults abroad, but it only has a 9% share of affected savings abroad. The case is the opposite with Germany: Here, the share of the affected savings is higher than the share of credit defaults.
In the case of Portugal (Table A1) a similar pattern as in Greece appears for the overall effects and the affected creditor countries. Here, however, following Germany and France the neighboring country Spain appears to be affected particularly severely. A credit default in Spain (Table A2), due to the size of the country, affects domestic savers to a much greater extent. Just over one third of the losses must be borne by foreigners, again primarily in Germany and France, followed by the USA and China. The effects of a credit default in Italy (Table A3) show a similar pattern, with domestic savers holding an even higher share of the lost savings. In Cyprus (Table A4), however, the foreign share in total losses is even larger than in Ireland.
The smaller a country is – for example, Cyprus and Ireland – the more its losses are passed on to savers in other countries. The larger a country is – such as Italy – and thus in possession of a more substantial volume of domestic savings, the more its losses are borne by domestic savers and the less savings abroad are affected. On the other hand, the larger the economy of a country in crisis is, the higher the absolute level of bad investments and thus also of losses abroad. If one takes domestic investments as a benchmark and sets Greece equal to 1, then the effects of credit defaults in Portugal and Ireland are similar in size, in the case of Spain and Italy five to six times the size, and in the case of Cyprus just one-thirteenth of the effect of credit default in Greece. Taking capital imports as a benchmark, Italy would ‘only’ have three times and Ireland six times while Cyprus would have one quarter the Greek effect.
The results for the selected countries of investment show that the (indirect) effects on savings by foreign creditors are not only significant in the first round but that they do play a substantial role in subsequent rounds, which can only be quantified with the aid of the model calculations. They also show that the shares of the individual creditor countries in the affected savings abroad may diverge significantly from their share in the indirect credit defaults in the first round, i.e. the capital imports of the country of investment. Thus, for example, the share of the USA in savings losses is much larger than the US share in capital imports. For Luxembourg and Ireland, in general the opposite is the case.
The significance of the indirect effects on savings is also evident in a comparison of the findings for all of the countries of investment considered in the model calculations. Table A5 in the appendix shows the credit volume depending directly and indirectly on an equally large investment and the savings contained therein for all investment countries. According this table, the total credit default abroad (domino effect) that would be caused by a bad investment of 1 billion USD is just 0.1–0.2 billion USD in countries that primarily finance their investments domestically, such as Kuwait, Saudi-Arabia, Venezuela, Argentina, China, India, Indonesia, Japan, and Korea, and as much as 2 billion USD or more in offshore financial centers like Curacao, Isle of Man, Bermuda, the Cayman Islands, Gibraltar, Guernsey, Jersey, and the Dutch Antilles, but also in Luxembourg. The effects abroad starting in the second round (indirect 2) are, in most cases, similarly large to those in the first round (indirect 1).
Also in a broader comparison, the results show that the effects of an equally large credit default on foreign creditors and savers tends to be larger for smaller countries. One reason for this is that foreign economic linkages play a more important role in relative terms in smaller countries than in larger ones. Second, it is primarily small countries with their tax incentives that have developed into centers for international financial transactions. Against this backdrop, the high indirect effects of a credit default in the United Kingdom is particularly noteworthy, which result from London’s role as an international financial center and from the high capital imports to finance the British savings deficit.
The German shares of affected savings abroad differ significantly by country of investment (see Table for selected investment countries and Table A5 in the appendix for all countries). Taking all of the rounds into account, it ranges from 2% in Bahrain and Barbados to between 18% and 20% in Poland, the Czech Republic, and Austria and all the way to more than 40% in Malta. The German share of losses to countries abroad in the first round varies even more widely, and is driven primarily by bilateral factors. The share of losses starting with the second round varies much less widely, and thus has a balancing effect. On average, it reflects the German share of global savings and capital exports (of 6% to 7%). In many cases, the total affected savings in Germany is larger than what the German share of capital imports by the investment country would suggest (affected credit volume indirect 1).
Table 3. Share of debt holders in Germany in % of those affected abroad for selected countries of investmenta.
The same is true of the other countries with the strongest economies and the largest savings. However, the amount of losses and the order of countries affected differs by investment country. Tables A6 and A7 in the appendix show, for each investment country, the 10 creditor countries that would be most heavily affected by losses abroad in the case of a credit default. Table A6 is based on the share of capital imports, Table A7 refers to the total affected savings, taking all the rounds into account. Among foreign savers, Germany is affected most of all when credits in European countries are not repaid. In other regions of the world, savers in the USA are more strongly affected by a credit default than other foreign savers. The same is true of many offshore areas. Japan is near the top of the ranking especially in Asian countries.
Table presents an excerpt of these results for the five creditor countries most strongly affected by credit defaults in the 10 largest net capital import countries. According to the credit volume affected abroad, the creditor countries found most frequently are the USA, United Kingdom, Germany, France, the Netherlands, Japan, Ireland, China, Spain, and Luxembourg. These are the 10 largest capital export countries. Regarding the savings lost the list of most affected countries shows a different ranking. It includes again the USA, Germany, France, United Kingom, Japan, China, and Spain, It does not include, however, the Netherlands, Ireland, and Luxembourg which do not have significant own savings.
Table 4. Creditor countries most strongly affected by credit defaults in selected countries of investmenta.
This pattern is confirmed taking into account the results for all investment countries considered in the model calculations. Table presents the 15 largest capital export countries and how frequently they appear among the top five and three most affected creditor countries when comparing the rankings in Tables A6 and A7 in the appendix. Looking at total affected savings, the USA is among the top five in all other 68 countries and in the top three most affected creditor countries in 61 countries. It is followed by Germany, Japan, United Kingdom, France, and China. The disproportionate effect on the USA results from its large savings funds and high capital exports; for Germany and France, savings and capital exports play a similar role. For the United Kingdom, the high capital exports play the primary role, whereas for Japan and China it is the high savings funds.
Table 5. The creditor countries found most frequently among the most affected countries.
Examining credit defaults based on capital imports figures (indirect 1), a different picture appears. Here, among the most frequently affected countries, the USA is followed by the Netherlands and Luxembourg, and all three are found even more frequently than Germany among the top five. In the case of Germany (in the top five 57 times for total savings and 29 times for capital imports), Japan (38 versus 13), and China (30 versus 8), the frequency of a high loss of savings is far underestimated if one considers direct capital imports from these countries alone. The case is reversed for countries like Luxembourg (0 versus 35), Ireland (0 versus 6), and the Netherlands (20 versus 40). They are affected primarily by credit defaults, but only a small amount of their domestic savings are affected.
5. Conclusions
The results of the model calculations allow us to answer two questions for each country: First, which foreign countries’ credit defaults affect this country the most, and second, which foreign countries would be most affected by a credit default in this country. There are two indicators that show the level to which countries are affected: first, the amount of credit defaults, and second, the original savings contained in that amount. The effects on other countries (contagion) can be determined easily for the first round with the financing coefficients on the basis of capital imports, but from the second round on, they can only be estimated through the model calculations. In most cases, they are just as high as in the first round. The country structure in subsequent rounds of credit defaults may also differ significantly from credit defaults in the first round.
If the principle of creditor liability is applied consistently across the entire credit chain, the countries that ultimately lose assets are those where the savings originated, which went directly and indirectly through international capital flows into the bad investment. Naturally, the largest countries are affected especially severely, since the largest amount of savings comes from them. Here the USA, Germany, and Japan are in the lead. These countries therefore have a large interest in saving the banks that provide the credits. The analysis clearly shows the role of small countries with large financial sectors such as Luxembourg, Ireland, and Cyprus, but also the United Kingdom with the London financial center. Smaller countries with high capital exports and imports are above all distributors of the losses to other countries and pass on the final losses primarily to the larger countries. But they, too, have an interest in saving banks in order to not to lose their business model and thus their source of income. The former would lose their assets, the latter would lose their business.
Germany is affected in particular by a credit default in other European countries. In view of its large volume of savings, Germany also ranks near the top in the case of a credit default in other parts of the world. Looking solely at the respective capital imports from Germany, the losses of German savings due to credit defaults in other countries are underestimated in many cases. The same is true of the USA and Japan; here, too, the analysis of the total affected savings volume shows the true dimension of losses.
The results of the model calculations are subject to a number of limitations. They apply only to an average pattern of different investment forms, to average financing structures, and to a situation where losses from the original credit default are passed on across all of the links in the creditor chain. The effects are smaller when the affected banks are able to absorb the losses. The results also depend crucially on the availability of reliable data on the international capital linkages. The model calculations do not allow conclusions to be drawn about the effects of a default on specific debts or differentiation by investment forms. Here, the investment losses of a country like China, which invested its capital abroad in relatively secure instruments such as US government bonds, tend to be overestimated. However, the results are likely to give a general impression of how and to what extent a debt crisis in a given country may affect creditors in other countries and what amount of original savings will ultimately be in danger.
It may be possible to improve the data used as the basis for our estimations by additionally evaluating data on bilateral bank credits from the Bank for International Settlements (BIS). What could also be helpful in this regard is a database currently under development by the EU countries that will be structured analogously to the portfolio statistics of the German Bundesbank and will provide data on bilateral portfolio stocks, broken down by sectors such as state, financial institutions, other companies, and private households. For a more in-depth analysis of specific cases, more precise model calculations can be carried out by modifying the coefficients of bilateral linkages, making risk estimates for the respective creditor positions. Thus the approach used here, carried out on the basis of international capital linkages, can supplement other analyses of possible contagion effects of financial crises, in which determinants like macroeconomic stability or exchange rate regimes are taken into account.
The support measures of the euro-countries and the rescue funds of the ECB were aimed at stabilizing the affected banks as a means of preventing financial losses from being passed on to the respective domestic savers. What was ultimately protected, however, were the savings of large economies and the business model of international financial centers. Previous measures for overcoming financial market crises have also had a significant distribution effect because the unequal distribution of wealth means that the richer members of society tend to benefit more while the costs are borne by taxpayers and thus distributed much more broadly. The recently launched ‘banking union’ with its stronger emphasis on creditor liability should reduce this effect.
Supplementary_Material.doc
Download MS Word (699.5 KB)Acknowledgements
I am grateful to Dietmar Edler for computing the inverse coefficients, to Mechthild Schrooten as well as Marius Clemens for valuable information on bilateral capital data, and to Hella Steinke for preparing the tables. For helpful comments and suggestions I am grateful to Jürgen Blazejczak, Axel Jochem, Reiner Stäglin, and last but not least, to an anonymous referee of this journal and the editor Bart Los.
Disclosure statement
No potential conflict of interest was reported by the author.
Notes
1 See Schumann’s (Citation2013) paper on Irish bank creditors that had to be rescued by the Irish government. The data of the Bank for International Settlements (BIS) on banks’ claims and liabilities are only available in aggregated form.
2 The data are available from the author on request.
3 Including the purchase/sale of intangible non-manufactured assets.
4 Gourinchs et al. (Citation2011) compiled a matrix of bilateral gross and net external positions matrices with data from the end of 2007 and 2008 for 11 countries and 3 country groups drawing on the two aforementioned IMF surveys with the addition of data from a number of national sources.
5 This is true of the Cayman Islands, Curacao, Gibraltar, Guernsey, the Isle of Man, Jersey, and Bermuda. For the Dutch Antilles, the higher value for capital exports was also assumed for capital imports.
6 It may also contain repercussions on the country of the bad investment insofar as other countries import capital from this country. Indirect credit defaults due to domestic bank linkages cannot be taken into consideration here due to the lack of data.
References
- Gourinchas, P.-O., H. Rey and K. Truempler (2011) The Financial Crisis and the Geography of Wealth Transfers. NBER Working Paper No. 17353, August. Published in 2012 as Global Financial Crisis, Journal of International Economics, 88, 266–283. doi: 10.1016/j.jinteco.2012.05.008
- Klein, L.R. (1983) Lectures in Econometrics. Amsterdam, North-Holland.
- Kubelec, Ch. and F. Sá (2010) The Geographical Composition of National External Balance Sheets: 1980–2005. Bank of England Working Paper 384, April.
- Leontief, W.W. and A. Bródy (1993) Money-flow Computations, Economic Systems Research, 5, 225–233. doi: 10.1080/09535319300000019
- Milesi-Ferretti, G.M., F. Strobbe and N. Tamirisa (2010) Bilateral Financial Linkages and Global Imbalances: A View on the Eve of the Financial Crisis. IMF Working Paper 10/247, November.
- Schumann, H. (2013) Staatsgeheimnis Bankenrettung. Der Tagesspiegel, February 24.
- Stone, R. (1966) The Social Accounts from a Consumer’s Point of View. Review of Income and Wealth, 12, 1–33. doi: 10.1111/j.1475-4991.1966.tb00709.x
- Tsujimura, K. and M. Mizoshita (2003) Asset-Liability-Matrix Analysis Derived From Flow-of-Funds Accounts: The Bank of Japan’s Quantitative Monetary Policy Examined. Economic Systems Research, 15, 51–67. doi: 10.1080/0953531032000056936
- Tsujimura, M. and K. Tsujimura (2011) Balance Sheet Economics of the Subprime Mortgage Crisis. Economic Systems Research, 23, 1–25. doi: 10.1080/09535314.2010.523414
- Upper, C. and A. Worms (2002) Estimating Bilateral Exposures in the German Interbank Market: Is there a Danger of Contagion? Economic Research Centre of the Deutsche Bundesbank, Discussion Paper 09/02.