
 ?Mathematical formulae have been encoded as MathML and are displayed in this HTML version using MathJax in order to improve their display. Uncheck the box to turn MathJax off. This feature requires Javascript. Click on a formula to zoom.
Abstract
China’s rapid economic development has caused considerable environmental problems in waste generation and treatment. One important reason for this is China’s manufacturing exports to other countries such as Japan, a major trading partner. However, the contribution of such importing countries has not yet been fully explored. This study quantitatively examined how final demand in trade between China and Japan affects both countries’ economies and waste generation. The results show that imports of final consumption goods from China to Japan induced enormous waste generation in China, while the wastes induced in Japan were negligible. Even if final demand exports from China to Japan are significantly economically beneficial to China, the cost to China from addressing the induced waste generation seems too much to make these exports worthwhile. To encourage constructive discussions, improvement of reliability and transparency of waste statistics in China that allows comparison with other countries would be significant.
1. Introduction
China has developed both rapidly and extensively since the policy of reform and ‘opening doors' was accelerated in the 1990s. However, the sharp rise in China’s economic development has also brought about a serious increase in environmental loads, such as GHG emissions, air pollution (Streets et al., Citation2006), water pollution, waste generation (Hicks et al., Citation2005; Leung et al., Citation2006; Terazono et al., Citation2004) and waste recycling Footnote1(Leung et al., Citation2006; Sepúlveda et al., Citation2010), all of which have caused serious environmental problems.
One of the underlying reasons for the environmental problems in China is the production and export of goods from China to other countries. For example, Streets et al. (Citation2006) reported the extent of export-related emissions of primary SO2, NOx, respirable suspended particulates (RSP) and volatile organic compositions (VOC) in the Pearl River Delta Economic Zone (PRDEZ). Wang et al. (Citation2020) conducted a multi-regional input-output analysis to estimate SO2 emissions embodied in China's international trade. Similarly, numerous researchers have investigated the effects of exports from China to other countries and the GHG emissions and energy consumption embodied in trade from China (Chen & Zhang, Citation2010; Gregg et al., Citation2008; Guan et al., Citation2009; Lin & Polenske, Citation1995; Peters et al., Citation2007; Peters & Hertwich, Citation2008; Weber et al., Citation2008; Zhang et al., Citation2015a). Exports from China contribute significantly towards the high levels of energy consumption (Lin & Polenske, Citation1995) and CO2 emissions (Guan et al., Citation2009; Peters et al., Citation2007; Weber et al., Citation2008) in the country. Further, the CO2 emissions embodied in exports from China have increased rapidly; for example, according to Sato (2014), the share of emissions embodied in exports relative to production-based emissions increased from 11–26% in 1995 to 25–37% in 2007. In international trade, the balance of CO2 emissions embodied in exports from China mostly exceeded that embodied in imports (Chen & Zhang, Citation2010; Davis & Caldeira, Citation2010; Peters & Hertwich, Citation2008; Sato, Citation2014; Wiedmann, Citation2016; Wiedmann et al., Citation2007; Xu et al., Citation2011; Zhang et al., Citation2015b; Zhu et al., Citation2018). Increases in China's non-CO2 GHG emissions (e.g. CH4, N2O, HFCs, PFCs and SF6) embodied in exports, have also been significant, accounting for 35.6% of total domestic emissions (Zhang et al., Citation2015b). While several studies have shown that China's CO2 emissions embodied in trade have tended to be overestimated (Liu et al., Citation2017; Su et al., Citation2013; Su & Ang, Citation2013), exports from China to developed countries, including Japan, are one of the primary factors responsible for China’s considerable CO2 emissions.
Although many researchers have examined the GHG emissions and energy consumption embodied in trade, other environmental loads, such as waste generation, have not been quantified sufficiently. Liang et al. (Citation2016) developed a Chinese environmentally extended input-output database (CEEIO) with environmental satellite accounts for 256 types of resources and 30 types of pollutants at five-year intervals over a 20-year period (i.e. 1992, 1997, 2002, 2007 and 2012); however, the CEEIO does not provide sufficient information about waste generation and waste treatment activities. The WIO analysis (WIOA) developed by Nakamura and Kondo (Citation2002) is one of the most effective approaches for evaluating the interdependence between the flow of goods and waste. Numerous researchers have conducted case studies using the WIO approach in countries and regions such as Japan (MOE Japan, Citation2018; Nakamura, Citation2020; Nakamura & Kondo, Citation2009), Taiwan (Liao et al., Citation2015), France (Beylot et al., Citation2016), and the UK (Salemdeeb et al., Citation2016). In Australia, Lenzen and Reynolds (Citation2014) extended the WIO framework to create waste supply-use tables (WSUTs), and developed a numerical example using Australian data, which was followed by the case study of Fry et al. (Citation2016). Lin and Nakamura (Citation2018) investigated options for mitigating China’s marine plastic pollution and CO2 emissions by employing a WIO-LP methodology with a Chinese WIO table for plastic waste for 2007. Lin (Citation2009) developed an extended WIO model (W2IO) to analyze wastewater in Tokyo. Xiao et al. (Citation2020) adapted the W2IO model and used it to estimate consumption-based wastewater and sludge footprints for Xiamen in China. However, they have not yet extended the scope of their analysis to evaluate the effects of exports in detail. None of these studies have examined waste generation in China within the context of how it is induced by exports.
In this study, we focused on the waste generation and waste treatment activities in China that are induced by developed countries, especially by Japan. As a result of the high levels of economic growth in China, numerous countries and areas are closely related to China in terms of trade; however, the relationship between Japan and China is particularly mutually beneficial. According to estimates by the Institute of Developing Economies Japan External Trade Organization (IDE-JETRO, Citation2019; Citation2020), exports from China to Japan amounted to approximately 180 billion US dollars (USD) in 2018 and 169 billion USD in 2019. Japan imported large amounts of final demand goods from China, which stimulated the manufacturing sector of China. As these manufacturing industries typically generate large amounts of industrial waste, it seems likely that there was a transfer of waste generation from Japan to China. Quantitative analysis is therefore necessary in order to clarify the amount of induced waste generation embodied in trade between Japan and China. In this study we attempted to quantitatively estimate the economic and environmental relationships between China and Japan using a China–Japan Interregional Waste Input-Output (CJWIO) approach. The findings of this study could be used for policymaking and negotiations between China and Japan.
This paper is structured as follows. In Section 2, we present the CJWIO model and data that we used for our estimates for the China–Japan Interregional Waste Input–Output Table 2014 (CJWIOT 2014). In Section 3, we present the main results, which show the direct and indirect effects that are induced by the final demands of both China and Japan in terms of their economies, waste generation and waste treatment. In section 4, we summarize our findings, focusing mainly on the limitations of waste-generation statistics from China. We then propose several topics for future research.
2. Model and data
In this study, we employed an interregional WIO model. shows the basic structure of the CJWIO Table (CJWIOT).Footnote2 We followed the notation of Lenzen and Reynolds (Citation2014) and Fry et al. (Citation2016). The table is essentially based on the multi-regional waste input-output (MRWIO) model of Kagawa et al. (Citation2007), which itself is an expansion of the conventional multi-regional input-output (MRIO) model of Isard (Citation1951) and the WIO model of Nakamura and Kondo (Citation2002). We applied the Municipal Solid Waste model of Habara et al. (Citation2002) to estimate the general waste produced by both countries, as we describe later in this section. As shown in , denotes the transactions of industrial sectors and shows the intermediate inputs of region s from region r. To represent the regions, we used C for China, J for Japan, and R for the rest of the world.
denotes the purchase of goods and services from industrial sectors in region r by waste treatment sectors in region s.
denotes waste generation by the industrial sectors in region s, which is treated in region r.
denotes waste generation by the waste treatment sectors in region s that is treated in region r.
denotes the consumption of goods and services in region r by the residents in region s.
denotes the waste generation by the residents in region s that is treated in region.
,
and
are monetary units, and
,
, and
are units of weight. Due to issues related to the lack of data, we assumed that the values of the matrix elements for waste generation and treatment activities in the rest of the world, i.e.
,
,
,
,
,
,
, and
are all zero.
Table 1. Basic structure of the China-Japan Interregional Waste Input-Output Table.
Equation (1) shows the WIOT (Nakamura & Kondo, Citation2002), using extended matrices:
(1)
(1)
where,
is an operator for
with the same number of elements as the target matrix.
(2)
(2)
and,
is the allocation matrix that is used to produce a square and symmetric WIOT. The element
is the ratio of the amount of waste k that is treated by the waste treatment activities i in region r.
For the MRWIO analysis conducted in this study, we estimated the indirect effects on the economies and environments of China and Japan based on the final demands of each country in three sectors: private consumption, government expenditure, and fixed capital formation. We define the input coefficient matrix for industrial sectors and waste treatment sectors as and
, respectively. The waste generation coefficient matrix for industrial sectors and waste treatment sectors can be defined as
and
, respectively. The ‘hat' over the vector
denotes a diagonal matrix with the element of the vector.
The equilibrium equation can be represented as follows:
(3)
(3)
The indirect effects of the final demand sector of China/Japan can be estimated by equation (3). By multiplying the waste generation coefficient matrices and
, we estimated the waste generation induced by the industrial sectors and waste treatment sectors of both countries. We also estimated CO2 emissions by multiplying the estimated CO2 emission coefficient matrices.
In the CJWIOT 2014 that we estimated in this study, the goods and services sectors in China and Japan were compiled using the WIOT 2014 of the WIOD Release 2016 (Dietzenbacher et al., Citation2013; Timmer et al., Citation2015; Timmer et al., Citation2016; WIOD, Citation2016), which is one of the most widespread multi-regional input-output tables (MRIOTs).
In the CJWIOT 2014, except for the waste treatment sectors, the data used for the industrial sectors, the final demand sectors, and the value-added in each industrial sector, are based on the WIOT 2014. The transactions of goods and services is dollar-based, and the currency exchange rates are taken as 0.16278 USD/CNY and 0.00946 USD/JPY. The waste treatment sectors in China and Japan were deducted from the industrial sector, ‘E37-E39 Sewerage; waste collection, treatment and disposal activities; materials recovery; remediation activities and other waste management services'; however, ‘Sewage' activity remains in T11CC and T11JJ. The sector classifications of the waste treatment sectors in China and Japan are shown in , and the number of waste treatment sectors in China, , is three and in Japan,
, is nine.
Table 2. Waste categories and sector classification of the waste treatment sectors in CJWIOT 2014.
The waste treatment sectors, waste generation, and CO2 emissions, were compiled following the same estimation method used for the CJWIOT 2007 (Lin et al., Citation2014; Lin & Tsukui, Citation2014; Tsukui & Lin, Citation2014a, Citation2014b). The waste categories used for China and Japan differed, as different sources were used for the waste statistics of each country shown in . In Japan, the total number of waste categories is 72; 29 categories for household waste, 17 for business waste, and 26 for industrial waste. The amount of waste generated by industry was estimated by referring to the Industrial Waste Generation and Treatment Survey 2016 (Ministry of Environment (MOE) of Japan, Citation2017), Iron and Steel, Non-ferrous Metal and Fabricated Metals Statistics (Ministry of Economy, Trade and Industry (METI) of Japan, 2014), and the value and quantity of Japanese input-output table 2015 (Ministry of Internal Affairs and Communications (MIC) of Japan, Citation2019). The amount of scrap metal was estimated using data from Trade Statistics Japan (Ministry of Finance (MOF) of Japan, Citation2014). Household waste and business waste were estimated using the Municipal Solid Waste model of Habara et al. (Citation2002), and statistics for the national population (Statistics Bureau of Japan, Citation2017), employment (Statistics Bureau of Japan, Citation2008, Citation2015), and the general waste generation (MOE, Citation2009, Citation2010, Citation2016) were also obtained. GHG emissions in Japan were estimated using the coefficients of 3EID (Nansai et al., Citation2008, Citation2019).
The total number of waste categories, , in China is 37: 29 categories for general waste and eight categories for industrial waste. However, there is practically only one industrial waste category and that is only for manufacturing industries. The China Statistical Yearbook for 2015 (National Bureau of Statistics of the People’s Republic of China (NBSPRC), Citation2008b, Citation2015b) gives the amount of ‘Common Industrial Solid Wastes Disposed' by the industrial sector, as well as the amount of waste generation minus the amount of waste recycled. As the composition of ‘Common Industrial Solid Wastes Disposed' was not provided, we classified it as ‘Others', as in . The amounts of the seven other industrial waste categories in China are all related to the waste transferred between Japan and China and were obtained from Japanese Trade Statistics (MOF Japan, Citation2014). Due to the limitations imposed by Chinese statistics, we used the Municipal Solid Waste model (MSW model) of Habara et al. (Citation2002) to estimate the general levels of waste generation in China. As the MSW model is based on a survey conducted in Japan, we intend to improve the estimates of the model in the future. We referred to the ‘China Statistical Yearbook' (NBSPRC, Citation2015b) for the total amount of general waste for China. In addition, we divided general waste into 29 waste categories by applying the waste generation per person/employee by waste category, as estimated using the Municipal Solid Waste model of Habara et al. (Citation2002). Since CO2 emissions data are not officially released in China, we referred to Shan et al. (Citation2018), who estimated the energy-related CO2 emissions (17 fossil fuels in 47 sectors) and process-related emissions (cement production) using the Intergovernmental Panel on Climate Change (IPCC) emissions accounting method (IPCC, Citation2007). We allocated the CO2 emission inventories (Shan et al., Citation2018) to the WIOD industrial sectors based on the fuel consumption in each sector.
3. Results
3.1. Direct and indirect effects of final demand in China and Japan
The estimation results of the CJWIOT 2014 revealed economic and environmental structural differences between China and Japan. The differences in the amounts of waste generated in both countries are considerably larger than the difference in the scales of the economies of China and Japan. Specifically, waste generation in the industrial sectors and the waste treatment sectors of China is relatively larger than it is in Japan. The production value and GDP are approximately 31.8 trillion USD and 10.4 trillion USD in China, which are considerably larger than the 8.7 trillion USD and 4.5 trillion USD for Japan, respectively. The amount of waste generation considering recycling in China is estimated at 1031.7 million tonnes, and that in Japan is estimated at 43.2 million tonnes, indicating that the Chinese waste generation per production value is 6.5 times larger than that of Japan. The waste generation per production value is typically larger in manufacturing industries than it is in service industries. The results reflect the differences in the economic structure of both countries because China’s main industries are manufacturing industries, which accounted for 50% of the Chinese production value (15.9 trillion USD). However, Japan’s economic structure is becoming increasingly service-oriented, and its manufacturing industry only accounted for 31% of its total production value (2.7 trillion dollars) in 2014. As mentioned in Section 1, we obtained only limited information about Chinese waste generation. We will consider the issue of Chinese waste generation and its composition in ‘4.1 Limitations of waste-generation statistics for the industrial waste from China'.
shows the indirect effects of final consumption and the mutual effects that China and Japan have on each other. The indirect effects on China by the final demand of goods and services in Japan is about 1.8 times larger than that on Japan by the final demand of goods and services in China. The indirect effects on China by the final demand of goods and services in Japan accounted for about 513 billion USD, while the indirect effects of the final demand of goods and services in China on Japan accounted for about 285 billion USD.
Figure 1. Indirect effects of the final consumption of China and Japan.
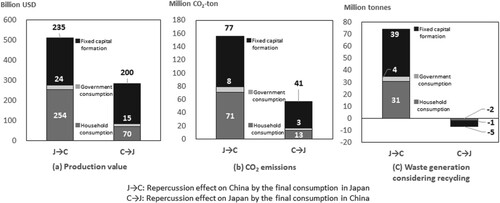
However, the induced CO2 emissions and waste generation were both markedly larger in China than in Japan; Japanese final consumption induced about 156 million t-CO2-eq in China, while Chinese final consumption only induced about 57 million t-CO2-eq in Japan. The amount of waste induced by Japanese final consumption in China was approximately 74 million tonnes. On the other hand, China’s final consumption induced a reduction in the amount of waste to be treated in Japan, which accounted for 6.0 million tonnes; this was due to the recycling activities in Japan and the exports of waste resources from Japan to China. The base year of the CJWIOT is 2014, which is before China’s waste import ban was enforced. China imported 2.2 million tonnes of wastepaper, 1.9 million tonnes of scrap metal, and 0.7 million tonnes of waste plastic in 2014. China’s final consumption induced an increase in the activity of industrial sectors in China, which in turn increased waste material imports from Japan. The effect of China’s waste import ban will be considered in subsection ‘3.3. Individual contributions of the final demands considered in this study'. As shown in , ‘Final consumption expenditure by household' (‘Household consumption') and ‘Gross fixed capital formation' (‘Fixed capital formation') in Japan contributed significantly to the induced production values and environmental loads in China.
The detailed results in Tables and show the induced effect of ‘Final consumption expenditure by household' in Japan and ‘Gross fixed capital formation' in Japan on China’s industrial sectors. As shown in , ‘Final consumption expenditure by household' in Japan induced about 254 billion USD in China, mainly from the ‘C13-C15 Manufacture of textiles, wearing apparel and leather products' (20%), ‘C10-C12 Manufacture of food products, beverages and tobacco products' (9%), ‘C26 Manufacture of computer, electronic and optical products' (7%), and ‘C20 Manufacture of chemicals and chemical products' industry (7%). Japanese household expenditure also induced about 26.5 million tonnes of industrial waste, mainly through ‘B Mining' (43%), ‘D35 Electricity, gas, steam and air conditioning supply’ (17%), ‘C20 Manufacture of chemicals and chemical products' (15%), and ‘C24 Manufacture of basic metals' (14%), which accounted for approximately 89% of total industrial waste. Approximately 63.9 million t-CO2-eq of CO2 emissions were also induced in China by Japanese household expenditure, mainly in the ‘D35 Electricity, gas, steam and air conditioning supply' (46%), ‘C24 Manufacture of basic metals' (20%), ‘C23 Manufacture of other non-metallic mineral products' (7%), and ‘C20 Manufacture of chemicals and chemical products' (6%) sectors.
Table 3. Japanese final demand and repercussion effects on China (final consumption expenditure by households).
Table 4. Japanese final demand and the repercussion effects on China (gross fixed capital formation).
‘Gross fixed capital formation' in Japan also had large economic and environmental effects on China. A total of 235 billion USD of production value in China was induced by Japanese gross fixed capital formation mainly by ‘C26 Manufacture of computer, electronic and optical products' (28%), ‘C27 Manufacture of electrical equipment' (9%), ‘C24 Manufacture of basic metals' (8%), and ‘C20 Manufacture of chemicals and chemical products' (5%) and ‘C25 Manufacture of fabricated metal products, except machinery and equipment' (5%). Approximately 27 million tonnes of industrial waste, mainly from ‘C24 Manufacture of basic metals' (22%) and ‘D35 Electricity, gas, steam and air conditioning supply' (17%) and ‘C20 Manufacture of chemicals and chemical products' industrial sectors (10%). In addition, 69 million t-CO2-eq of CO2 emissions was also induced in China by ‘Gross fixed capital formation' in Japan, mainly by ‘D35 Electricity, gas, steam and air conditioning supply' (43%), ‘C24 Manufacture of basic metals' (29%), and ‘C23 Manufacture of other non-metallic mineral products' (10%).
3.2. Direct and indirect effects on waste treatment sectors
According to estimates of the direct and indirect effects of the waste treatment sectors in China and Japan, the percentage of the total activities of the waste treatment sector is not large in terms of the production value and GDP. According to the estimated CJWIOT 2014, the production value of the waste treatment sectors in China only accounted for 0.3% (94.7 billion USD) of the total, while that in Japan is 0.04% (3.2 billion USD) of the total. The GDP of the waste treatment sectors in China only accounted for 0.3% (29.8 billion USD) of the total, and that in Japan only accounted for 0.06% (2.6 billion USD) of the total. However, the amount of waste from the waste treatment sector in China was about 75.6 million tonnes, which is equivalent to approximately 7.3% of the total amount of waste to be treated in China. On the other hand, in Japan, 1.3 million tonnes (3.0%) of waste was generated by the waste treatment sector. The waste treatment sectors in China and Japan emitted 374.9 and 114.4 million t-CO2-eq, respectively.
Based on estimates of induced waste generation, Japanese final demand induced 5.7 million tonnes of waste in Chinese waste treatment sectors. The contribution of ‘Final consumption expenditure by household’ and ‘Gross fixed capital formation' in Japan on waste generation by waste treatment activities in China is also large, accounting for 2.4 million tonnes and 2.9 million tonnes, respectively.
3.3. Trade of waste resources between China and Japan
As described in subsection 2.1, before the implementation of China’s waste import ban in 2018 (Li, Citation2018; Ministry of Industry and Information Technology of the People’s Republic of China, Citation2009), Japan also exported waste resources to China; these resources accounted for 8.3 million tonnes in 2014 (MOF Japan, Citation2014). Conversely, the amount of the waste resources exported from China to Japan was only 19.6 thousand tonnes, 97% of which was metal waste.Footnote3
The amount of waste that is transported and induced by the final demand of both countries was also estimated. As shown in , Japan's final demand induced 4.9 million tonnes of waste being transported from Japan to China, which is approximately 452 times larger than the 10.9 thousand tonnes induced by China in Japan. China's final demand induced the transportation of 591.9 thousand tonnes of waste from Japan to China, which is 384 times larger than that from China to Japan and accounted for 1.5 thousand tonnes. As we have already shown in subsection 2.1 and , the increase in Japan’s final demand stimulated activity in China’s industrial sector. The increase in activity in Japan’s industrial sector caused an increase in waste generation and some of those waste resources were transported from Japan to China.
Table 5. Induced waste transportation from Japan to China by industry.
Table 6. Waste composition of China’s industrial sector estimated using Japanese waste generation coefficients.
Since most of the waste that is transported between China and Japan is from Japan to China, primarily due to Japan's final demand, we focused on this data. ‘Gross fixed capital formation' in Japan induced 2.5 million tonnes, or 51%, of the total of 4.9 million tonnes of waste being transported from Japan to China. ‘Final consumption expenditure by household' in Japan induced 2.0 million tonnes (40%) of the total amount of induced waste transported from Japan to China due to Japanese final demand. ‘Metal waste' is mainly generated by ‘C24 Manufacture of basic metals’, ‘C25 Manufacture of fabricated metal products, except machinery and equipment', and ‘C28 Manufacture of machinery and equipment n.e.c.’. ‘Waste plastics' are mainly generated by ‘F Construction', ‘G45 Wholesale and retail trade and repair of motor vehicles and motorcycles', and ‘C22 Manufacture of rubber and plastic products' and several other industries. ‘Waste paper' is mainly generated by ‘G47 Retail trade, except motor vehicles and motorcycles', ‘C17 Manufacture of paper and paper products' and ‘F Construction' and a variety of other industries.
4. Discussion
4.1. Limitations of waste-generation statistics for industrial waste from China
Before any conclusions can be drawn, examining the difference in industrial waste statistics between Japan and China is necessary. The MOE of Japan publishes annual statistics for the amounts of industrial waste in 19 categories (MOE Japan, Citation2017). We were able to categorize 26 categories of industrial waste using MOE statistics and other statistics in Japan (METI Japan, Citation2014; MIC Japan, Citation2019). However, as described in Section 1, the base statistics used to compile the CJWIOT 2014 (NBSPRC, Citation2015b) only covered manufacturing industries. For example, ‘A01 Crop and animal production, hunting and related service activities (A01 Agriculture)', ‘A02 Forestry and logging', ‘A03 Fishing and aquaculture' and ‘F Construction' and service industries, such as from ‘E37-E39’ to ‘U' in the WIOD industrial sector categorization (WIOD, Citation2016) are not covered in Chinese statistics. Moreover, as the Chinese statistics do not provide the composition of the waste by industry, it is difficult to assess whether the waste generation per production value between China and Japan is due to the lack of statistics or intrinsic differences in both countries.
If it is assumed that the production activities in sectors were similar between China and Japan, then the waste generation coefficient, , the waste generation per production value,
, should also be similar. We correlated the sector classification of
and
, and calculated the Japanese waste generation coefficient by Chinese sector classification
, the amount of waste generated in China,
, which was obtained by multiplying the Japanese waste generation coefficient and the production value of China for each industrial sector, and then compared
with
, which is the estimated waste generation in CJWIOT 2014.
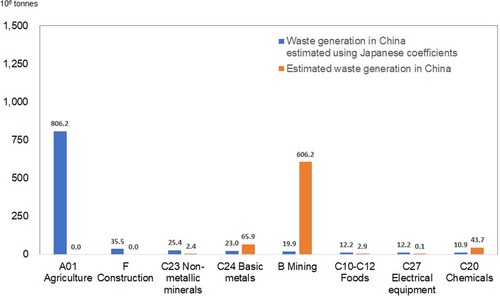
We compared and
in 27 of 56 industrial sectors in the CJWIOT 2014.Footnote4 shows the highlights of the comparison; interestingly, waste generation per production value by industry is quite different between Japan and China. The blue bars indicate waste generation in China,
, as estimated by the CJWIOT 2014. The orange bars indicate the amount of waste generated in China, which was obtained by multiplying the Japanese waste generation coefficient and the production value for China for each industrial sector
. The total amount of
was 998 million tonnes, which is considerably larger than the 783 million tonnes obtained for
. In most industries,
was smaller than
.
Figure 2. Comparison of waste generation estimated by the waste coefficient for China and Japan.
shows hypothetical estimates of Chinese statistics for the category of ‘Other' waste that were obtained using Japanese waste generation coefficients.
In some industries, the reason for the difference between and
is that the production activities of Japan and China are intrinsically different. For example, ‘B Mining and quarrying (“Mining” in )’ is one of the main industries in China with a production value of 1.2 trillion USD; however, in Japan, the production activity associated with mining is quite low and the production value is only approximately 35.9 billion USD.
Another reason for the difference between and
may be attributed to the relative lack of Chinese statistics. Waste generation from the industrial sectors C10-C12 to E37-E39 can be obtained from the statistics, but A01-A03 and F are not considered in the first place. It is likely that at least some amounts of ‘Animal & vegetable residue' and ‘Sludge' were generated by the ‘C10-C12 Manufacture of food products, beverages and tobacco products' sector. It is also likely that at least some amounts of ‘Waste alkali', ‘Sludge’, ‘Waste oil', and ‘Waste acid’ were generated by the ‘C20 Manufacture of chemicals and chemical products' sector, and that ‘Waste glass, cement, and ceramics' were generated by the ‘C23 Manufacture of other non-metallic mineral products' sector.
Fortunately, there are several solutions to this problem. The Chinese government has started to conduct extensive environmental surveys, so it is important to scrutinize the most recent statistics. We can also estimate the amount of waste generated by constructing models. For example, if accurate data can be obtained for the number of livestock, then the amount of livestock excreta can be estimated for ‘A01 Crop and animal production, hunting and related service activities' sector. Potential future research might aim to develop estimation methods and refine the industrial waste estimates for China.
There is potential for improving the estimates obtained from the mining sector. implies that the waste generation coefficient for the mining sector in China is much larger than that in Japan. As the environmental loads associated with mining are serious in China, we would like to divide the mining sector in China into different minerals, such as coal, copper, lead, zinc, and rare earth elements, for analysis in future research.
4.2. Sharing responsibility between Chinese producers and Japanese consumers
The results presented in Section 2 show that the final consumption in Japan induced large amounts of waste generation and CO2 emissions in China. Although Japanese final demand also induced large, positive economic effects, Japanese consumers have a certain level of responsibility for environmental loads in China. The problem is how to share this responsibility between the two countries. The results of this study imply that the reliability of the statistical data for both countries, especially in China, is the most important issue for sharing responsibility between consumption and production in both countries.
In the area of policy implementation, there are two ways in which this responsibility can be shared between China and Japan; a bilateral framework or a global framework. A bilateral framework generally requires less time for both decision making and negotiations compared to a global framework. However, at the level of the global supply chain, global frameworks also need to be considered. In both frameworks, transparent and robust statistical data are necessary.
The problem of how to share responsibility is essentially one of how to assign a weight to the responsibilities of producers and consumers (Zhu et al., Citation2018). Numerous indicators have been developed to quantify the relative share of these weights; for example, there are value-added-based methods (Lenzen et al., Citation2007), income-based methods (Marques et al., Citation2012), beneficiary-based methods (Csutora & Mózner, Citation2014), and intensity-based methods (Zhu et al., Citation2018). Cadarso et al. (Citation2012) employed the approach of Lenzen et al. (Citation2007) by incorporating weightings for responsibility into the model proposed by Peter (Citation2008) for analyzing the impact of international trade on CO2 emissions. In a bilateral framework, the approach of Cadarso et al. (Citation2012) could also be appropriate for sharing responsibility. In a global framework, it may be appropriate to incorporate Global Value Chain (GVC) research (Timmer et al., Citation2013; Koopman et al., Citation2014; Timmer et al., Citation2014; Timmer et al., Citation2015; Wang et al., Citation2013, Citation2017) into the responsibility-sharing models (Cadarso et al., Citation2012; Lenzen et al., Citation2007; Peter, Citation2008). However, as mentioned by Peter (Citation2008), sharing responsibility while considering consumer responsibility is difficult because of its high complexity, low transparency, and the high levels of uncertainty associated with the consumption-based National Emission Inventories. As transparency and reliability associated with the estimates of responsibility vary markedly depending on the reliability of environmental statistics, the reliability of the statistics is a crucial issue in any negotiation.
Given the number of issues related to the reliability of environmental statistics in China (see Section 3), implementation of any policy focusing on sharing responsibility between China and Japan would be extremely difficult. Before China and Japan can start to talk about sharing responsibility, consensus needs to be reached on the environmental statistics that are to be used by both countries. In addition, both countries, especially China, should aim to improve the collation and publication of their environmental statistics. For example, while the amount of waste generated by the industrial sector is published in China (NBSPRC, Citation2008a, Citation2008b, Citation2009, Citation2015a, Citation2015b), the amount of waste generated in each waste category does not seem to be recorded. Similarly, the amounts of waste transported between regions in China are also not published or recorded. As the Japanese government, especially the Ministry of the Environment and the METI, have cooperated extensively with the Chinese government on environmental issues over the last 25 years, the Japanese government would likely support China in addressing these issues (JC-BASE, Citation2019; METI Japan, Citation2018; MOE Japan, Citation2019a, Citation2019b).
4.3. The effect of China’s waste import ban
China’s waste import ban (Li, Citation2018) has had a marked impact on the global waste trade of both advanced and developing countries (Brooks et al., Citation2018; Liu et al., Citation2018; Qu et al., Citation2019), and Japan is one of these countries (Nikkei, Citation2019a, Citation2019b). However, China’s waste import ban has presented Japan with the opportunity to boost its domestic waste plastic recycling, especially with regard to plastic bottles. Chinese imports of waste plastic bottles from Japan appeared to have had a dampening effect on Japanese plastic bottle waste recycling, because although Japan increased domestic recycling of plastic bottles after promulgation of the Containers and Packaging Recycling Law in 2000, approximately 50% of waste plastic bottles in Japan were exported to China (The Council for PET Bottle Recycling, Citation2019). In 2004, four years after the promulgation of the Containers and Packaging Recycling Law, we conducted an interview at a plastic bottle recycling facility (Sapporo City Environment Public Corporation, Citation2019) in Hokkaido City in Japan. There were two recycling lines at the facility; however, one was not operational due to a shortage of plastic waste resulting from waste plastics being exported to China. This is not a small, isolated example; numerous researchers in Japan have identified Chinese imports of waste plastics from Japan as being one of the main reasons for decreasing recycling activities in Japan. Chinese imports of waste plastics from Japan resulted in an increase in the cost of waste plastic bottle treatment in recycling facilities in Japan (Hosoda et al., Citation2015; Nakatani et al., Citation2008; Satake et al., Citation2010; Terazono et al., Citation2004). In the short term, domestic recycling in Japan may take some time to recover. After China’s waste import ban, Japan changed the destinations for waste plastic export from China and Hong Kong to Malaysia, Thailand, Taiwan, Vietnam, Korea, and other southeast Asian countries (MOF Japan, Citation2017, Citation2018, Citation2019, Citation2020). In these countries, imports of waste plastics from Japan more than doubled from 389 thousand tonnes in 2017–849 thousand tonnes in 2018. However, the total quantity of waste plastics exported by Japan has decreased slightly in recent years; for example, 17% (1.4 million tonnes) of waste plastics was exported in 2017, 12% (1.0 million tonnes) in 2018, and 11% (0.9 million tonnes) in 2019, which implies that domestic waste recycling has increased in Japan (MOF Japan, Citation2017, Citation2018, Citation2019, Citation2020; Plastic Waste Management Institute, Citation2021). China’s waste import ban has therefore provided international opportunities for the establishment of fair-trade systems for waste reutilization among countries, reducing waste generation and environmental loads, and encouraging domestic recycling activities in individual countries (Liu et al., Citation2018; Nakatani et al., Citation2008; Terazono et al., Citation2004).
5. Conclusions
Generally speaking, manufacturing industries generate more waste than service industries, both in terms of total amount and per production value. As the Japanese economy is shifting from manufacturing to services, it was easy to predict that the final demand goods imported from China to Japan would induce a larger amount of waste generation in China than vice versa. However, the results obtained about induced waste generation in China were far beyond what we expected. In this study, we quantitatively examined the waste generation induced by the trade between China and Japan by compiling a China–Japan interregional waste input-output table for 2014 (CJWIOT 2014). Although the final demand of each country stimulates the economy of the other, the induced environmental loads, such as waste generation and CO2 emissions, are significantly larger in China than in Japan. The amount of waste induced in China by trade with Japan was considerable, being approximately 74 million tonnes, while that in Japan was negligible. Even with the inducement to China of final demand exports from China to Japan of 513 billion USD in production value, China’s cost to address environmental issues caused by the induced waste generation seems be too much to make this worthwhile.
Wang et al. (Citation2020) argued that there is a trade-off between economic benefits and sulphur dioxide emissions embodied in global trade, emphasizing the inequality with developed countries. Unlike CO2 emissions but like SO2 emissions, waste generation tends to cause environmental issues in the country where it is generated. It would not be surprising if a similar argument could be made with regard to waste as that of Wang et al. (Citation2020). There is no doubt that the environmental problems currently facing China are serious. Indeed, the severity of the waste problem prompted the Chinese government to implement a waste import ban in 2018. However, even if direct waste imports are restricted, large amounts of waste are induced by trading partners, such as Japan. Nonetheless, robust discussions and policy development aimed at sharing responsibility for the waste generation embodied within the trade have not yet occurred. The results in this study showed that the Japanese consumers’ responsibility with regard to China is far from negligible. However, to encourage policy discussions about waste, it is necessary to improve the collection, collation, and transparency of Chinese waste statistics so that they can be compared with those of other countries. Currently, China’s waste statistics do not classify industrial waste into detailed categories according to sector (NBSPRC, Citation2020), and this lack of resolution may hinder future discussions about the relative extent of responsibility of Japan and other trading partners. An open discussion based on reliable statistics and considering responsibility could encourage cooperation among countries, especially between China and Japan, for reducing waste generation and the associated environmental problems. The analytical approach developed in this study is applicable to estimating the waste generation inducement and transportation related to other countries, and should contribute to support multilateral policymaking.
Acknowledgments
I am deeply grateful to Mr. Takazumi Sato who helped us with the data compilation. We wish to thank Mr. Lorenz from Forte Inc. for proofreading this manuscript.
Disclosure statement
No potential conflict of interest was reported by the author(s).
Additional information
Funding
Notes
1 Environmental contamination, especially in the informal waste electrical and electronic equipment (WEEE) sector, is very serious (Leung et al., Citation2006) and is one of the reasons why China promulgated WEEE regulation (Ministry of Industry and Information Technology of the People’s Republic of China, Citation2009) and implemented a waste import ban in 2018 (Li, Citation2018).
2 We define the MRIO model in a broad sense and use the definitions for both the Isard model and the Chenery-Moses model. See Footnote 2 of Hasegawa et al. (Citation2015) and Wiedmann et al. (Citation2007).
3 We assumed that Japan also exported WEEE to China (Terazono et al., 2009; Terazono & Yoshida, Citation2012); however, due to limitations in the trade data available, distinguishing between second-hand electronic equipment and WEEE was difficult. We therefore did not attempt to evaluate the flow of WEEE in this study.
4 The other 29 sectors, E37-E39' to ‘U', are service industry sectors for which no statistical data is available in China. We therefore estimated the amount of waste generation using the Municipal Solid Waste model of Habara et al. (Citation2002), as mentioned in Section 2.
References
- Beylot, A., Poitier, B., Lancesseur, N., & Villeneuve, J. (2016). A consumption approach to wastes from economic activities. Waste Management, 49, 505–515. https://doi.org/10.1016/j.wasman.2016.01.023
- Brooks, A. L., Wang, S., & Jambeck, J. R. (2018). The Chinese import ban and its impact on global plastic waste trade. Science Advances, 4(6). https://doi.org/10.1126/sciadv.aat0131
- Cadarso, M. A., Lopez, L. A., Comez, N., & Tobarra, M. A. (2012). International trade and shared environmental responsibility by sector: An Application to the spanish economy. Ecological Economics, 83(83), 221–235. https://doi.org/10.1016/j.ecolecon.2012.05.009
- Chen, G. Q., & Zhang, B. (2010). Greenhouse Gas emissions in China 2007: Inventory and input–output analysis. Energy Policy, 38(10), 6180–6193. https://doi.org/10.1016/j.enpol.2010.06.004
- Csutora, M., & Mózner, Z. V. (2014). Proposing a beneficiary-based shared responsibility approach for calculating national carbon accounts during the post-kyoto era. Climate Policy, 14(5), 599–616. https://doi.org/10.1080/14693062.2014.905442
- Davis, S. J., & Caldeira, K. (2010). Consumption-based accounting of CO emissions. Proceedings of National Academy of Sciences of the United States of America, 107(12), 5687–5692. https://doi.org/10.1073/pnas.0906974107
- Dietzenbacher, E., Los, B., Stehrer, R., Timmer, M., & de Vries, G. (2013). The Construction of World Input–Output Tables in the WIOD project. Economic Systems Research, 25(1), 71–98. https://doi.org/10.1080/09535314.2012.761180
- Fry, J., Lenzen, M., Giurco, D., & Pauliuk, S. (2016). An Australian multi-regional waste Supply-Use framework. Journal of Industrial Ecology, 20(6), 1295–1305. https://doi.org/10.1111/jiec.12376
- Gregg, J. S., Andres, R. J., & Marland, G. (2008). China: Emissions pattern of the world leader in CO2 emissions from fossil fuel consumption and cement production. Geophysical Research Letters, 35(8), L08806. https://doi.org/10.1029/2007GL032887
- Guan, D., Peters, G. P., Weber, C. L., & Hubacek, K. (2009). Journey to world top emitter – an analysis of the driving forces of China's recent CO2 emissions surge. Geophysical Research Letters, 36(4). https://doi.org/10.1029/2008GL036540
- Habara, H., Matsuto, T., & Tanaka, N. (2002). Estimation model for commercial waste stream by type of Business activities. Journal of the Japan Society of Waste Management Experts, 13(5), 315–324. (in Japanese). https://doi.org/10.3985/jswme.13.315
- Hasegawa, R., Kagawa, S., & Tsukui, M. (2015). Carbon footprint analysis through constructing a multi-region input–output table: A case study of Japan. Journal of Economic Structures, https://doi.org/10.1186/s40008-015-0015-6
- Hicks, C., Dietmar, R., & Eugster, M. (2005). The recycling and disposal of electrical and electronic waste in China—legislative and market responses. Environmental Impact Assessment Review, 25(5), 459–471. https://doi.org/10.1016/j.eiar.2005.04.007
- Hosoda, E., Ichinose, D., Saito, T., Sekiyama, T., Someno, K., Nakatani, J., & Yamamoto, M. (2015). Comprehensive Studies on Development and Expansion of a Recycling-System for a Purpose of Cultivating Venous Industries in Developing Countries, Research Report for the Environment Research and Technology Development Fund for year 2014 (in Japanese).
- IDE-JETRO. (2019). Trade between Japan and China in year 2018. Retrieved March 5, 2019, from https://www.jetro.go.jp/ext_images/_Reports/01/275fdcb1f46d0f9f/20180049.pdf (in Japanese).
- IDE-JETRO. (2020). Trade between Japan and China in year 2019, Retrieved March 29, 2021, from https://www.jetro.go.jp/biz/areareports/2020/7a3c80fbbd73f456.html. (in Japanese).
- International Panel on Climate Change (IPCC). (2007). 2006 IPCC guidelines for national greenhouse gas inventories. Retrieved January 4, 2007, from https://www.ipcc-nggip.iges.or.jp/public/2006gl/index.html.
- Isard, W. (1951). Interregional and regional input–output analysis: A model of a space economy. The Review of Economics and Statistics, 33(4), 318–328. https://doi.org/10.2307/1926459
- Japan-China Business Alliance for Energy Saving and Environmental Protection (JC-BASE). (2019). Japan-China Energy Conservation and Environment Forum. Retrieved February 20, 2019, from http://www.jc-web.or.jp/jcbase/publics/index/46/ (in Japanese).
- Kagawa, S., Nakamura, S., Inamura, H., & Yamada, M. (2007). Measuring spatial repercussion effects of regional waste management. Resources Conservation & Recycling, 51(1), 41–174. https://doi.org/10.1016/j.resconrec.2006.09.001
- Koopman, R., Wang, Z., & Wei, S.-J. (2014). Tracing Value-added and double counting in Gross exports. American Economic Review, 104(2), 459–494. https://doi.org/10.1257/aer.104.2.459
- Lenzen, M., Murray, J., Sack, F., & Wiedmann, T. (2007). Shared producer and consumer responsibility—Theory and practice. Ecological Economics, 61(1), 27–42. https://doi.org/10.1016/j.ecolecon.2006.05.018
- Lenzen, M., & Reynolds, C. J. (2014). A Supply-Use approach to Waste Input-Output analysis. Journal of Industrial Ecology, 18(2), 212–226. https://doi.org/10.1111/jiec.12105
- Leung, A., Cai, Z. W., & Wong, M. H. (2006). Environmental contamination from electronic waste recycling at Guiyu, southeast China”. Journal of Material Cycles and Waste Management, 8(1), 21–33. https://doi.org/10.1007/s10163-005-0141-6
- Li, K. (2018). Report on Government Work for the13th National People’s Congress. Retrieved March 26, 2019, from http://www.gov.cn/zhuanti/2018lh/2018zfgzbg/zfgzbg.htm (in Chinese).
- Liang, S., Feng, T., Qu, S., Chiu, A. S. F., Jia, X., & Xu, M. (2016). Developing the Chinese Environmentally Extended Input-Output (CEEIO) database. Journal of Industrial Ecology, 21(4), 953–965. https://doi.org/10.1111/jiec.12477
- Liao, M., Chen, P., Ma, H., & Nakamura, S. (2015). Identification of the driving force of waste generation using a high-resolution waste input–output table. Journal of Cleaner Products, 94, 294–303. https://doi.org/10.1016/j.jclepro.2015.02.002
- Lin, C. (2009). Hybrid input−output analysis of wastewater treatment and environmental impacts: A case study for the Tokyo Metropolis. Ecological Economics, 68(7), 2096–2105. https://doi.org/10.1016/j.ecolecon.2009.02.002
- Lin, C., & Nakamura, S. (2018). Approaches to solving China’s marine plastic pollution and CO2 emission problems. Economic Systems Research. doi:10.1080/09535314.2018.1486808
- Lin, C., & Tsukui, M. (2014). “Analyzing the iron flow of China by using WIO-MFA”, 22th International Input-Output Conference (Lisboa School of Economics & Management in Lisbon, Portugal).
- Lin, C., Tsukui, M., Ji, K., & Lang, X. (2014). How Do the Waste Treatment Scenarios Affect the Environment Impact of Commute Approaches in China? An Application Based on the Waste Input-Output Table of China. 21th International Input-Output Conference, Kitakyushu International Conference Center in Kitakyushu, Japan).
- Lin, X., & Polenske, K. R. (1995). Input–output Anatomy of China's Energy Use changes in the 1980s. Economic Systems Research, 7(1), 67–84. https://doi.org/10.1080/09535319500000011
- Liu, Y., Chen, S., Chen, B., & Yang, W. (2017). Analysis of CO2 emissions embodied in China's bilateral trade: A non-competitive import input–output approach. Journal of Cleaner Production, 163, S410–S419. https://doi.org/10.1016/j.jclepro.2016.02.085
- Liu, Z., Adams, M., & Walker, T. R. (2018). Are exports of recyclables from developed to developing countries waste pollution transfer or part of the global circular economy? Resources, Conservation and Recycling, 136, 22–23. https://doi.org/10.1016/j.resconrec.2018.04.005
- Marques, A., Rodrigues, J., Lenzen and, M., & Domingos, T. (2012). Income-based environmental responsibility. Ecological Economics, 84(2), 57–65. https://doi.org/10.1016/j.ecolecon.2012.09.010
- METI Japan. (2014). Iron and Steel, Non-ferrous Metal and Fabricated Metals Statistics, Retrieved May 12, 2020, from https://www.meti.go.jp/statistics/tyo/seidou/result/ichiran/resourceData/01_tekko/nenpo/h26/h2daa2014kmc.xls, (in Japanese).
- METI Japan. (2018). The 12th Japan-China Energy Conservation and Environment Forum Held (Summary of the Results), Retrieved November 26, 2018, from http://www.meti.go.jp/english/press/2018/1126_002.html.
- MIC Japan. (2019). 2015 Input-Output Tables for Japan. Retrieved June 27, 2019, from. https://www.e-stat.go.jp/en/stat-search/files?page=1&layout=datalist&toukei=00200603&tstat=000001130583&cycle=0&year=20150&month=0&tclass1val=0).
- Ministry of Finance (MOF), Government of Japan. (2014). Trade Statistics, Retrieved March, 7, 2021, from https://www.customs.go.jp/toukei/srch/index.htm?M=01&P=0.
- Ministry of Industry and Information Technology of the People’s Republic of China. (2009). Regulations on the Administration of Recycling and Treatment of Waste Electric and Electronic Equipment. Retrieved March 31, 2019, from http://www.miit.gov.cn/n1146285/n1146352/n3054355/n3057254/n3057261/c3575250/content.html, (in Chinese).
- MOE Japan. (2009). Survey Results of General Waste Generation and Treatment 2007. Retrieved November 27, 2009, from. https://www.env.go.jp/recycle/waste_tech/ippan/h19/data/env_press.pdf.
- MOE Japan. (2010). 2007 Survey Results of Industrial Waste Generation and Treatment. Electronic data obtained from MOE Library (in Japanese).
- MOE Japan. (2016). Survey Results of General Waste Generation and Treatment 2014. Retrieved February 22, 2016, from. https://www.env.go.jp/recycle/waste_tech/ippan/h26/data/env_press.pdf.
- MOE Japan. (2017). Industrial Waste Generation and Treatment Survey 2016. Retrieved October 20, 2020, from https://www.e-stat.go.jp/stat-search/file-download?statInfId=000031861326&fileKind=2.
- MOE Japan. (2018). Input- Output-Table for Environmental Analysis; Retrieved May 24, 2021, from https://www.env.go.jp/ doc/toukei/renkanhyo.html. (in Japanese).
- MOE Japan. (2019a). The Tripartite Environment Ministers Meeting among China, Japan, and Korea (TEMM), Retrieved February 20, 2019, from https://www.env.go.jp/earth/coop/coop/english/dialogue/temm.html.
- MOE Japan. (2019b). Japan-China Environmental Policy Dialogue, Retrieved February 20, 2019, from https://www.env.go.jp/earth/coop/coop/english/dialogue/japan_china.html.
- MOF Japan. (2017). Trade Statistics for waste plastics (HS code 39.15), Retrieved May 23, 2021, from https://www.customs.go.jp/toukei/srch/index.htm?M=01&P=1,1,,,,,,,,4,1,2017,0,0,0,2,3915,,,,,,,,,,1,,,,,,,,,,,,,,,,,,,,,,200.
- MOF Japan. (2018). Trade Statistics for waste plastics (HS code 39.15). Retrieved May 23, 2021, from https://www.customs.go.jp/toukei/srch/index.htm?M=01&P=1,1,,,,,,,,4,1,2018,0,0,0,2,3915,,,,,,,,,,1,,,,,,,,,,,,,,,,,,,,,,200.
- MOF Japan. (2019). Trade Statistics for waste plastics (HS code 39.15). Retrieved May 23, 2021, from https://www.customs.go.jp/toukei/srch/index.htm?M=01&P=1,1,,,,,,,,4,1,2019,0,0,0,2,3915,,,,,,,,,,1,,,,,,,,,,,,,,,,,,,,,,200.
- MOF Japan. (2020). Trade Statistics for waste plastics (HS code 39.15), Retrieved May 23, 2021, from https://www.customs.go.jp/toukei/srch/index.htm?M=01&P=1,1,,,,,,,,4,1,2020,0,0,0,2,3915,,,,,,,,,,1,,,,,,,,,,,,,,,,,,,,,,200.
- Nakamura, S. (2020). Tracking the product origins of waste for treatment using the WIO data developed by the Japanese Ministry of the environment. Environmental Science and Technology, 54(23), 14862–14867. https://doi.org/10.1021/acs.est.0c06015
- Nakamura, S., & Kondo, Y. (2002). Input–output analysis of waste management. Journal of Industrial Ecology, 6(1), 39–64. https://doi.org/10.1162/108819802320971632
- Nakamura, S., & Kondo, Y. (2009). Waste input–output analysis: Concepts and application to industrial ecology. Springer.
- Nakatani, J., Fujii, M., Yoshida, A., Terazono, A., Moriguchi, Y., & Hirao, M. (2008). Comparison of domestic and bilateral recycling of post-consumer PET bottles. Journal of the Japan Society of Waste Management Experts, 19(5), 328–329. (in Japanese). https://doi.org/10.3985/jswme.19.328
- Nansai, K., Moriguchi, Y., & Touno, S. (2008). Embodied Energy and Emission Intensity Data for Japan Using Input-Output Tables. Retrieved June 20, 2018, from http://www.cger.nies.go.jp/publications/report/d031.
- Nansai, K., Moriguchi, Y., & Touno, S. (2019). Embodied Energy and Emission Intensity Data for Japan Using Input-Output Tables; Embodied environmental intensities on the producer's price basis for 2015. Retrieved November 22, 2019, from https://www.cger.nies.go.jp/publications/report/d031/jpn/datafile/download/2015/2015IOT_excl_int.xlsx.
- National Bureau of Statistics of the People’s Republic of China (NBSPRC). (2008a). China Statistical Yearbook.
- NBSPRC. (2008b). China Statistical Yearbook on Environment 2008.
- NBSPRC. (2009). China Input-output table 2007.
- NBSPRC. (2015a). China Input-output table 2014.
- NBSPRC. (2015b). China Statistical Yearbook 2015. Retrieved October 4, 2021, from http://www.stats.gov.cn/tjsj/ndsj/2015/indexeh.htm.
- NBSPRC. (2020). China Statistical Yearbook on Environment 2020.
- Nikkei Keizai Shinbun. (2019a). Retrieved January 12, 2019, from https://www.nikkei.com/article/DGXMZO39919430R10C19A1TJC000/. (in Japanese).
- Nikkei Keizai Shinbun. (2019b). Retrieved March 28, 2019, from https://www.nikkei.com/nkd/industry/article/?DisplayType=1&n_m_code=141&ng=DGKKZO42999560X20C19A3EA1000/, (in Japanese).
- Peter, G. P. (2008). From production-based to consumption-based national emission inventories. Ecological Economics, 65(1), 13–23. https://doi.org/10.1016/j.ecolecon.2007.10.014
- Peters, G. P., & Hertwich, E. G. (2008). CO2 embodied in International trade with implications for global Climate policy. Environmental Science & Technology, 42(5), 1401–1407. https://doi.org/10.1021/es072023k
- Peters, G. P., Weber, C. L., Guan, D., & Hubacek, K. (2007). China's growing CO2 emissions - a race between increasing consumption and efficiency gains. Environmental Science and Technology, 41(17), 5939–5944. https://doi.org/10.1021/es070108f
- Plastic Waste Management Institute. (2021). PWMI Newsletter Plastic Products, Plastic Waste and Resource Recovery [2019], Retrieved May 23, 2021, from http://www.pwmi.or.jp/ei/siryo/ei/ei_pdf/ei50.pdf.
- Qu, S., Guo, Y., Ma, Z., Chen, W., Liu, J., Liu, G., Wang, Y., & Xu, M. (2019). Implications of China’s foreign waste ban on the global circular economy. Resource, Conservation and Recycling, 144, 252–255. https://doi.org/10.1016/j.resconrec.2019.01.004
- Salemdeeb, R., Al-Tabbaa, A., & Reynolds, C. (2016). The UK waste input–output table: Linking waste generation to the UK economy. Waste Management & Research, 34(10), 1089–1094. https://doi.org/10.1177/0734242X16658545
- Sapporo City Environment Public Corporation. (2019). Nakanuma Plastic Recycling Center. Retrieved April 14, 2019, from http://www.kankyou-sapporo.jp/about/access/nakanuma_plastic, (in Japanese).
- Satake, M., Yamashige, Y., & Kikuchi, T. (2010). Export of recyclable materials and the Japanese recycling system: The case of used plastic bottles. The International Economy, 2010(14), 113–127. https://doi.org/10.5652/internationaleconomy.ie2010.07.s.y.k
- Sato, M. (2014). Embodied Carbon in trade: A survey of the empirical literature. Journal of Economic Surveys, 28(5), 831–861. https://doi.org/10.1111/joes.12027
- Sepúlveda, A., Schluep, M., Renaud, F. G., Streicher, M., Kuehr, R., Hagelüken, C., & Gerecke, A. C. (2010). A review of the environmental fate and effects of hazardous substances released from electrical and electronic equipments during recycling: Examples from China and India. Environmental Science & Technology, 30(1), 28–41. https://doi.org/10.1016/j.eiar.2009.04.001
- Shan, Y., Guan, D., Zheng, H., Ou, J., Li, Y., Meng, J., Mi, Z., Liu, Z., & Zhang, Q. (2018). Data Descriptor: China CO2 emission accounts 1997–2015, Scientific Data, Retrieved January 16, 2018, from https://www.nature.com/articles/sdata2017201.
- Statistics Bureau of Japan. (2008). Basic Survey on Employment Structure 2007. Retrieved July 3, 2008, from https://www.e-stat.go.jp/stat-search/file-download?statInfId=000001234527&fileKind=0, (in Japanese).
- Statistics Bureau of Japan. (2015). Basic Survey of Economic Census 2014, Retrieved November 30, 2015, from, https://www.e-stat.go.jp/stat-search/file-download?statInfId=000031332477&fileKind=1, (in Japanese).
- Statistics Bureau of Japan. (2017). Population estimates Long-term time series data. Retrieved June 28, 2017, from https://www.e-stat.go.jp/stat-search/file-download?statInfId=000013168601&fileKind=0, (in Japanese).
- Streets, D. G., Yu, C., Bergin, M. H., Wang, X., & Carmichael, G. R. (2006). Modeling study of air pollution due to the manufacture of export goods in China’s Pearl River delta. Environmental Science & Technology, 40(7), 2099–2107. https://doi.org/10.1021/es051275n
- Su, B., & Ang, B. W. (2013). Input–output analysis of CO2 emissions embodied in trade: Competitive versus non-competitive imports. Energy Policy, 56, 83–87. https://doi.org/10.1016/j.enpol.2013.01.041
- Su, B., Ang, B. W., & Low, M. (2013). Input–output analysis of CO2 emissions embodied in trade and the driving forces: Processing and normal exports. Ecological Economics, 88, 119–125. https://doi.org/10.1016/j.ecolecon.2013.01.017
- Terazono, A., & Yoshida, A. (2012). Exploring domestic flows and exports of used electrical and electronic equipment. Material Cycles and Waste Management Research, 23(4), 280–294. (in Japanese). https://doi.org/10.3985/mcwmr.23.280
- Terazono, A., Yoshida, A., Murakami, R., Murakami, S., & Shinkuma, T. (2009). Analysis of material cycle systems for e-waste and waste plastics in Asia, Research Report for Gran-in Aid for Scientific Research Related Waste Treatment 2008.
- Terazono, A., Yoshida, A., Yang, J., Moriguchi, Y., & Sakai, S. (2004). Journal of Material Cycles and Waste management. Material Cycles in Asia: Especially the Recycling Loop Between Japan and China, 6(2), 82–96. https://doi.org/10.1007/s10163-004-0115-0
- The Council for PET Bottle Recycling. (2019). PET bottle recycling overview. Retrieved April 14, 2019, from http://www.petbottle-rec.gr.jp/data/general_situation.html. (in Japanese).
- Timmer, M. P., Dietzenbacher, E., Los, B., Stehrer, R., & de Vries, G. J. (2015). An illustrated user guide to the world input–output database: The case of global automotive production. Review of International Economics, 23(3), 575–605. https://doi.org/10.1111/roie.12178
- Timmer, M. P., Erumban, A. A., Los, B., Stehrer, R., & de Vries, G. J. (2014). Slicing up global value chains. Journal of Economic Perspectives, 28(2), 99–118. https://doi.org/10.1257/jep.28.2.99
- Timmer, M. P., Los, B., Stehrer, R., & de Vries, G. J. (2013). Fragmentation, incomes and jobs: An analysis of European competitiveness. Economic Policy, 28(76), 613–661. https://doi.org/10.1111/1468-0327.12018
- Timmer, M. P., Los, B., Stehrer, R., & de Vries, G. J. (2016). An Anatomy of the Global Trade Slowdown based on the WIOD 2016 Release. GGDC research memorandum number 162, University of Groningen Retrieved March 30, 2021, from https://www.rug.nl/ggdc/html_publications/memorandum/gd162.pdf.
- Tsukui, M., & Lin, C. (2014a). The Difference and Interrelationship between China and Japan in Waste Generation and Treatment, The 9th Meeting of the Institute of Life Cycle Assessment, Japan LCA 2014 in Shibaura Institute of Technology, Japan.
- Tsukui, M., & Lin, C. (2014b). Repercussion Effects of Final Consumption on Production and Environmental Loads Using a China-Japan Waste Input-output Table, EcoBalance 2014 in Tsukuba, Japan.
- Wang, F., Li, Y., Zhang, W., He, P., Jiang, L., Cai, B., Zhang, J., Zhang, P., Pan, H., & Jiang, H. (2020). China's trade-off between economic benefits and sulfur dioxide emissions in changing global trade. Earth's Future, 8, e2019EF001354. https://doi.org/10.1029/2019EF001354
- Wang, Z., Wei S, J., Yu, X., & Zhu, K. (2017). Measures of Participation in Global Value Chain and Global Business Cycles, National Bureau of Economic Research Working Paper 23222.
- Wang, Z., Wei, S. J., & Zhu, K. (2013). Quantifying International production sharing at the bilateral and sector levels. National Bureau of Economic Research, 19677(8). https://www.nber.org/system/files/working_papers/w19677/w19677.pdf
- Weber, C. L., Peters, G. P., Guan, D., & Hubacek, K. (2008). The contribution of Chinese exports to climate change. Energy Policy, 36(9), 3572–3577. https://doi.org/10.1016/j.enpol.2008.06.009
- Wiedmann, T. (2016). Impacts embodied in global trade flows; Taking Stock of Industrial Ecology, Springer, 159–180.
- Wiedmann, T., Lenzen, M., Turner, K., & Barrett, J. (2007). Examining the global environmental impact of regional consumption activities —Part 2: Review of input–output models for the assessment of environmental impacts embodied in trade. Ecological Economics, 61(1), 15–26. https://doi.org/10.1016/j.ecolecon.2006.12.003
- WIOD. (2016). World Input-Output Tables, 2016 Release, WIOT 2014. Retrieved October 21, 2016, from http://www.wiod.org/protected3/data16/wiot_ROW/WIOT2014_Nov16_ROW.xlsb.
- Xiao, L., Lin, C., & Nakamura, S. (2020). Tracing the consumption Origins of wastewater and Sludge for a Chinese City based on Waste Input-Output analysis. Environmental Science & Technology, https://doi.org/10.1021/acs.est.0c01517
- Xu, M., Li, R., Crittenden, J. C., & Chen, Y. (2011). CO2 emissions embodied in China's exports from 2002 to 2008: A structural decomposition analysis. Energy Policy, 39(11), 7381–7388. https://doi.org/10.1016/j.enpol.2011.08.068
- Zhang, B., Chen, Z. M., Qiao, H., Chen, B., Hayat, T., & Alsaedi, A. (2015b). China's non-CO2 greenhouse gas emissions: Inventory and input-output analysis. Ecological Informatics, 26, 101–110. https://doi.org/10.1016/j.ecoinf.2014.01.009
- Zhang, W. C., Peng, S. J., & Sun, C. W. (2015a). CO2 emissions in the global supply chains of services: An analysis based on a multi-regional input-output model. Energy Policy, 86, 93–103. https://doi.org/10.1016/j.enpol.2015.06.029
- Zhu, Y., Shi, Y., Wu, J., Wu, L., & Xiong, W. (2018). Exploring the characteristics of CO2 emissions embodied in International trade and the fair share of responsibility. Ecological Economics, 146, 574–587. https://doi.org/10.1016/j.ecolecon.2017.12.020